Market Overview
| Study Period | 2019 - 2030 |
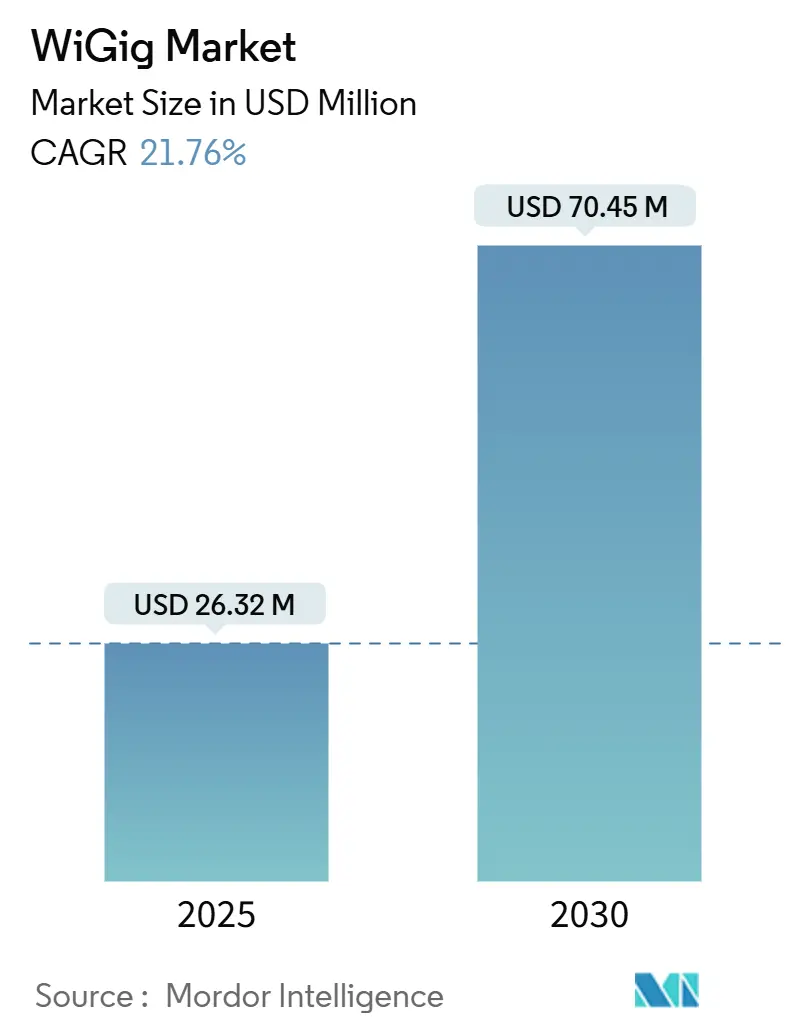
| Market Size (2025) | USD 26.32 Million |
| Market Size (2030) | USD 70.45 Million |
| Growth Rate (2025 - 2030) | 21.76% CAGR |
| Fastest Growing Market | Asia Pacific |
| Largest Market | North America |
| Market Concentration | Medium |
Major Players*Disclaimer: Major Players sorted in no particular order Image © Mordor Intelligence. Reuse requires attribution under CC BY 4.0. |
|
WiGig Market Analysis by Mordor Intelligence
The WiGig market size is valued at USD 26.32 billion in 2025 and is forecast to expand to USD 70.45 billion by 2030, translating into a 21.76% CAGR over the period. Commercial momentum is shifting from niche wireless-docking hubs toward broad integration in Wi-Fi 7 tri-band access points, premium laptops, and early 6G backhaul trials. Demand for 4K/8K video, AR/VR workloads, and edge-AI traffic is stretching the capacity of the 2.4 GHz and 5/6 GHz bands, making 60 GHz throughput indispensable for latency-sensitive applications. At the same time, semiconductor vendors are simplifying design cycles through system-on-chip solutions that cut power draw while shrinking form factors, a prerequisite for smartphones and ultra-thin notebooks. Finally, geopolitical pressures around gallium supply and diverging regional power-limit rules are prompting OEMs to qualify second-source suppliers and lobby regulators for harmonized 60 GHz frameworks, indicating that policy as well as technology will shape the WiGig market trajectory.
Key Report Takeaways
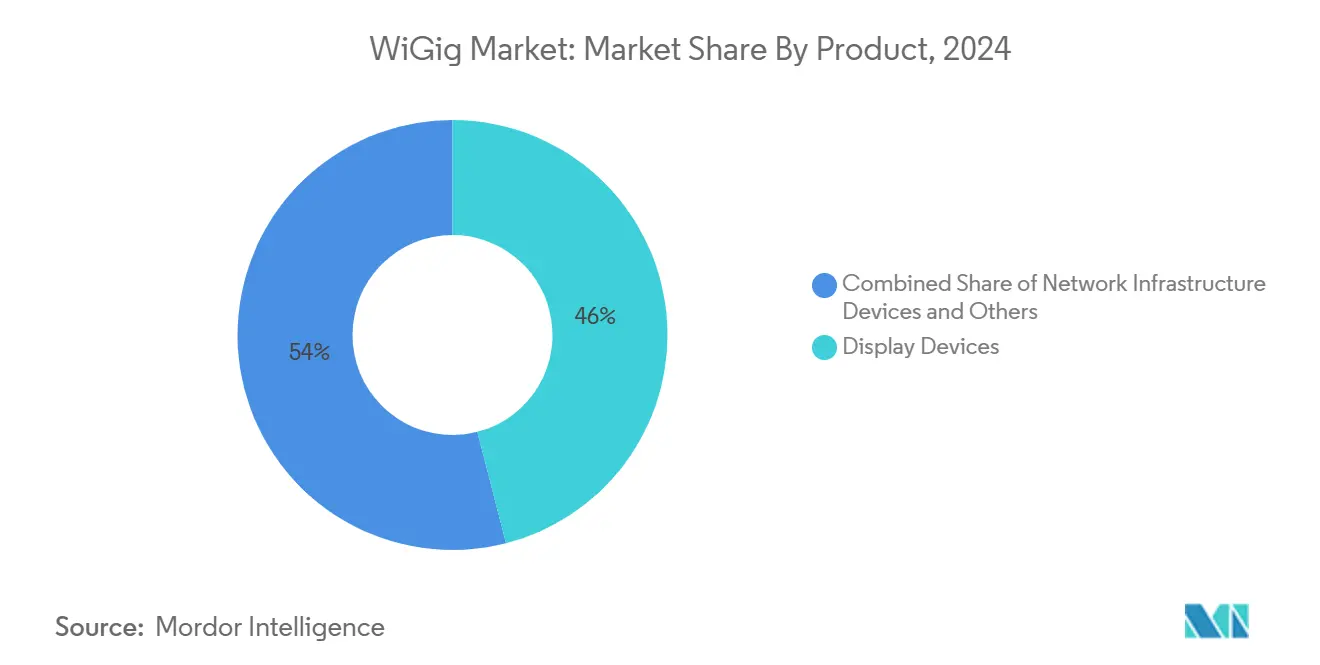
- By product category, display devices led with 46.0% revenue share in 2024; network infrastructure devices are projected to grow at a 28.40% CAGR to 2030.
- By technology, system-on-chip solutions accounted for 58.0% of the WiGig market share in 2024.
- By frequency band, IEEE 802.11ad systems held 50.0% share in 2024, while bonded IEEE 802.11ay equipment is set for a 22.01% CAGR through 2030.
- By application, gaming and multimedia captured 38.5% of the WiGig market size in 2024; smart manufacturing and Industrial IoT is advancing at a 29.10% CAGR to 2030.
- By end-user industry, consumer electronics represented 45.0% revenue share in 2024, whereas enterprise and datacenter deployments are expanding at a 21.98% CAGR.
- By geography, North America commanded 34.20% WiGig market share in 2024, while Asia Pacific is growing fastest at 23.50% CAGR.
Global WiGig Market Trends and Insights
Drivers Impact Analysis
| Driver | (~) % Impact on CAGR Forecast | Geographic Relevance | Impact Timeline |
|---|---|---|---|
| Surge in 4K/8K and XR streaming demand | +4.2% | Global; strongest in North America and Asia Pacific | Medium term (2-4 years) |
| Integration of 60 GHz tri-band radios in Wi-Fi 7 APs | +3.8% | North America and EU lead; Asia Pacific follows | Short term (≤ 2 years) |
| Rising attach-rate of WiGig-enabled laptops and smartphones | +3.1% | Premium device segments worldwide | Medium term (2-4 years) |
| Enterprise need for ultra-fast wireless docking | +2.9% | North America and EU enterprise campuses | Short term (≤ 2 years) |
| Edge-AI servers adopting 60 GHz back-plane links | +2.4% | Global data center hubs | Long term (≥ 4 years) |
| In-flight cabin connectivity pilots at 60 GHz | +1.8% | North America and EU aviation corridors | Long term (≥ 4 years) |
Source: Mordor Intelligence
Surge in 4K/8K and XR streaming demand
Ultra-high-definition content requires sustained 25-100 Mbps per stream, and households now run simultaneous 4K, 8K, and AR tasks. The 60 GHz layer supplies headroom where 2.4 GHz and 5/6 GHz traffic face interference and limited contiguous channel widths. In North America and Japan, pay-TV operators already bundle 8K sports feeds that push legacy Wi-Fi to its limits. Device OEMs therefore embed multi-gigabit radios so that premium televisions, consoles, and headsets can maintain sub-10 ms latencies without tethered links. As XR headsets scale in enterprise training and consumer gaming, dependable untethered throughput becomes a purchasing criterion, directly raising the addressable WiGig market.
Integration of 60 GHz tri-band radios in Wi-Fi 7 APs
Access-point vendors are shipping Wi-Fi 7 chipsets that aggregate 2.4 GHz, 5/6 GHz, and 60 GHz into a single platform. Multi-link operation hands sessions back and forth in real time, letting short-range devices jump to 60 GHz while distant clients remain on lower bands. This architecture reduces cabling costs for dense campuses and unlocks incremental software revenue from network-analytics tools that optimize band steering. European cloud offices deploying 10 Gbps fiber uplinks view tri-band Wi-Gig as a hedge against peak-hour congestion, underscoring how infrastructure integration converts WiGig from a luxury add-on into a baseline checklist item.[1]Broadcom, “BCM6765 Tri-Band Wi-Fi 7 Chipset Launch,” broadcom.com
Rising attach-rate of WiGig-enabled laptops and smartphones
Chipmakers now co-package WiGig alongside Bluetooth, 6 GHz Wi-Fi, and cellular radios, so device brands no longer face incremental PCB complexity. Flagship laptops employ the technology for one-click wireless docking that powers dual-4K monitors at work-from-anywhere desks. Smartphone makers trial 60 GHz file-transfer modes able to sync 4 GB videos in seconds, a differentiated feature for content-creator models. Corporate IT teams value the security of close-range 60 GHz links because the signal rarely exits room boundaries, reducing eavesdropping risk and making WiGig market adoption easier in regulated industries.
Enterprise need for ultra-fast wireless docking
Hybrid work policies require desks that convert between hoteling and resident use within minutes. WiGig eliminates cable clutter while preserving the deterministic performance traders, CAD engineers, and video editors expect from wired links. Early pilots show 25% workspace densification when cables are removed, generating measurable facility-cost savings that justify premium access-point pricing. Manufacturers of conference-room gear are integrating 60 GHz modules to stream uncompressed content to large panels, broadening WiGig market penetration into collaboration hardware segments.[2]Cisco Systems, “Ultra-Reliable Wireless Backhaul for Industry 4.0,” cisco.com
Restraints Impact Analysis
| Restraint | (≈) % Impact on CAGR Forecast | Geographic Relevance | Impact Timeline |
|---|---|---|---|
| Limited range and strict line-of-sight | -3.4% | Global; most acute in outdoor links | Short term (≤ 2 years) |
| Substitution risk from Wi-Fi 6E/7 and 5G mmWave | -2.8% | Global; varies by mobility needs | Medium term (2-4 years) |
| Thermal design limits in handheld 60 GHz radios | -1.9% | Global mobile device market | Medium term (2-4 years) |
| Fragmented 60 GHz EIRP regulations | -1.5% | Global, with regional variations | Long term (≥ 4 years) |
Source: Mordor Intelligence
Limited range and strict line-of-sight
At 60 GHz, oxygen absorption and wall attenuation curb links to roughly 10 meters, so access points must be installed in every conference room or factory cell. Even glass partitions can halve throughput, and moving people create fading that requires beam-tracking algorithms. Field tests on autonomous vehicles show packet-loss spikes when small obstacles break Fresnel zones, reinforcing that WiGig rollouts need precise site surveys. Such constraints restrict the technology to high-density venues or fixed setups, limiting broader consumer adoption and trimming WiGig market expectations in mass-market home routers.
Substitution risk from Wi-Fi 6E/7 and 5G mmWave
Wi-Fi 7 delivers 320 MHz channels and 4K-QAM, achieving client rates above 5 Gbps with better propagation. Simultaneously, operators deploy 5G mmWave small cells that blend licensed spectrum with carrier-grade mobility. Enterprises comparing upgrade paths often select 6 GHz Wi-Fi because it reuses existing site wiring and covers larger footprints. Analysts forecast over 800 million 6 GHz-capable devices shipping in 2024 alone, creating an enormous installed base that can satisfy many but not all multi-gigabit workloads. Consequently, price-sensitive buyers may postpone WiGig installations, tempering addressable WiGig market growth.
Segment Analysis
By Product: Display Devices Drive Consumer Adoption
Display devices commanded 46.0% of the WiGig market in 2024, demonstrating how wireless monitors, docking stations, and AR/VR headsets still anchor near-term revenue. The sub-segment benefits from households seeking clutter-free gaming corners and offices migrating to hot-desking layouts. Wireless hubs that host dual 4K screens and SSD-grade peripherals already appear in premium enterprise bundles, showing that design-once, deploy-many efficiencies favor WiGig over USB-C cabling for new builds. AR/VR headset makers rely on 60 GHz to avoid nausea-inducing latency, and upcoming mixed-reality rollouts will further lift unit volumes. Televisions and projectors integrate WiGig for uncompressed 8K streams across a living room, but adoption lags because a single wall can impair reception.
Network infrastructure devices are the fastest-growing slice at 28.40% CAGR, a trajectory driven by Wi-Fi 7 tri-band access points shipping into corporate refresh cycles. Edge-compute nodes inside factories now leverage 60 GHz backhaul to sidestep fiber trenching, reducing installation lead-times by up to 70%. Municipal kiosk vendors experiment with 60 GHz radios for pop-up broadband in dense downtown corridors where digging permits add months to fiber projects. Early metrics show link availability above 99% when clear line-of-sight is maintained, validating that backhaul can be a high-margin adjacency for the WiGig market.
By Technology: System-on-Chip Integration Dominates
System-on-chip designs held 58.0% share of the WiGig market in 2024 and are projected to grow at 23.0% CAGR through 2030. Unified dies integrate baseband, RF front-end, and power management, cutting board space by up to 30% and extending smartphone battery life. As foundries perfect sub-3 nm nodes, the incremental cost of adding a 60 GHz block falls, accelerating attach rates in mid-tier devices. Qualcomm’s latest platforms pack WiGig, 6 GHz Wi-Fi, Bluetooth LE Audio, and 5G radios into one substrate, reducing vendor qualification cycles from quarters to weeks.
Discrete integrated-circuit implementations remain relevant where legacy boards need drop-in modules or where industrial gear demands ruggedized packages. Medical imaging carts, for instance, retrofit 60 GHz cards without redesigning the entire motherboard. Intel’s 18A roadmap targets both monolithic and tile-based architectures so that OEMs can mix high-performance CPU cores with specialized radio tiles, underscoring how manufacturing advances keep multiple bill-of-materials paths viable.[3]Intel Corporation, “Manufacturing Roadmap and CHIPS Act Updates,” intel.com The interplay between SoC convenience and discrete flexibility should balance innovation risk, supporting continued WiGig market expansion.
By Frequency Band: IEEE 802.11ad Leads Current Deployments
The 57–66 GHz block underpinning IEEE 802.11ad retained 50.0% share in 2024 because its regulatory footing and silicon maturity inspire OEM confidence. Enterprises deploying wireless docking favor known-good chipsets, even though throughput caps at 7 Gbps. Meanwhile, vendors position 66–71 GHz extensions as mid-band relief valves that piggyback on existing antenna arrays without retooling enclosures.
The 71–86 GHz region, standardized under IEEE 802.11ay, is forecast for 22.01% CAGR as bonded channels lift theoretical rates above 40 Gbps. Urban backhaul pilots in Chicago and Seoul already stream 8K surveillance video over bonded links, avoiding monthly fiber fees. Regulatory bodies in Europe and the United States continue to harmonize power masks, promising smoother certification flows that will lower time-to-market and enlarge the WiGig market opportunity.
By Application: Gaming Leads, Manufacturing Accelerates
Gaming and multimedia secured 38.5% of the WiGig market in 2024, reflecting consumers’ appetite for untethered VR headsets and lag-free 8K streaming. Console makers embed 60 GHz radios so that multi-player e-sports sessions avoid bandwidth clashes with smart-home gadgets. Streaming-box vendors bundle WiGig adapters to guarantee bit-perfect playback, carving out premium subscription tiers that monetize bandwidth assurance.
Smart manufacturing and Industrial IoT represent the fastest application cluster at 29.10% CAGR. Factory planners deploy WiGig to link high-speed cameras, robotic arms, and edge-AI servers when electromagnetic noise or moving parts complicate cabling. Early audits in Japanese automotive plants reveal 15% uptime improvement after replacing aging wired slip-rings with 60 GHz links, confirming that productivity gains can offset equipment premiums. As predictive maintenance and digital twin simulations proliferate, deterministic wireless backbones will cement WiGig market relevance in heavy industry.

Note: Segment shares of all individual segments available upon report purchase
By End-user Industry: Consumer Electronics Dominates
Consumer electronics captured 45.0% of 2024 revenue, buoyed by a cycle of flagship smartphones and ultra-thin laptops that advertise multi-gigabit file transfer and instant wireless desktop modes. Component prices have fallen nearly 18% over two years as SoC volumes climb, further widening the addressable WiGig market among mid-range devices. TV makers repurpose 60 GHz links for low-latency cloud-gaming subscriptions, blending content and connectivity into recurring-revenue bundles.
Enterprise and datacenter environments post a 21.98% CAGR outlook as hyperscale operators test 60 GHz server-to-server links that free up switch ports for external traffic. In co-location halls where every rack unit counts, operators appreciate cable reduction and airflow improvements afforded by short-reach wireless. Aerospace and defense integrators also evaluate WiGig for secure line-of-sight telemetry because the narrow beams reduce interception risk, suggesting specialized contracts will further diversify the WiGig market.
Geography Analysis
North America accounted for 34.20% of the WiGig market in 2024, owing to early enterprise adoption, CHIPS-Act-funded semiconductor investments, and FCC rules that allow higher EIRP than most regions. Financial-services firms in New York deploy wireless docking to maximize real-estate density, and West-Coast tech campuses use 60 GHz links in agile work pods. Canada mirrors U.S. patterns in banking and media verticals, while Mexico’s maquiladora corridor pilots WiGig-based AGV fleets to raise export manufacturing competitiveness.
Asia Pacific is the growth engine with a 23.50% CAGR to 2030. Japan’s networking OEMs were the first to certify tri-band Wi-Fi 7 access points that embed WiGig radios; early municipal deployments in Tokyo target stadium concourses ahead of large-scale events.[4]PR TIMES, “Panasonic EW Networks Launches Wi-Fi 7 Access Point,” prtimes.jpChina’s consumer-electronics giants build 60 GHz capability into televisions and laptops to differentiate in crowded domestic channels, although export clearance may face geopolitical headwinds tied to gallium supply chains. South Korea bundles WiGig in premium smartphones, leveraging its dense 5G backbone for tri-band offload, while Singapore pilots 60 GHz links in financial district smart lamp-posts, underscoring region-wide digital-transformation momentum.
Europe exhibits heterogeneous progress. Germany and the United Kingdom lead with smart-factory retrofits that rely on deterministic wireless, but Southern Europe’s slower capital-spending pulls regional penetration below global averages. ETSI standards harmonize technical parameters, yet power-limit disparities across EU nations raise extra certification work that delays rollouts. The Middle East and Africa remain nascent; Dubai’s fintech hubs evaluate WiGig for trading floors, and South-Africa mines test 60 GHz links for real-time drilling analytics. However, capex constraints and terrain challenges temper near-term uptake, leaving considerable headroom for the WiGig market as regional GDP and connectivity initiatives advance.

Competitive Landscape
The WiGig market is moderately concentrated. Qualcomm, Intel, and Broadcom capitalize on deep RF portfolios and foundry leverage to supply more than half of total chip shipments. Their scale allows yearly silicon spins that keep pace with evolving IEEE drafts, locking in design wins across laptops, handsets, and enterprise infrastructure. Qualcomm reinforces that positioning by bundling licensing of beam-forming IP with Snapdragon platforms, while Intel extends its vPro ecosystem to wireless-docking use cases so that IT departments can manage 60 GHz endpoints within familiar toolsets. Broadcom targets high-end routers and carrier gateways, translating its Wi-Fi 6E dominance into early Wi-Fi 7 tri-band sockets.
Second-tier contenders focus on vertical differentiation. MaxLinear and Peraso offer industrial-temperature chipsets with extended-range beam-steering, enabling harsh-environment deployments that integrated smartphone silicon cannot address. Start-ups in Israel and Taiwan develop metasurface antennas and thermal-spreader substrates, seeking to license designs that mitigate two of WiGig’s core pain points—path loss and heat. Downstream, TP-Link, Cisco, and Aruba incorporate 60 GHz radios into tri-band access points, bundling management analytics that recommend optimal device-band assignments in real time. In the device arena, Lenovo and Dell launch business-class laptops standardizing on WiGig docks to trim peripheral BOM from every carton.
Strategic alliances underscore the race to build full-stack ecosystems. Semiconductor vendors co-fund reference-design programs with ODMs to shrink integration timelines, while cloud-service providers run proof-of-concepts that demonstrate wire-speed storage replication over 60 GHz links inside containerized edge pods. Automotive Tier-1s partner with chipmakers to certify in-cabin infotainment interconnects, opening an avenue that could swell the WiGig market once regulatory safety tests conclude. Across all fronts, the competitive narrative revolves around time-to-market, thermal performance, and coexistence algorithms rather than raw throughput, reflecting the maturity arc typical of connectivity standards.
WiGig Industry Leaders
-
Panasonic Corporation
-
Qualcomm Technologies, Inc.
-
Intel Corporation
-
Broadcom Inc.
-
Peraso Technologies, Inc.
- *Disclaimer: Major Players sorted in no particular order

Need More Details on Market Players and Competitors?
Download PDF
Recent Industry Developments
- June 2025: NTT Corporation achieved a world-record 280 Gbps data rate using a wideband 300 GHz amplifier, showing a technology path that could expand ultra-high-frequency wireless beyond present WiGig ceilings.
- June 2025: TP-Link Japan released the BE9300 Wi-Fi 7 access point EAP772-Outdoor with IP68 sealing, underscoring tri-band rollouts that complement indoor WiGig deployments.
- June 2025: BeMap unveiled Japan’s first Wi-Fi 7 access point with IEEE 802.11bf motion-sensing, signaling convergence of communication and radar feature.
- May 2025: Qualcomm posted Q2 2025 revenue of USD 10.84 billion, citing automotive and IoT diversification adjacent to WiGig portfolios.
Global WiGig Market Report Scope
WiGig, also known as 60 GHz Wi-Fi, refers to a set of 60 GHz wireless network protocols. It enables high-performance wireless data, display, and audio applications. WiGig transfers data wirelessly on the 60 GHz frequency, unlike Wi-Fi 6 and other normal versions of Wi-Fi that use the 2.4 GHz or 5 GHz frequencies. The study covers the market based on product type and application in different sectors across the world.
The WiGig market is segmented by product (display devices and network infrastructure devices), application (gaming and multimedia and networking), and geography (North America, Europe, Asia-Pacific, and the Rest of the World). The market sizes and forecasts are provided in terms of value (USD) for all the above segments.
| By Product | Display Devices | Wireless Docking Stations | |
| AR/VR Headsets | |||
| Televisions and Projectors | |||
| Network Infrastructure Devices | Access Points and Routers | ||
| Backhaul Radios | |||
| Others | |||
| By Technology | System-on-Chip (SoC) | ||
| Integrated Circuit (IC) | |||
| By Frequency Band | 57-66 GHz (IEEE 802.11ad) | ||
| 66-71 GHz | |||
| 71-86 GHz (IEEE 802.11ay bonded) | |||
| By Application | Gaming and Multimedia | ||
| Enterprise Wireless Docking | |||
| Networking and Data Transfer | |||
| In-vehicle Infotainment | |||
| Smart Manufacturing / IIoT | |||
| By End-user Industry | Consumer Electronics | ||
| Enterprise and Datacenter | |||
| Automotive and Transportation | |||
| Industrial and Manufacturing | |||
| Aerospace and Defense | |||
| By Geography | North America | United States | |
| Canada | |||
| Mexico | |||
| South America | Brazil | ||
| Argentina | |||
| Europe | Germany | ||
| United Kingdom | |||
| France | |||
| Russia | |||
| Asia Pacific | China | ||
| India | |||
| Japan | |||
| South Korea | |||
| ASEAN | |||
| Rest of Asia Pacific | |||
| Middle East | Saudi Arabia | ||
| United Arab Emirates | |||
| Turkey | |||
| Rest of Middle East | |||
| Africa | South Africa | ||
| Nigeria | |||
| Rest of Africa | |||
By Product
| Display Devices | Wireless Docking Stations |
| AR/VR Headsets | |
| Televisions and Projectors | |
| Network Infrastructure Devices | Access Points and Routers |
| Backhaul Radios | |
| Others |
By Technology
| System-on-Chip (SoC) |
| Integrated Circuit (IC) |
By Frequency Band
| 57-66 GHz (IEEE 802.11ad) |
| 66-71 GHz |
| 71-86 GHz (IEEE 802.11ay bonded) |
By Application
| Gaming and Multimedia |
| Enterprise Wireless Docking |
| Networking and Data Transfer |
| In-vehicle Infotainment |
| Smart Manufacturing / IIoT |
By End-user Industry
| Consumer Electronics |
| Enterprise and Datacenter |
| Automotive and Transportation |
| Industrial and Manufacturing |
| Aerospace and Defense |
By Geography
| North America | United States |
| Canada | |
| Mexico | |
| South America | Brazil |
| Argentina | |
| Europe | Germany |
| United Kingdom | |
| France | |
| Russia | |
| Asia Pacific | China |
| India | |
| Japan | |
| South Korea | |
| ASEAN | |
| Rest of Asia Pacific | |
| Middle East | Saudi Arabia |
| United Arab Emirates | |
| Turkey | |
| Rest of Middle East | |
| Africa | South Africa |
| Nigeria | |
| Rest of Africa |
Need A Different Region or Segment?
Customize Now
Key Questions Answered in the Report
What is the current value of the WiGig market?
The WiGig market size stands at USD 26.32 billion in 2025 and is projected to exceed USD 70.45 billion by 2030.
Which region is growing fastest in WiGig adoption?
Asia Pacific leads growth with a forecast 23.50% CAGR through 2030, propelled by Wi-Fi 7 rollouts and manufacturing digitalization.
Why are system-on-chip solutions dominating the WiGig landscape?
SoC designs integrate 60 GHz radios with baseband and power management on one die, trimming board space and boosting energy efficiency, which accelerates adoption in smartphones and laptops.
What are the main restraints limiting broader WiGig deployment?
Short-range, line-of-sight requirements and competition from Wi-Fi 6E/7 and 5G mmWave technologies curb uptake outside high-bandwidth, short-reach environments.
Which application segment currently generates the most revenue?
Gaming and multimedia hold 38.5% share, driven by wireless VR and 8K streaming demands that rely on WiGig’s ultra-low latency and high throughput.
How concentrated is the WiGig vendor landscape?
With the top five suppliers controlling just over 60% of revenue, the market earns a 6/10 concentration score, indicating moderate consolidation but continuing room for new entrants.
Page last updated on: June 19, 2025

