
Metaverse Market Size and Share
Market Overview
| Study Period | 2019 - 2030 |
|---|---|
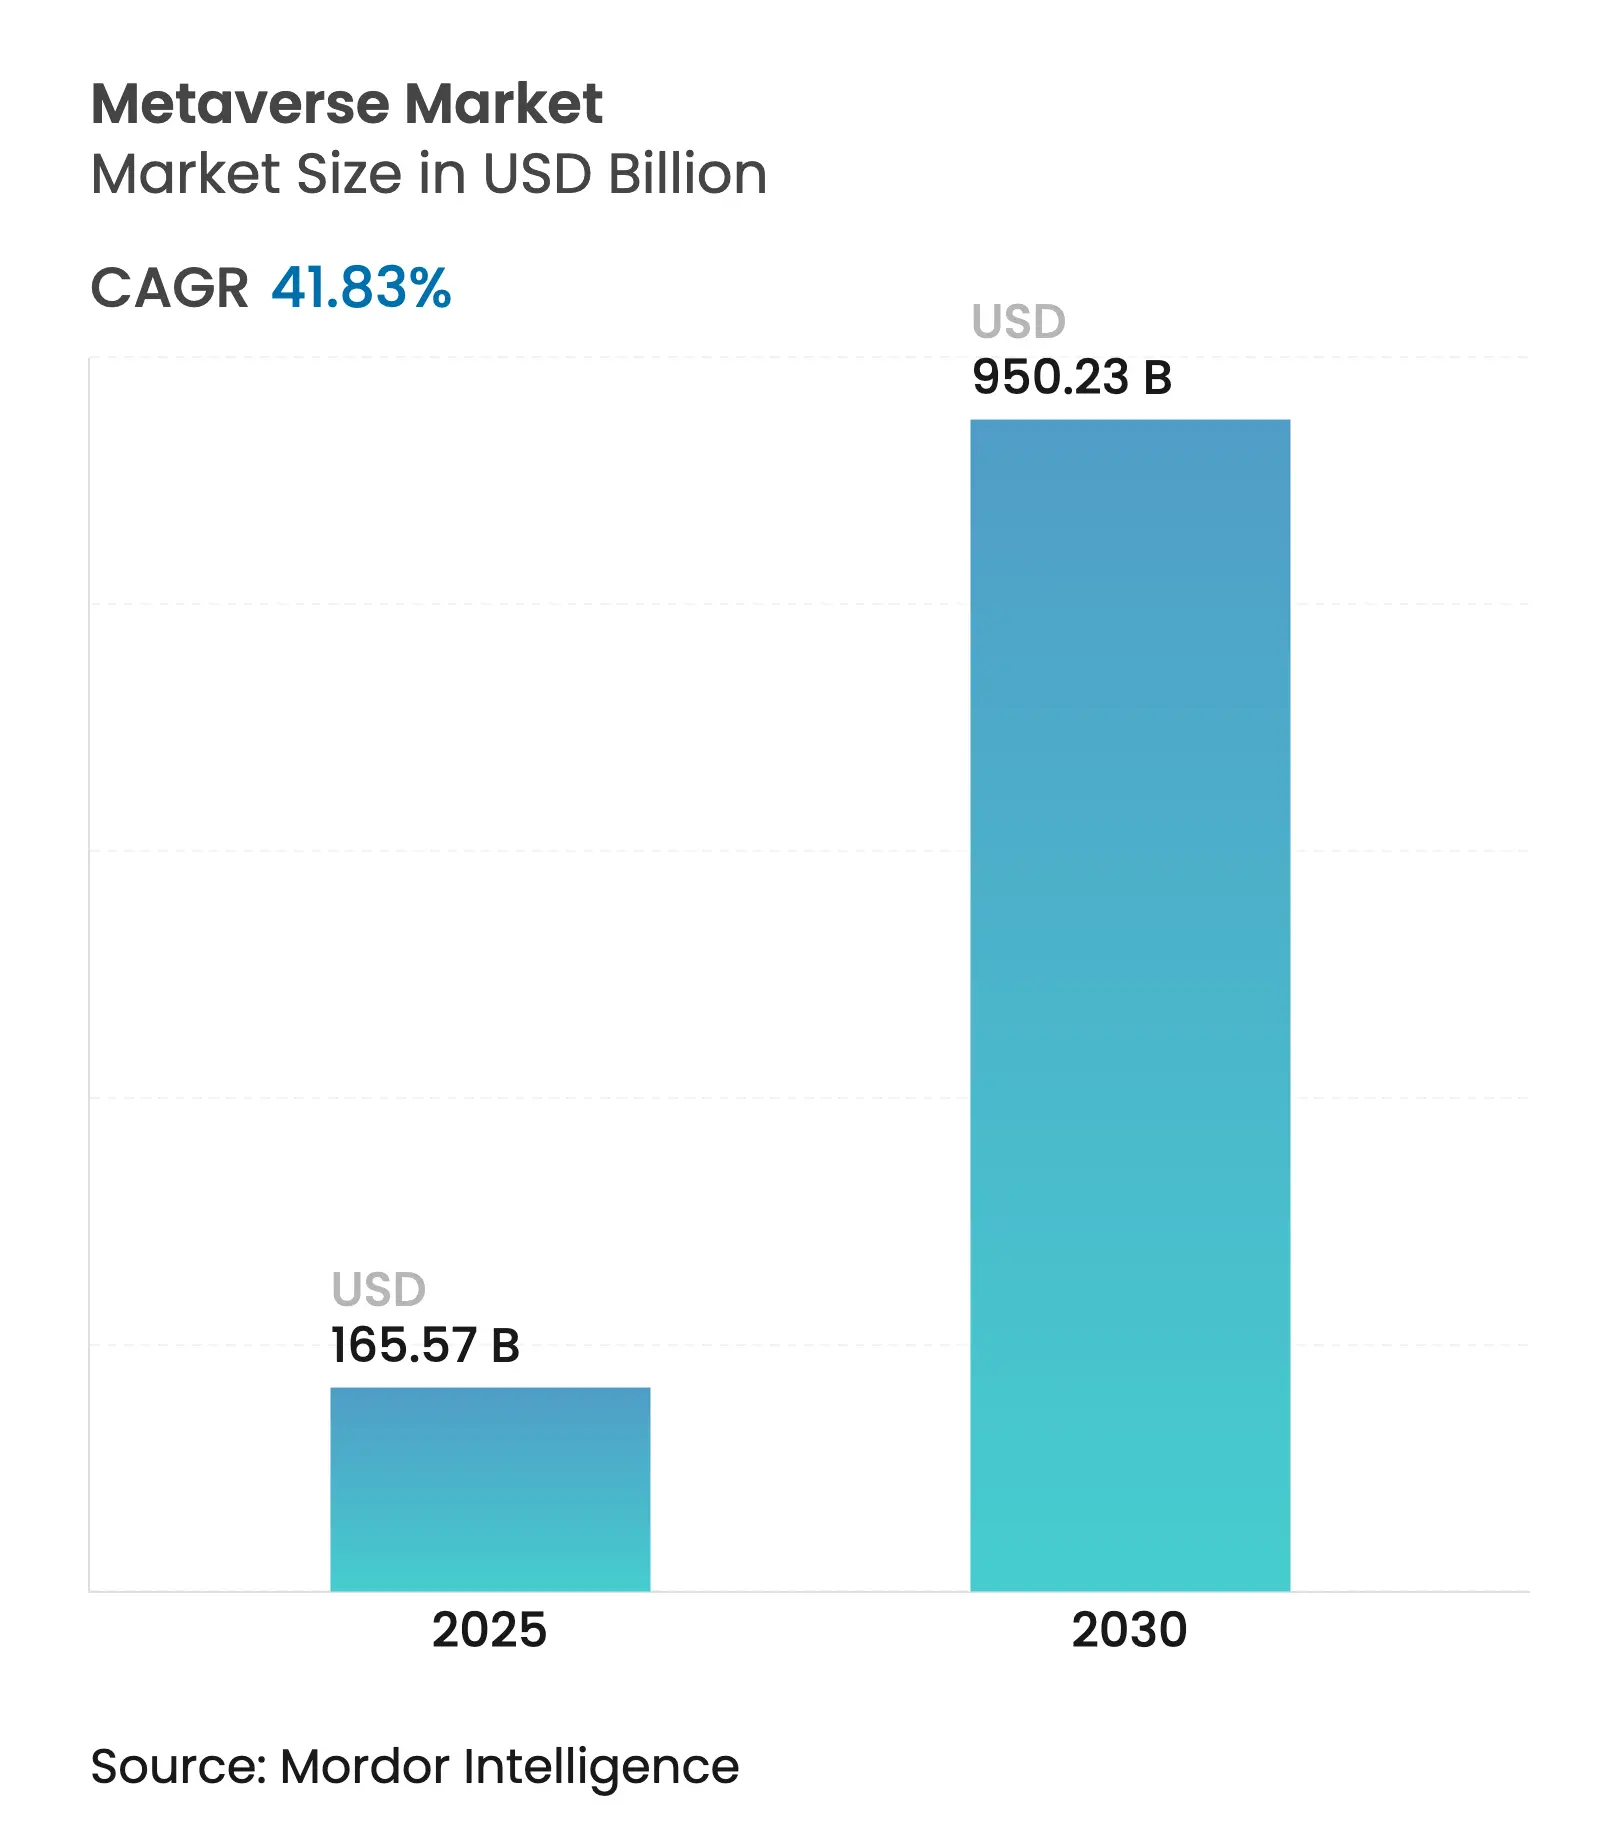
| Market Size (2025) | USD 165.57 Billion |
| Market Size (2030) | USD 950.23 Billion |
| Growth Rate (2025 - 2030) | 41.83 % CAGR |
| Fastest Growing Market | Asia-Pacific |
| Largest Market | North America |
| Market Concentration | Medium |
Major Players *Disclaimer: Major Players sorted in no particular order. Image © Mordor Intelligence. Reuse requires attribution under CC BY 4.0. |

Metaverse Market Analysis by Mordor Intelligence
The metaverse market stood at USD 165.57 billion in 2025 and is forecast to reach USD 950.23 billion by 2030, expanding at a 41.83% CAGR, which places it among the fastest-growing technology segments worldwide. Intensifying enterprise demand for industrial digital twins, immersive commerce and real-time collaboration platforms is accelerating mainstream adoption. Rapid advances in AR/VR optics, cloud-edge infrastructure and 5G network slicing are compressing latency and broadening addressable use cases. Big Tech capital-expenditure cycles topping USD 80 billion annually provide the compute backbone and developer tooling that smaller firms quickly leverage for vertical-focused solutions. Monetization is diversifying from advertising toward virtual goods, subscriptions and industrial services, underpinning longer-term revenue stability. Meanwhile, privacy regulation, sustainability scrutiny and hardware ergonomics remain the principal brake on full-scale consumer uptake.
Key Report Takeaways
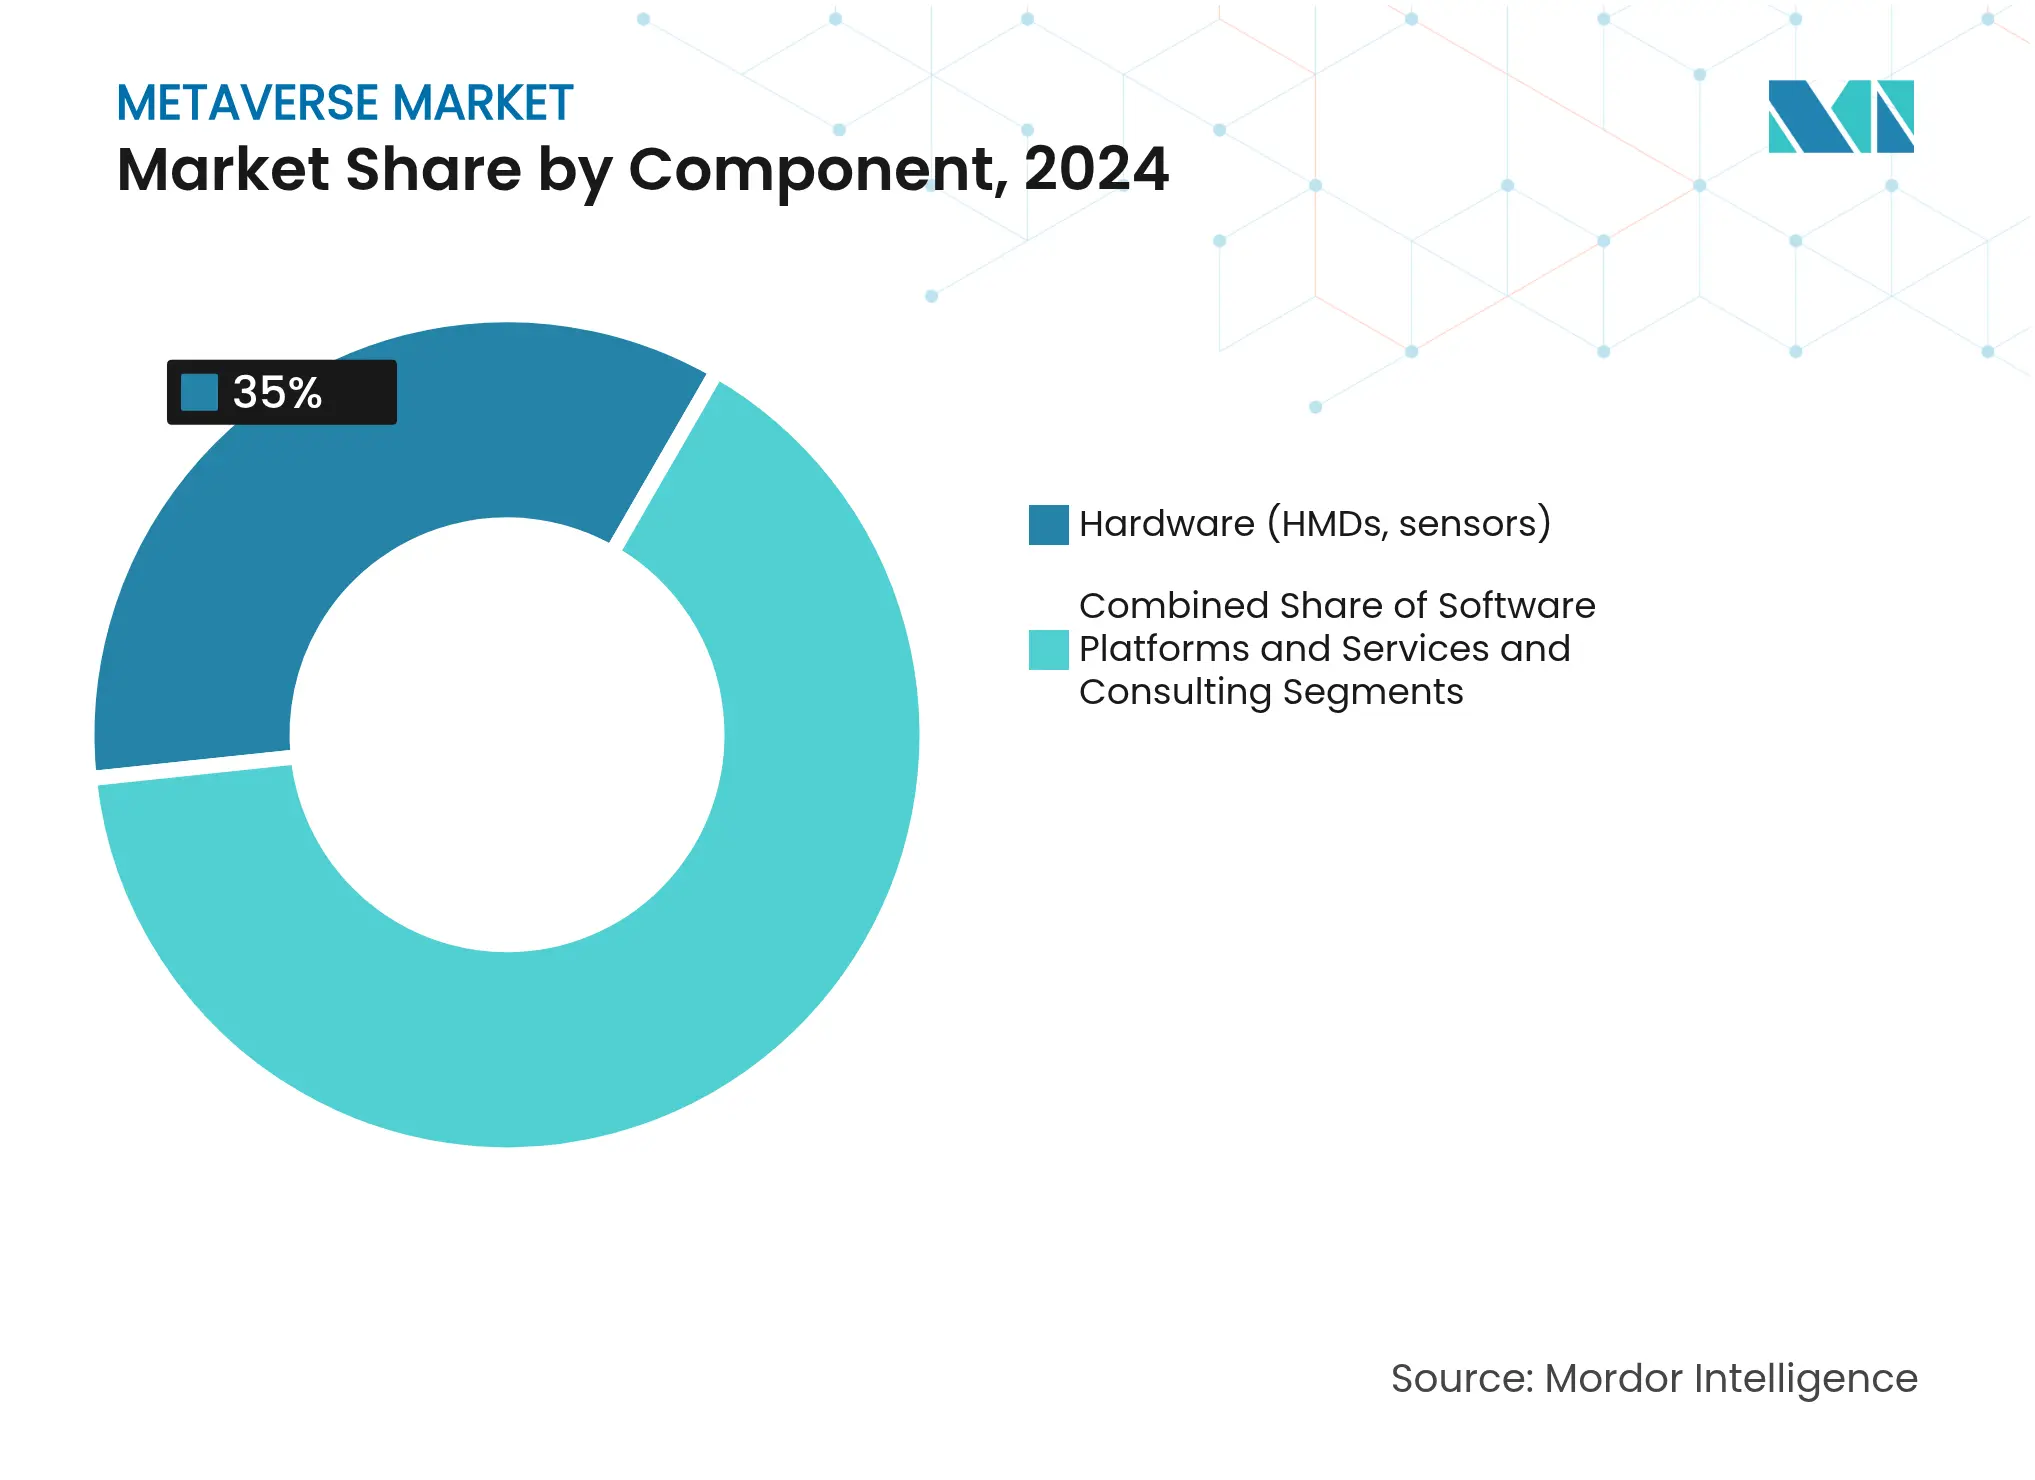
- By component, hardware led with 35% of the metaverse market share in 2024, while services & consulting is advancing at a 48% CAGR to 2030.
- By platform type, centralized closed platforms accounted for 46% revenue share in 2024; industrial/digital-twin platforms record the fastest 45% CAGR through 2030.
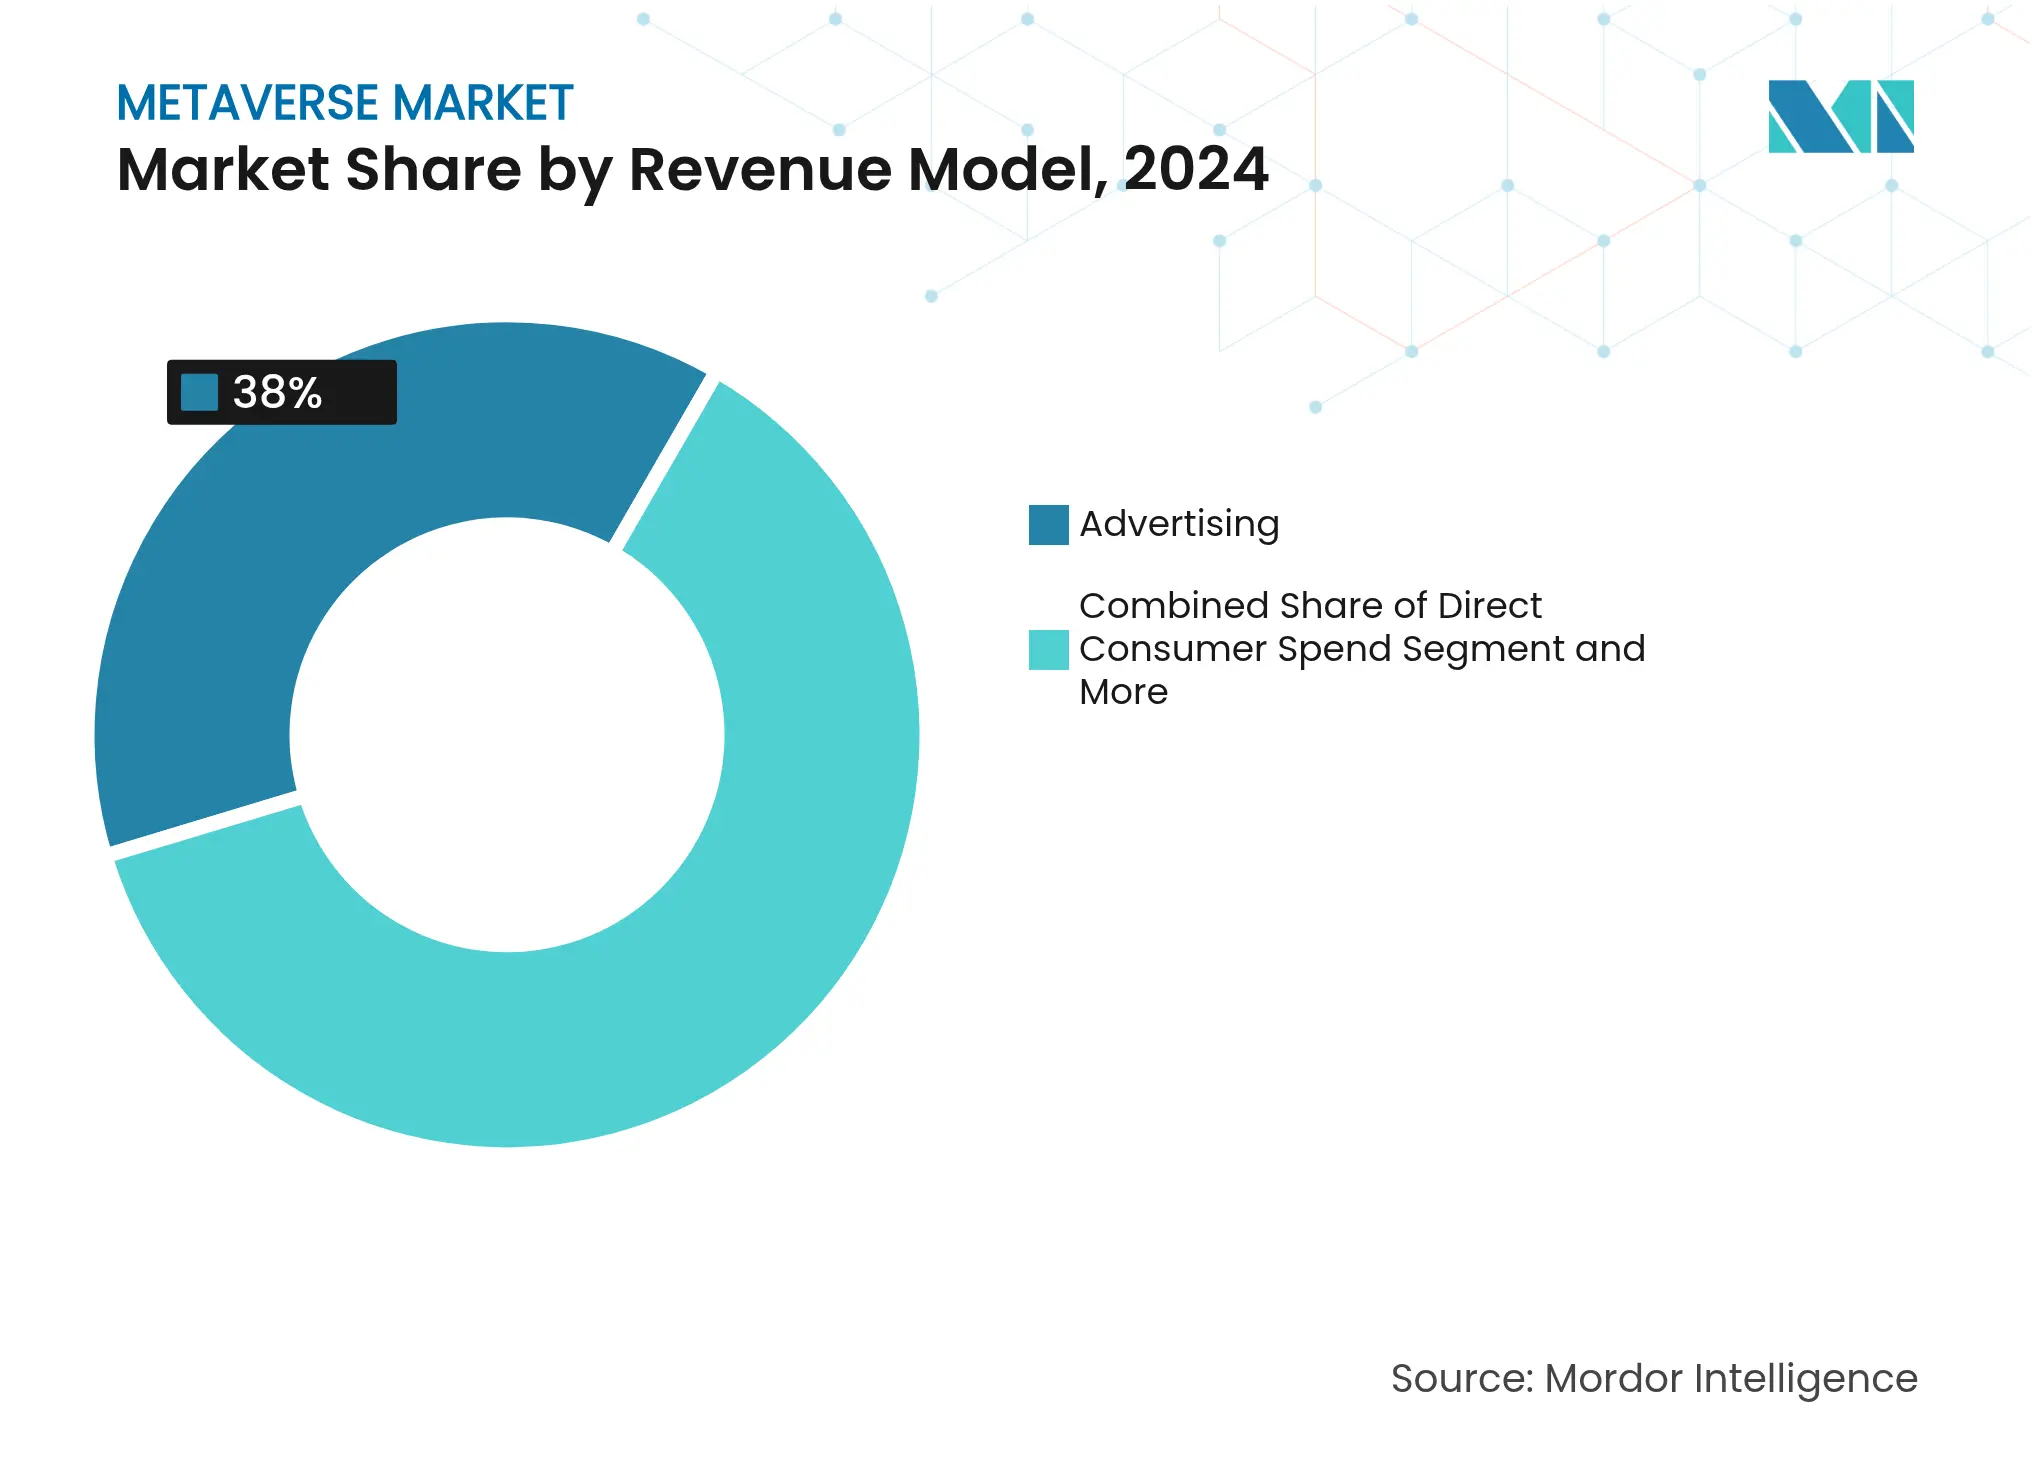
- By revenue model, advertising contributed 38% of the metaverse market size in 2024, whereas virtual goods & NFTs are tracking a 47% CAGR between 2025-2030.
- By end-user industry, gaming & esports held 42% of the metaverse market share in 2024; corporate/industrial users are growing at a 44% CAGR to 2030.
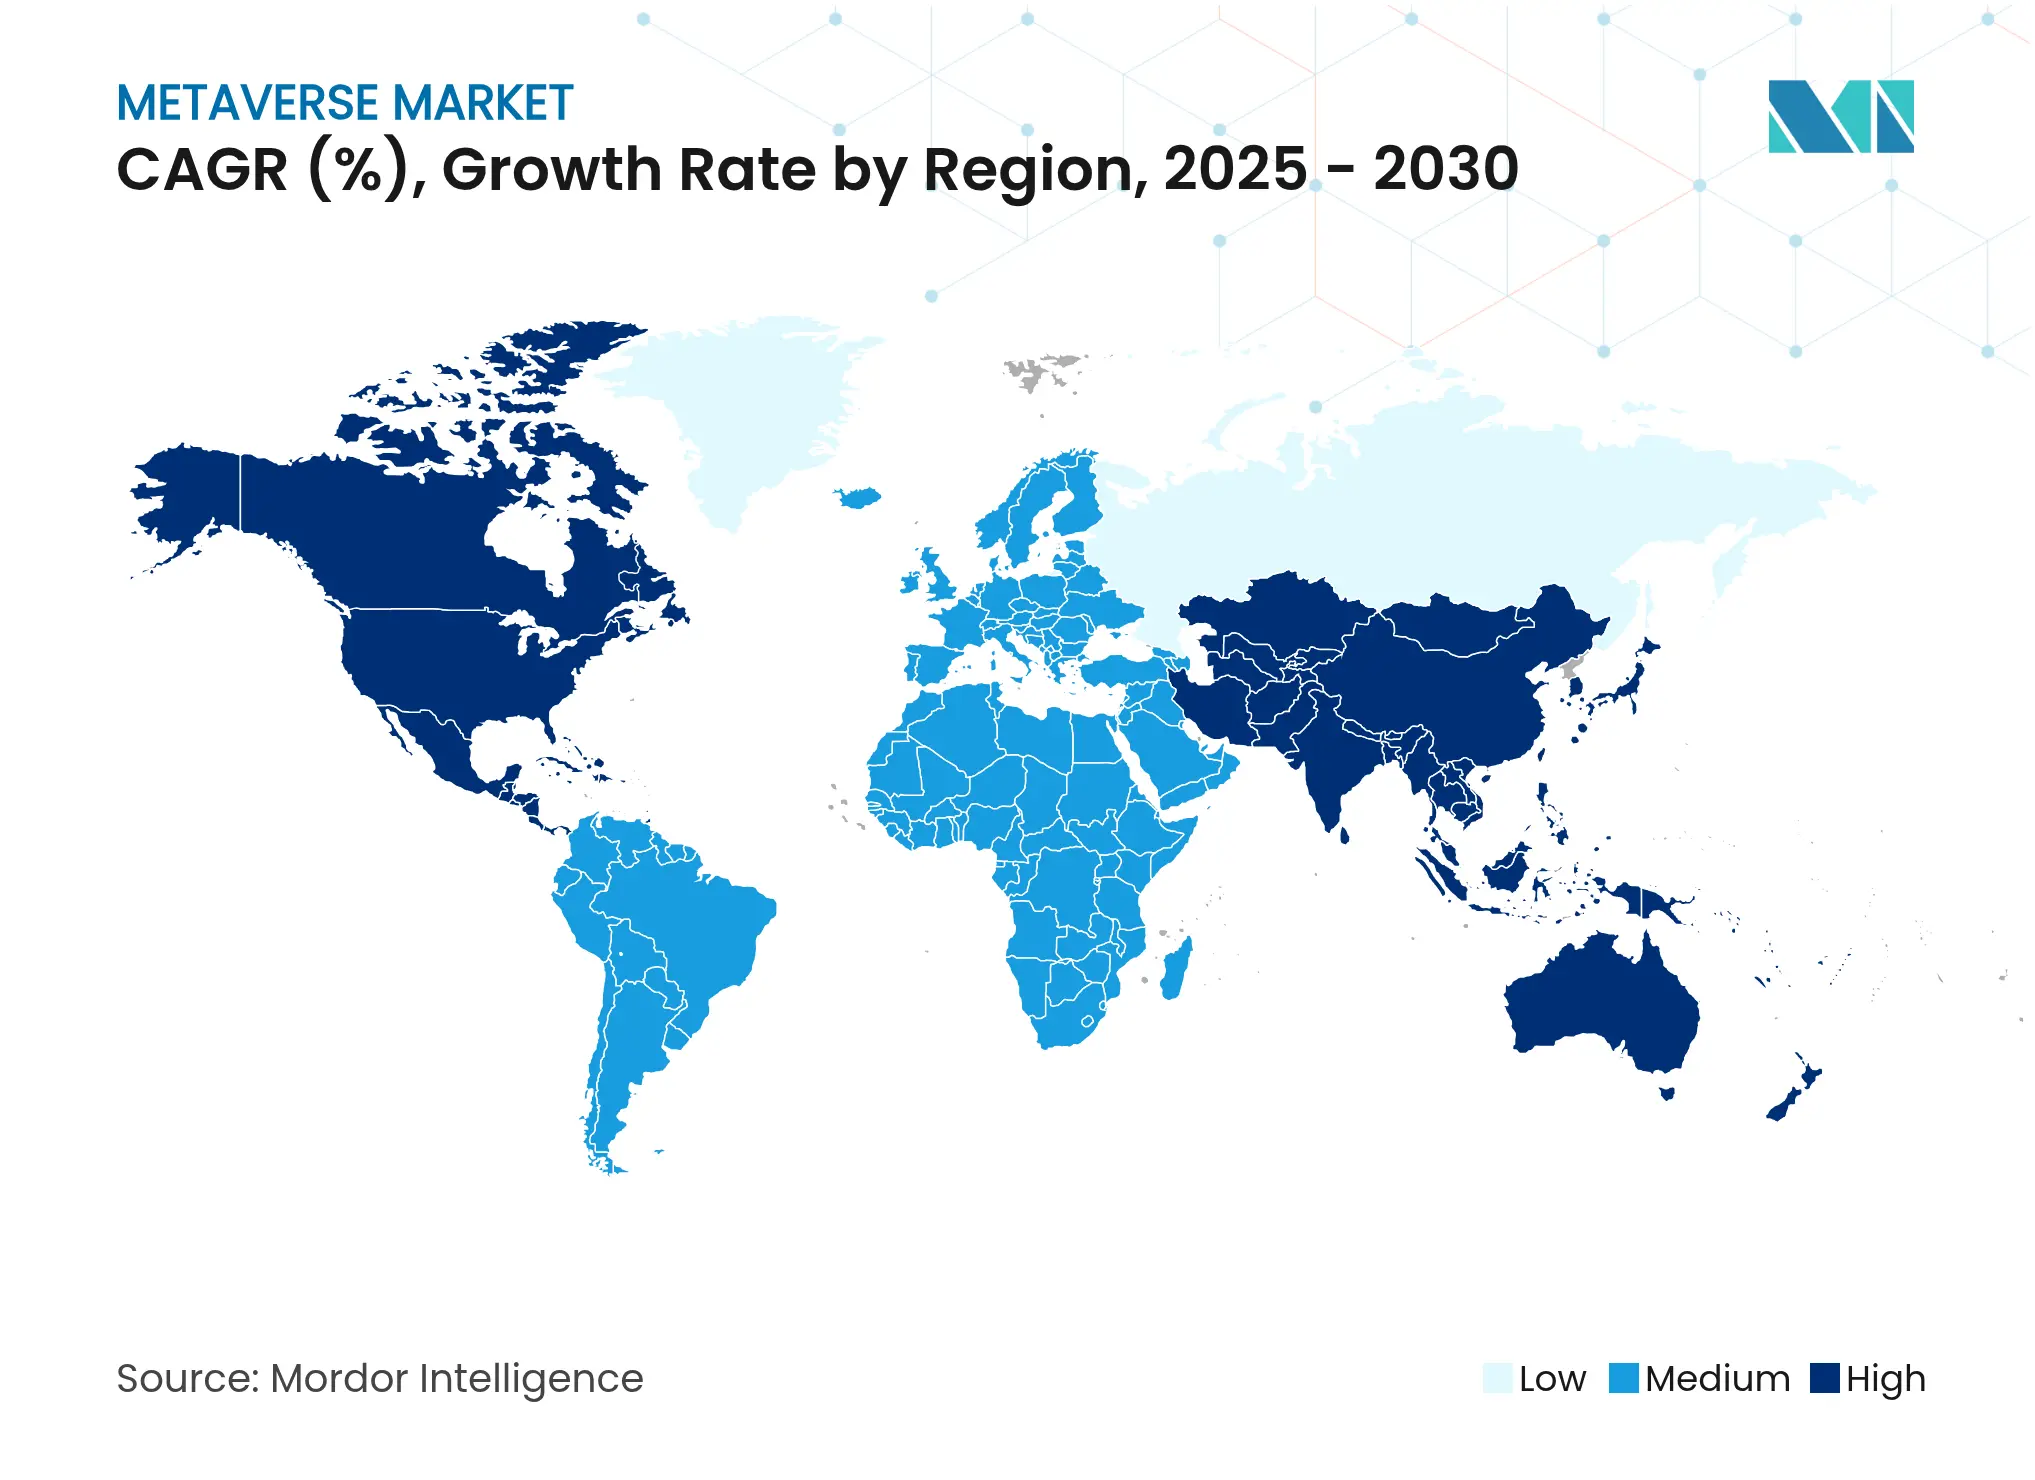
- By geography, North America retained 41% revenue share in 2024, yet Asia-Pacific is projected to grow at a 43% CAGR, the highest among all regions.
Note: Market size and forecast figures in this report are generated using Mordor Intelligence's proprietary estimation framework, updated with the latest available data and insights as of 2026.
Global Metaverse Market Trends and Insights
Drivers Impact Analysis
| Driver | (~) % Impact on CAGR Forecast | Geographic Relevance | Impact Timeline |
|---|---|---|---|
Convergence of gaming & social media platforms | 8.50% | Global, with APAC leadership in social commerce integration | Medium term (2-4 years) |
Advances in AR/VR hardware & networking | 7.20% | North America & EU leading R&D, APAC manufacturing scale | Long term (≥ 4 years) |
Heavy capex by Big Tech ecosystems | 6.80% | Global, concentrated in US tech giants and Chinese platforms | Short term (≤ 2 years) |
Generative-AI driven content cost collapse | 5.10% | Global, with early gains in content creation hubs | Short term (≤ 2 years) |
5G/6G network-slicing enabling B2B metaverse | 4.30% | APAC core, spill-over to North America and EU | Medium term (2-4 years) |
Enterprise digital transformation acceleration | 3.70% | Global, with North America and EU leading enterprise adoption | Medium term (2-4 years) |
| Source: Mordor Intelligence | |||
Convergence of Gaming & Social Media Platforms
Roblox’s integration of social commerce let developers earn USD 922.8 million in 2024, a 25% rise that accompanied 97.8 million daily active users in Q1 2025. Seamless in-experience purchasing removes friction between engagement and transaction, pushing longer session times and higher average revenue per user. WPP’s global pact with Roblox to define 3-D brand-engagement metrics shows advertisers shifting budget toward immersive placements. Retailers are following: Walmart’s link-up with Unity allows physical goods to be bought inside virtual worlds, turning gameplay into a direct sales channel. The momentum demonstrates how a gaming foundation speeds user acquisition for social-commerce extensions. As these ecosystems mature, incremental ad spend migrates from flat-screen social feeds to interactive worlds, lifting the overall metaverse market. [1]
Advances in AR/VR Hardware & Networking
Apple’s Vision Pro carries a USD 3,500 list price yet its bill of materials is USD 1,542, largely driven by micro-OLED screens and custom silicon that compress size and weight. Meta responded with the USD 299 Quest 3S, lowering the consumer entry cost by 40% compared with its predecessor. In industrial settings Siemens and Sony unveiled a USD 4,750 headset optimized for prolonged design reviews, underscoring enterprises’ willingness to pay premium for productivity gains. On the network side, Ericsson forecasts 6G commercial rollout by 2030, requiring about 3 GHz of contiguous spectrum for wide-area coverage, a leap that will render cloud-rendered immersive scenes nearly lag-free. These combined hardware and network advances shrink barriers to adoption, reinforcing the positive CAGR impulse. [2]
Heavy Capex by Big Tech Ecosystems
Microsoft plans roughly USD 80 billion in 2025 capital outlays to scale Azure, whose AI services grew 33% year-over-year. Meta spent USD 14.3 billion for 49% of Scale AI to secure core large-language-model talent for immersive content automation. Disney placed USD 1.5 billion into Epic Games to weave Marvel and Star Wars IP across Fortnite’s persistent universe. OpenAI’s Stargate data-center campus will house 400,000 NVIDIA GPUs drawing 1.2 GW of power, epitomizing the scale of compute required for photoreal worlds. Such outsized spending accelerates platform capabilities and fuels third-party developer ecosystems, raising the ceiling for the metaverse market.
5G/6G Network-Slicing Enabling B2B Metaverse
Enterprise 5G revenues are set to lift the telecom sector from USD 3 trillion in 2024 to USD 4 trillion by 2028 as firms adopt AR/VR for shop-floor collaboration. The 5G IoT sub-segment scales from USD 13 billion in 2023 to USD 60 billion by 2028, wiring factories for real-time digital twins. IOWN Global Forum, backed by Microsoft, Google and Intel, is piloting all-photonic networks that promise low-energy, terabit-speed backbones aligned with 6G roadmaps. Renault already connects 15,000 devices and saves EUR 700 million through its plant-wide metaverse, proving tangible ROI. Dedicated network slices thus transform immersive collaboration from proof-of-concept to mission-critical workflow, fuelling premium connectivity revenue.
Restraints Impact Analysis
| Restraint | (~) % Impact on CAGR Forecast | Geographic Relevance | Impact Timeline |
|---|---|---|---|
Privacy, accessibility & regulatory constraints | -4.20% | EU leading regulation, global compliance spillover | Long term (≥ 4 years) |
High headset cost & motion sickness | -3.80% | Global, particularly impacting mass market adoption | Medium term (2-4 years) |
Interoperability challenges between platforms | -2.90% | Global, with fragmentation most acute in Web3 platforms | Long term (≥ 4 years) |
GPU datacenter carbon-footprint scrutiny | -2.10% | Global, with stricter enforcement in EU and California | Long term (≥ 4 years) |
| Source: Mordor Intelligence | |||
Privacy, Accessibility & Regulatory Constraints
The EU’s Digital Services Act augments GDPR by obliging platforms to curb harmful content and protect biometric data harvested by eye-tracking and gesture sensors. Roblox combines AI and 2,400 human moderators to police 380 million users, illustrating the steep compliance overhead. OECD guidance urges cross-border alignment on AI ethics, further raising governance complexity. Motion sickness and bulky form factors hinder prolonged use, especially where workforce safety standards are stringent. Together these factors temper consumer and enterprise rollouts, trimming the metaverse market’s upward slope.
High Headset Cost & Motion Sickness
Even after Meta’s USD 299 Quest 3S price move, an entry headset remains a discretionary outlay. Bulk purchase decisions in education and healthcare still hinge on ergonomic ratings and duty-cycle limitations. Apple’s premium Vision Pro targets professionals yet excludes cost-sensitive segments. Ergonomic advances are progressing, but until average session comfort surpasses two hours, mass adoption will lag the content and network readiness curve.
Segment Analysis
By Component: Hardware Drives Initial Adoption
Hardware captured 35% of the metaverse market share in 2024 as head-mounted displays, sensors and controllers form the user entry point. Segment revenue will soften to single-digit share by 2030 as services outpace unit growth but remains a vital on-ramp for new users. Services & consulting, growing at a 48% CAGR, reflects enterprise need for integration, change management and cybersecurity support. The metaverse market size allocated to this advisory layer is projected to overtake hardware spending by 2028.
Price compression is accelerating. Meta’s USD 299 Quest 3S and China-based ODM volume production cut average headset pricing by 22% in 2024 alone. Conversely, industrial buyers embrace premium devices such as Siemens-Sony’s USD 4,750 HMD, paying for durable optics and all-day comfort. This barbell pricing fuels divergent margin profiles across consumer and enterprise channels. Software platforms, meanwhile, deliver recurring license revenue that cushions hardware volatility, underscoring a strategic pivot from capital goods toward subscription economics. [3]
Note: Segment shares of all individual segments available upon report purchase
By Platform Type: Centralized Dominance Faces Decentralized Challenge
Centralized ecosystems held 46% of the metaverse market in 2024, benefitting from seamless hardware-software optimization and curated content safeguards. Reality Labs and Apple Vision stacks exemplify closed-loop control that reduces latency and simplifies payment flows. Industrial digital-twin platforms, however, will expand at a 45% CAGR as manufacturers digitize plants to trim downtime and inventory.
Open decentralized networks lag in user adoption due to wallet UX friction and high gas fees, yet they gain traction in creator economies where true asset ownership is prized. NVIDIA’s Omniverse positions itself as a quasi-open hub, interfacing with USD and Pixar’s open-source standards while selling premium compute and AI services. The coming decade will likely see hybrid architectures where permissioned blockchains interoperate with managed cloud back-ends, balancing interoperability with performance.
By Revenue Model: Advertising Leads Monetization Evolution
Advertising supplied 38% of the metaverse market size in 2024 as brands shift budget from social feeds to immersive placements. In-world billboards, branded mini-games and event sponsorships deliver higher dwell times than static banners. Yet virtual goods & NFTs, forecast to grow 47% CAGR, illustrate the rise of direct micro-transactions.
Roblox paid out USD 922.8 million to creators in 2024, with over 750 developers earning six-figure incomes, proving virtual asset income sustainability. Enterprise SaaS subscriptions also rise as digital-twin vendors bundle analytics and remote-assist features. This income diversity de-risks platform P&Ls compared with ad-only models. [4]
Note: Segment shares of all individual segments available upon report purchase
By End-User Industry: Gaming Foundation Enables Enterprise Expansion
Gaming & esports supplied the user funnel and delivered 42% of 2024 revenue, yet corporate/industrial deployments will grow fastest at 44% CAGR. Digital twins cut factory defect rates and training simulations shorten onboarding cycles, delivering clear ROI that accelerates budget approvals.
Media & live entertainment exploits the metaverse for fan engagement, highlighted by Disney’s stake in Epic Games to generate persistent Marvel and Star Wars experiences. Retail & e-commerce hybridize storefronts with virtual try-ons, while education pilots VR labs that remove hazardous real-world variables. These adjacent verticals compound demand, reinforcing the metaverse market’s expansion path.
Geography Analysis
North America controlled 41% of 2024 revenue, thanks to hyperscale cloud density and venture capital depth. Microsoft’s Azure build-out and Meta’s Reality Labs anchor a supplier ecosystem ranging from optics to AI middleware. Regulatory concern over energy use, though, could temper future datacenter approvals, nudging firms toward energy-efficient designs.
Asia-Pacific is on track for a 43% CAGR through 2030, underpinned by a USD 880 billion mobile economy and 1.8 billion mobile internet users. The region leapfrogged desktop to mobile payments and social video, providing a template for rapid metaverse uptake. China’s hardware manufacturing scale cuts BOM costs, while Japan and South Korea’s esports cultures supply early adopter communities. Advanced 5G rollouts with network slicing enable factory-floor AR maintenance, crucial for industrial adoption.
Europe balances innovation with stringent privacy laws. The European Parliament’s 2024 guidance applies existing offline illegality within virtual worlds, obliging platforms to install real-time content filters. Compliance adds time-to-market friction yet builds consumer trust, potentially turning into a differentiation asset. Emerging regions in South America and Middle East & Africa may skip legacy PC phases altogether by implementing cloud-rendered XR streamed to low-cost devices once local 5G coverage matures.

Competitive Landscape
Market Concentration
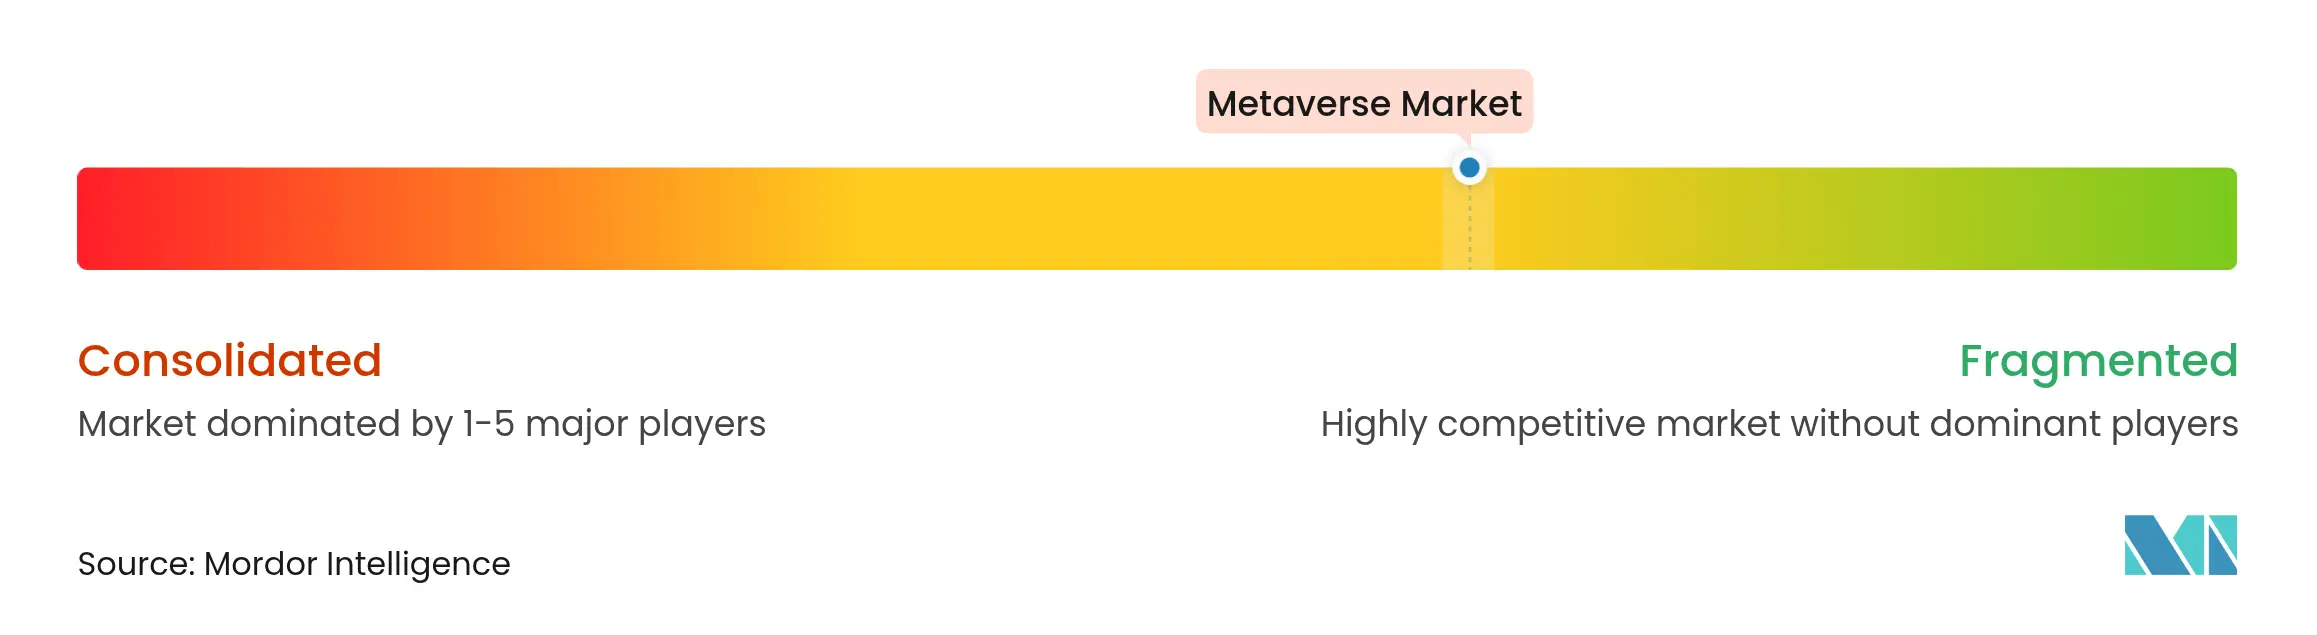
The metaverse market is fragmented, with no single vendor holding double-digit holistic share across hardware, software and services. Meta’s Reality Labs posted a cumulative USD 58 billion loss since 2020 on USD 270 million Q3 2024 revenue, underscoring heavy upfront capex. Roblox represents a profitable creator-focused model, pulling USD 1.04 billion in Q1 2025 revenue on 29% year-over-year growth.
Apple invests an estimated USD 33 billion to secure a premium stack, filing more than 20,000 patents that lock users into its closed ecosystem. NVIDIA advances an infrastructure-first play, embedding Omniverse into enterprise CAD pipelines through alliances with Accenture and Siemens. Acquisition activity remains brisk: CoStar took over Matterport for USD 1.6 billion to blend digital twins with real-estate listings, showing vertical specialists can command strategic premiums.
Start-ups focus on niche pain points—medical-device training, avatar middleware, spatial-audio meshes—capitalizing on gaps left by platform giants fixated on scale. These dynamics indicate a maturing yet unconsolidated field where partnership networks and open standards will shape competitive moats more than raw device shipments.
Metaverse Industry Leaders

*Disclaimer: Major Players sorted in no particular order
Recent Industry Developments
- June 2025: Meta Platforms invested USD 14.3 billion in Scale AI for a 49% stake to establish a Superintelligence lab focused on AGI.
- May 2025: Microsoft posted USD 70.1 billion Q3 2025 revenue and outlined USD 80 billion capex plans to expand cloud and AI capacity.
- March 2025: OpenAI revealed Stargate, a Texas data-center complex designed for 400,000 NVIDIA GPUs drawing 1.2 GW.
- February 2025: LVMH partnered with Epic Games to deploy Unreal Engine for virtual fitting rooms and AR runway shows.
Table of Contents for Metaverse Industry Report
1. INTRODUCTION
- 1.1 Study Assumptions and Market Definition
- 1.2 Scope of the Study
2. RESEARCH METHODOLOGY
3. EXECUTIVE SUMMARY
4. MARKET LANDSCAPE
- 4.1 Market Overview
- 4.2 Market Drivers
- 4.2.1 Convergence of gaming and social media platforms
- 4.2.2 Advances in AR/VR hardware and networking
- 4.2.3 Heavy capex by Big Tech ecosystems
- 4.2.4 5G/6G network-slicing enabling B2B metaverse (under-the-radar)
- 4.2.5 Generative-AI driven content cost collapse (under-the-radar)
- 4.3 Market Restraints
- 4.3.1 Privacy, accessibility and regulatory constraints
- 4.3.2 High headset cost and motion sickness
- 4.3.3 GPU datacenter carbon-footprint scrutiny (under-the-radar)
- 4.4 Value / Supply-Chain Analysis
- 4.5 Regulatory Landscape
- 4.6 Technological Outlook
- 4.7 Porter's Five Forces Analysis
- 4.7.1 Bargaining Power of Suppliers
- 4.7.2 Bargaining Power of Buyers
- 4.7.3 Threat of New Entrants
- 4.7.4 Threat of Substitutes
- 4.7.5 Competitive Rivalry
5. MARKET SIZE AND GROWTH FORECASTS (VALUE)
- 5.1 By Component
- 5.1.1 Hardware (HMDs, sensors)
- 5.1.2 Software Platforms
- 5.1.3 Services and Consulting
- 5.2 By Platform Type
- 5.2.1 Centralised closed platforms
- 5.2.2 Open decentralised platforms (Web3)
- 5.2.3 Industrial / Digital-Twin platforms
- 5.3 By Revenue Model
- 5.3.1 Direct Consumer Spend
- 5.3.2 Advertising
- 5.3.3 Virtual Goods and NFTs
- 5.3.4 Enterprise SaaS / Subscription
- 5.4 By End-User Industry
- 5.4.1 Gaming and Esports
- 5.4.2 Media and Live Entertainment
- 5.4.3 Retail and E-commerce
- 5.4.4 Corporate/Industrial and Digital Twin
- 5.4.5 Education and Training
- 5.5 By Geography
- 5.5.1 North America
- 5.5.1.1 United States
- 5.5.1.2 Canada
- 5.5.1.3 Mexico
- 5.5.2 South America
- 5.5.2.1 Brazil
- 5.5.2.2 Argentina
- 5.5.2.3 Chile
- 5.5.2.4 Rest of South America
- 5.5.3 Europe
- 5.5.3.1 Italy
- 5.5.3.2 France
- 5.5.3.3 United Kingdom
- 5.5.3.4 Rest of Europe
- 5.5.4 Asia-Pacific
- 5.5.4.1 India
- 5.5.4.2 China
- 5.5.4.3 Japan
- 5.5.4.4 Rest of Asia-Pacific
- 5.5.5 Middle East and Africa
- 5.5.5.1 South Africa
- 5.5.5.2 Saudi Arabia
- 5.5.5.3 United Arab Emirates
- 5.5.5.4 Qatar
- 5.5.5.5 Turkey
- 5.5.5.6 Rest of Middle East and Africa
6. COMPETITIVE LANDSCAPE
- 6.1 Market Concentration
- 6.2 Strategic Moves
- 6.3 Market Share Analysis
- 6.4 Company Profiles (includes Global level Overview, Market level overview, Core Segments, Financials as available, Strategic Information, Market Rank/Share for key companies, Products and Services, and Recent Developments)
- 6.4.1 Meta Platforms, Inc.
- 6.4.2 Microsoft Corporation
- 6.4.3 Apple Inc.
- 6.4.4 NVIDIA Corporation
- 6.4.5 Amazon Web Services, Inc.
- 6.4.6 Alphabet Inc. (Google Cloud)
- 6.4.7 Roblox Corporation
- 6.4.8 Epic Games, Inc.
- 6.4.9 Electronic Arts Inc.
- 6.4.10 HOLOGATE GmbH
- 6.4.11 Cloudflare, Inc.
- 6.4.12 QUALCOMM Incorporated
- 6.4.13 Unity Software Inc.
- 6.4.14 Valve Corporation
- 6.4.15 HTC Corporation
- 6.4.16 Sony Group Corporation
- 6.4.17 Samsung Electronics Co., Ltd.
- 6.4.18 ByteDance Ltd. (Pico)
- 6.4.19 Autodesk, Inc.
- 6.4.20 Vuzix Corporation
7. MARKET OPPORTUNITIES AND FUTURE OUTLOOK
- 7.1 White-space and Unmet-need Assessment
Global Metaverse Market Report Scope
The term "metaverse" refers to a highly immersive 3D virtual world experience obtained using a combination of AR, VR, and MR technologies. By creating a virtual world where users can play immersive games, conduct business, interact socially, buy and sell virtual properties, and enjoy immersive entertainment, the metaverse platform enhances the overall internet experience.
The metaverse market is segmented by type (AR & VR hardware, social media engagement (Ads), virtual live entertainment - epic, games and roblox, gaming services), by end-user industry (gaming, media & entertainment, commercial, retail), and geography (North America, Europe, Asia Pacific, Rest of the World).
The market sizes and forecasts are provided in terms of value (USD) for all the above segments.
| By Component | Hardware (HMDs, sensors) | |
| Software Platforms | ||
| Services and Consulting | ||
| By Platform Type | Centralised closed platforms | |
| Open decentralised platforms (Web3) | ||
| Industrial / Digital-Twin platforms | ||
| By Revenue Model | Direct Consumer Spend | |
| Advertising | ||
| Virtual Goods and NFTs | ||
| Enterprise SaaS / Subscription | ||
| By End-User Industry | Gaming and Esports | |
| Media and Live Entertainment | ||
| Retail and E-commerce | ||
| Corporate/Industrial and Digital Twin | ||
| Education and Training | ||
| By Geography | North America | United States |
| Canada | ||
| Mexico | ||
| South America | Brazil | |
| Argentina | ||
| Chile | ||
| Rest of South America | ||
| Europe | Italy | |
| France | ||
| United Kingdom | ||
| Rest of Europe | ||
| Asia-Pacific | India | |
| China | ||
| Japan | ||
| Rest of Asia-Pacific | ||
| Middle East and Africa | South Africa | |
| Saudi Arabia | ||
| United Arab Emirates | ||
| Qatar | ||
| Turkey | ||
| Rest of Middle East and Africa | ||
