
Marketing Budget Optimization Services Market Size and Share
Market Overview
| Study Period | 2020 - 2031 |
|---|---|
| Market Size (2026) | USD 4.85 Billion |
| Market Size (2031) | USD 8.99 Billion |
| Growth Rate (2026 - 2031) | 13.14 % |
| Fastest Growing Market | Asia-Pacific |
| Largest Market | North America |
| Market Concentration | Medium |
Major Players *Disclaimer: Major Players sorted in no particular order Image © Mordor Intelligence. Reuse requires attribution under CC BY 4.0. | |
Marketing Budget Optimization Services Market Analysis by Mordor Intelligence
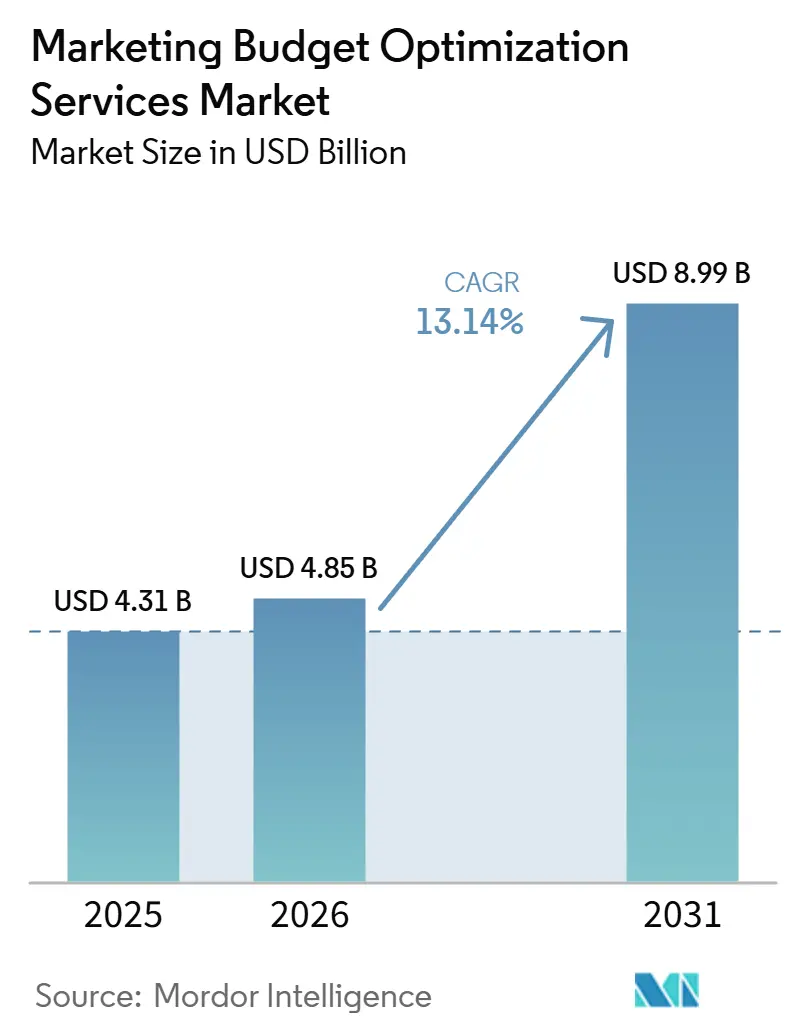
The Marketing Budget Optimization Services Market size was valued at USD 4.31 billion in 2025 and estimated to grow from USD 4.85 billion in 2026 to reach USD 8.99 billion by 2031, at a CAGR of 13.14% during the forecast period 2026-2031. The Marketing Budget Optimization Services Market is benefiting from a stronger requirement to connect marketing spending with pipeline, revenue, and margin outcomes. Marketing leaders are facing closer review from finance teams, which has increased demand for measurement programs that support budget decisions rather than just reporting. Privacy changes, retail media growth, and wider use of generative AI are increasing the need for methods that work across channels without relying on individual tracking. The Marketing Budget Optimization Services Market also has room to expand as organizations move from periodic analysis toward ongoing budget planning and testing. Providers that combine credible methods with clear financial reporting are better placed to retain clients and extend service scopes.
Key Report Takeaways
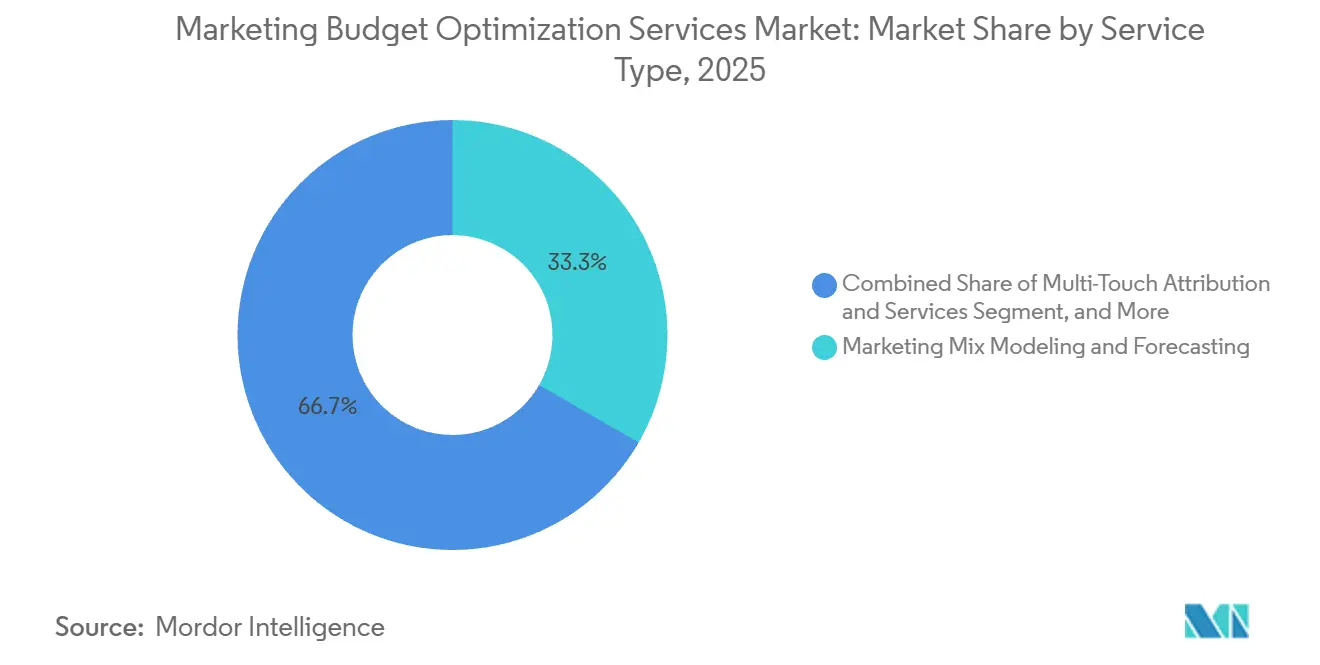
- By service type, Marketing Mix Modeling and Forecasting held 33.34% of Marketing Budget Optimization Services Market revenue in 2025, while Multi-Touch Attribution and Incrementality Services are projected to expand at a 15.17% CAGR through 2031.
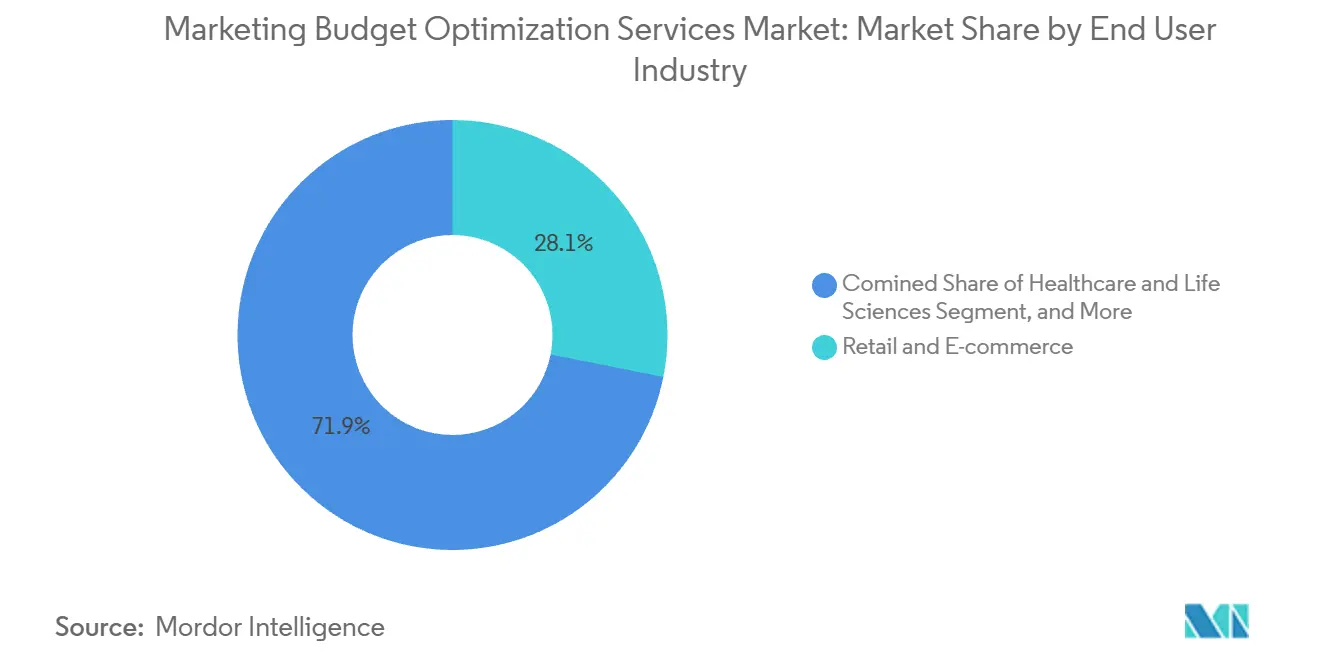
- By end user industry, Retail and E-commerce held 28.12% of revenue in 2025, while Healthcare and Life Sciences are projected to record the highest CAGR of 16.12% through 2031.
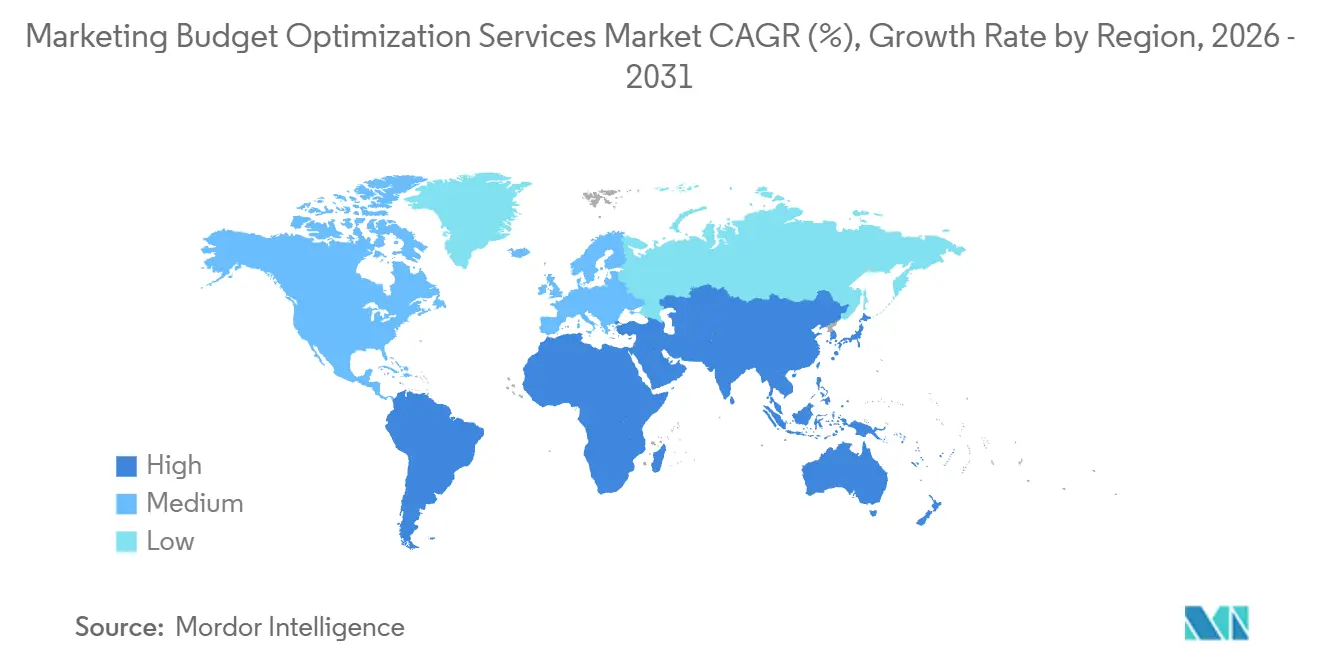
- By geography, North America held 45.68% of the Marketing Budget Optimization Services Market in 2025, while Asia-Pacific is projected to expand at a 15.66% CAGR through 2031.
Note: Market size and forecast figures in this report are generated using Mordor Intelligence’s proprietary estimation framework, updated with the latest available data and insights as of January 2026.
Market Trends and Insights
Drivers Impact Analysis of Marketing Budget Optimization Services Market*
| Driver | (~) % Impact on CAGR Forecast | Geographic Relevance | Impact Timeline |
|---|---|---|---|
| Rising Demand for Measurable Marketing ROI | +3.5% | Global | Short term (≤ 2 years) |
| Cookie Decommissioning and Privacy-Led Measurement Shifts | +2.8% | Global, particularly Europe and North America | Medium term (2-4 years) |
| Growth of Cross-Channel and Retail Media Spend | +2.1% | North America and Asia-Pacific | Short term (≤ 2 years) |
| Greater CFO Scrutiny on Budget Efficiency | +1.8% | Global | Short term (≤ 2 years) |
| AI-Enabled Scenario Planning and Optimization | +1.5% | North America and Asia-Pacific core, with spillover to Europe | Medium term (2-4 years) |
| Expansion of Managed Analytics and Consulting Demand | +1.0% | Global, with emerging gains in Middle East and Africa | Long term (≥ 4 years) |
| Source: Mordor Intelligence | |||
Rising Demand for Measurable Marketing ROI
Marketing return on investment has moved from an occasional board-level request to a continuing operating requirement. The Marketing Budget Optimization Services Market is responding because companies need a clear link between spending, commercial results, and the period required to recover an investment. Analytic Partners reported in June 2026 that 22% of 455 senior decision-makers at enterprise advertisers had reached the point where analytics guided budget reallocation.[1] The remaining organizations may need broader data, modeling, and advisory support before they can use measurement in routine budget decisions. That gap supports a longer service cycle as firms move from basic reports to recurring planning support. It also raises the value of providers that can connect marketing evidence with the financial measures used in budget reviews.
Cookie Decommissioning and Privacy-Led Measurement Shifts
The reduced availability of user-level tracking has increased the value of aggregate measurement methods. Privacy rules and browser controls have made cookie-dependent attribution less dependable across many campaigns. Marketing mix modeling and incrementality testing do not require individual-level tracking, making them useful when user-level signals are incomplete. The IAB and IAB Europe issued guidelines for incremental measurement in commerce media in November 2025, giving buyers a common framework for evaluating causal measurement practices.[2] The Marketing Budget Optimization Services Market benefits when companies need privacy-aware methods for comparing retail media, digital media, and offline activity. Providers must still explain their methods clearly because buyers need confidence that model outputs can be reviewed and applied.
Growth of Cross-Channel and Retail Media Spend
Retail media has increased the number of channels that marketers must measure and compare. Brands can reach the same customers through retailer platforms, social media, connected television, search, and other media quickly. This overlap makes it harder to judge whether a channel created new demand or simply reached an existing buyer. Retail media spending also increases the cost of using incomplete or inconsistent measurement practices. The Marketing Budget Optimization Services Market, therefore, favors providers that can measure interactions between retail and non-retail channels instead of assessing each channel in isolation. Scenario tools also help brands test allocations before committing funds across a more complex media mix.
Greater CFO Scrutiny on Budget Efficiency
Finance teams increasingly expect marketing plans to show the commercial value of proposed spending. This expectation affects the Marketing Budget Optimization Services Market because reports alone are less useful when finance leaders need audit trails, payback analysis, and alternative budget cases. Service providers can address this need by linking forecasts to financial planning and documenting how they arrived at their recommendations. That approach makes it easier for marketing and finance teams to review the same evidence. Clear documentation can reduce disagreement around assumptions, data inputs, and the practical limits of a model. It also supports renewal opportunities during annual planning and in-period budget reviews.
Restraints Impact Analysis of Marketing Budget Optimization Services Market*
| Restraint | (~) % Impact on CAGR Forecast | Geographic Relevance | Impact Timeline |
|---|---|---|---|
| Data Silos and Low Measurement Readiness | -2.8% | Global, pronounced in South America, Middle East, and Africa | Long term (≥ 4 years) |
| Limited Internal Analytics Talent | -2.2% | Global | Medium term (2-4 years) |
| Integration Complexity Across MarTech and AdTech Stacks | -1.5% | North America and Europe | Medium term (2-4 years) |
| Model Governance, Privacy, and Trust Concerns | -0.8% | Europe and North America | Long term (≥ 4 years) |
| Source: Mordor Intelligence | |||
Data Silos and Low Measurement Readiness
Data readiness remains a central barrier for companies that want to use advanced measurement services. Marketing mix models require consistent data on media, sales, pricing, promotions, and other business factors. Google reported in 2026 that 75% of retail leaders made strategic decisions using inconsistent, outdated, or incomplete data.[3] Fragmented transaction records, inconsistent media tags, and missing offline-spend data can reduce confidence in model outputs. The Marketing Budget Optimization Services Market gains work from data preparation, but this work can delay when a client sees value. The issue is particularly relevant in South America, the Middle East, and Africa, where data infrastructure can delay adoption even when interest is present.
Limited Internal Analytics Talent
Organizations need people who can work with causal measurement, data preparation, model governance, and senior management communication. That combination of skills is difficult to build internally, especially when teams are also expected to manage active campaigns. The shortage supports demand for managed analytics and advisory work in the Marketing Budget Optimization Services Market. It can also slow implementation when clients lack staff to prepare data, review recommendations, and apply changes. Analytic Partners has developed the NorthStar Academy as part of its effort to build relevant expertise. Providers that reduce the workload through training, repeatable processes, and AI-supported model upkeep may be able to serve clients more consistently.[4]
*Our forecasts treat driver/restraint impacts as directional, not additive. The impact forecasts reflect baseline growth, mix effects, and variable interactions.
Marketing Budget Optimization Services Market Segment Analysis
By Service Type:
Econometric Modeling Supports Budget ReallocationMarketing Mix Modeling and Forecasting accounted for 33.34% of service revenue in 2025, giving it the largest share of the Marketing Budget Optimization Services Market among service types. Its position reflects its ability to evaluate broad media activity while remaining useful when individual tracking data is limited. Large advertisers use the approach to assess the combined effects of paid media, owned channels, offline activity, pricing, promotions, and wider business conditions. The method supports budget allocation because it provides a view of how channels work together rather than treating each customer interaction as independent. Multi-Touch Attribution and Incrementality Services are projected to grow at a 15.17% CAGR from 2026 to 2031, the highest rate among service types.
This growth reflects demand for evidence that a campaign created additional outcomes rather than receiving credit for sales that would have occurred anyway. Media Mix Optimization Services operate more closely with active campaign management and adjust channel weights based on saturation patterns and diminishing returns. Scenario Planning and Budget Simulation Services help finance and marketing teams test different investment plans before annual allocations are approved. Managed Analytics and Advisory Services support companies that lack the internal capacity to run models, govern results, and translate findings for decision-makers. The Marketing Budget Optimization Services Industry is moving from one-time measurement work toward continuing planning support, which can increase contract scope across data preparation, modeling, and decision support.

By End User Industry:
Healthcare Adoption Rises With Measurement ComplexityRetail and E-commerce accounted for 28.12% of revenue in 2025, representing the largest end-user segment in the Marketing Budget Optimization Services Market. Retailers and e-commerce businesses have a structural advantage in measurement because retail media can be compared with first-party purchase records. This allows teams to assess campaigns against sales data rather than relying only on reach, clicks, or other intermediate signals. Retail media networks also provide a clear framework for incrementality testing, as marketers can compare exposed and unexposed groups. The segment requires providers to assess retailer media alongside search, social, display, and other acquisition channels.
Healthcare and Life Sciences are projected to grow at a 16.12% CAGR from 2026 to 2031, the fastest rate among end-user groups. Pharmaceutical companies and health systems are applying measurement practices previously more common in consumer goods, and specialized data, regulations, and longer decision paths make their work more demanding. In March 2026, IQVIA stated that 19 of the top 20 pharmaceutical companies used its AI agents in commercial workflows. Media and Entertainment, Travel and Hospitality, and Consumer Goods use the services for promotional analysis, seasonal planning, and retailer-level assessment, while banking, financial services, insurance, education, automotive, and IT and telecom remain important areas for managed analytics. The Marketing Budget Optimization Services Market can support these varied needs through data preparation, model governance, and decision support that reflects each sector's operating constraints.
Geography Analysis
North America Marketing Budget Optimization Services Market
North America held 45.68% of the global Marketing Budget Optimization Services Market share in 2025. The region has a large concentration of enterprise advertisers, specialist analytics firms, and established marketing technology providers. Its privacy environment has driven increased interest in methods that do not rely on cookies or other individual tracking signals. The region is also a leading location for geo-holdout testing, AI-supported analytics tools, and finance-oriented reporting. Measured has published guidance for finance leaders reviewing marketing measurement, reflecting the importance of aligning marketing evidence with budget oversight.
APAC Marketing Budget Optimization Services Market
Asia-Pacific is projected to expand at a 15.66% CAGR from 2026 to 2031, making it the fastest-growing geographic area. The Marketing Budget Optimization Services Market size in the region is supported by a growing digital advertising base and stronger demands for spending accountability. Marketing teams often need to improve results within constrained budgets, while boards expect performance comparable to that of more mature regions. Investment in measurement infrastructure is therefore relevant to both immediate efficiency and longer-term commercial planning. Demand is also supported by business-to-consumer companies that are increasing their use of digital advertising and generative AI tools.
EMEA and South America Marketing Budget Optimization Services Market
Europe is the second-largest revenue geography, with Germany, the United Kingdom, and France leading adoption. General Data Protection Regulation requirements have strengthened the case for aggregate and probabilistic measurement methods. Bitkom reported in February 2026 that German marketing budgets averaged 4.1% of revenue, increasing attention on efficiency and automation. South America is earlier in its adoption cycle, while the Middle East and Africa remain constrained by data infrastructure and talent gaps.
Competitive Landscape
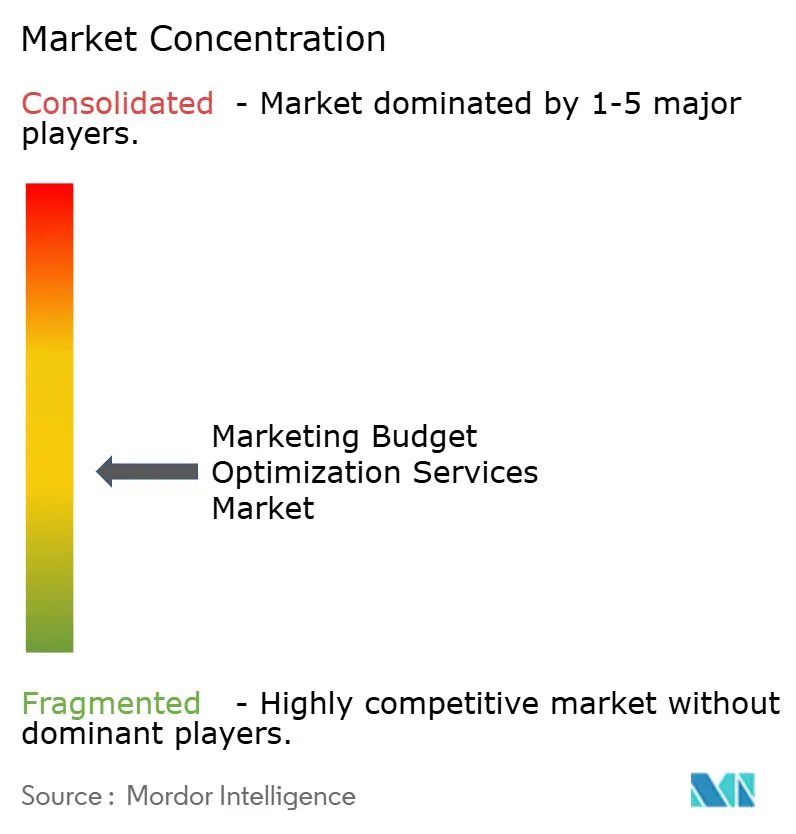
The Marketing Budget Optimization Services Market is moderately fragmented. Several specialist vendors hold strong positions in the enterprise market, while mid-market platforms and boutique consultancies compete on price and deployment speed. Leading providers combine marketing mix modeling, managed analytics, and incrementality testing under a single contract. This can make it difficult for clients to source each service separately because methods, data flows, and reporting are closely linked. Analytic Partners completed the acquisition of Analyx in January 2025, extending its presence in Germany and Poland after its 2024 acquisition of Magic Numbers in the United Kingdom.
The Marketing Budget Optimization Services Market is also attracting AI-native platforms that emphasize quicker deployment and more accessible self-service tools. These providers challenge established specialists by offering measurement and experiment capabilities at lower price points. The IAB and IAB Europe guidance on incremental commerce media measurement raises expectations for clear methodology and documentation. This favors providers that can show how their results were generated and how the findings should be used in budgeting. Companies that combine rapid analysis with defensible governance are more likely to meet enterprise requirements.
Healthcare and pharmaceutical work offers an opening because specialized data and regulatory obligations can raise switching costs. Small and midsize advertisers also present an opportunity when they are priced out of enterprise-managed services. Real-time budget reallocation remains an opportunity, as many providers refresh their models weekly or monthly. The Marketing Budget Optimization Services Industry will reward suppliers that make scenario planning easier without reducing methodological discipline.
Marketing Budget Optimization Services Industry Leaders
-
Analytic Partners, Inc.
-
Ipsos MMA
-
Ekimetrics SAS
-
WPP plc
-
Kantar Group Limited
- *Disclaimer: Major Players sorted in no particular order
Marketing Budget Optimization Services Market Companies Covered in this Report
- Analytic Partners, Inc.
- Ekimetrics SAS
- Ipsos MMA
- WPP plc
- Kantar Group Limited
- Keen Decision Systems, Inc.
- Recast, Inc.
- Uptempo, Inc.
- IQVIA Holdings Inc.
- Circana, LLC
- TransUnion LLC
- Marketing Evolution, LLC
- ScanmarQED AB
- OptiMine Software, Inc.
- HCL Technologies Limited
- Publicis Groupe S.A.
- Deloitte Touche Tohmatsu Limited
- Northbeam, Inc.
- Haus, Inc.
- Sellforte Oy
Recent Industry Developments in Marketing Budget Optimization Services Market
- July 2026: Cint and WPP Media South America announced a strategic partnership to deploy brand impact measurement infrastructure across WPP's media solutions in Mexico, with expansion planned to Chile, the United States, Colombia, Brazil, and Argentina. The initiative standardized brand KPI structures across multi-market campaigns and integrated Cint's AI insights manager Luci for real-time optimization signals, marking a significant step in formalizing marketing measurement practices across South America.
- June 2026: Analytic Partners released findings from its 2026 State of Commercial Decisioning Survey, based on 455 verified senior decision-makers at enterprise advertisers with annual budgets of USD 100 million or more. The research identified that only 22% of enterprise advertisers qualified as “Empowered Organizations” that operationalized analytics into budget decisions, and that this minority generated materially higher ROI, establishing a commercial benchmark that underscored the scale of remaining market opportunity.
- March 2026: IQVIA unveiled IQVIA.ai, a unified agentic AI platform built with NVIDIA Nemotron and NeMo Agent Toolkit, targeting commercial analytics, clinical, and real-world decision-making in life sciences. The platform consolidated over 150 intelligent agents and was already incorporated into workflows by 19 of the top 20 pharmaceutical companies, accelerating AI-enabled marketing measurement adoption in healthcare.
- March 2026: Ekimetrics signed its first acquisition, buying Actable, a U.S.-based specialist in AI-powered customer analytics, as the cornerstone of its “Elevate” strategic plan targeting global leadership in managed data and AI solutions by 2028. The deal added predictive customer lifetime value, churn, and propensity-to-buy models to Ekimetrics' existing marketing mix optimization stack, deepening its North America presence.
Global Marketing Budget Optimization Services Market Report Scope
The marketing budget optimization services market refers to analytical and advisory services that help organizations strategically allocate marketing expenditures to maximize ROI. This includes marketing mix modeling (MMM), media mix optimization, multi-touch attribution, and scenario planning. By leveraging advanced analytics, these services provide a cross-channel view of the true financial impact across industries such as retail, media, and healthcare. As privacy regulations and the deprecation of third-party cookies disrupt traditional tracking, these services are essential for making data-driven budget allocation decisions across both digital and traditional channels.
The Marketing Budget Optimization Services Market Report is Segmented by Service Type (Marketing Mix Modeling and Forecasting, Media Mix Optimization Services, Multi-Touch Attribution and Incrementality Services, Scenario Planning and Budget Simulation Services, and Managed Analytics and Advisory Services), End User Industry (Retail and E-commerce, Media and Entertainment, Healthcare and Life Sciences, Travel and Hospitality, Consumer Goods, and Other End User Industries (BFSI, Education, Automotive, and IT and Telecom amongst Others)), and Geography (North America, South America, Europe, Asia-Pacific, Middle East, and Africa). The Market Forecasts are Provided in Terms of Value (USD).
Segmentation Overview
| Marketing Mix Modeling and Forecasting |
| Media Mix Optimization Services |
| Multi-Touch Attribution and Incrementality Services |
| Scenario Planning and Budget Simulation Services |
| Managed Analytics and Advisory Services |
| Retail and E-commerce |
| Media and Entertainment |
| Healthcare and Life Sciences |
| Travel and Hospitality |
| Consumer Goods |
| Other End User Industries (BFSI, Education, Automotive, and IT and Telecom amongst Others) |
| North America | United States |
| Canada | |
| Mexico | |
| South America | Brazil |
| Argentina | |
| Chile | |
| Rest of South America | |
| Europe | Germany |
| United Kingdom | |
| France | |
| Italy | |
| Spain | |
| Rest of Europe | |
| Asia-Pacific | China |
| Japan | |
| India | |
| South Korea | |
| Australia | |
| Rest of Asia-Pacific | |
| Middle East | United Arab Emirates |
| Saudi Arabia | |
| Qatar | |
| Rest of Middle East | |
| Africa | South Africa |
| Egypt | |
| Nigeria | |
| Rest of Africa |
| By Service Type | Marketing Mix Modeling and Forecasting | |
| Media Mix Optimization Services | ||
| Multi-Touch Attribution and Incrementality Services | ||
| Scenario Planning and Budget Simulation Services | ||
| Managed Analytics and Advisory Services | ||
| By End User Industry | Retail and E-commerce | |
| Media and Entertainment | ||
| Healthcare and Life Sciences | ||
| Travel and Hospitality | ||
| Consumer Goods | ||
| Other End User Industries (BFSI, Education, Automotive, and IT and Telecom amongst Others) | ||
| By Geography | North America | United States |
| Canada | ||
| Mexico | ||
| South America | Brazil | |
| Argentina | ||
| Chile | ||
| Rest of South America | ||
| Europe | Germany | |
| United Kingdom | ||
| France | ||
| Italy | ||
| Spain | ||
| Rest of Europe | ||
| Asia-Pacific | China | |
| Japan | ||
| India | ||
| South Korea | ||
| Australia | ||
| Rest of Asia-Pacific | ||
| Middle East | United Arab Emirates | |
| Saudi Arabia | ||
| Qatar | ||
| Rest of Middle East | ||
| Africa | South Africa | |
| Egypt | ||
| Nigeria | ||
| Rest of Africa | ||
Key Questions Answered in the Report
What is the Marketing Budget Optimization Services Market size?
The Marketing Budget Optimization Services Market was valued at USD 4.31 billion in 2025 and is estimated at USD 4.85 billion in 2026. It is projected to reach USD 8.99 billion by 2031 at a CAGR of 13.14%.
What is driving demand for marketing budget optimization services?
Demand is supported by greater pressure to demonstrate marketing return on investment, privacy-led measurement changes, cross-channel media complexity, and closer finance oversight. These factors make evidence-based budget allocation more important for advertisers.
Which service type leads revenue?
Marketing Mix Modeling and Forecasting led service revenue with a 33.34% share in 2025. Multi-Touch Attribution and Incrementality Services are projected to be the fastest-growing service group through 2031, with a 15.17% CAGR.
Which end-user group is growing fastest?
Healthcare and Life Sciences is projected to grow at a 16.12% CAGR from 2026 to 2031. The segment needs specialized measurement because regulations, complex decision paths, and audience requirements can make attribution more difficult.
Which region is growing fastest?
Asia-Pacific is projected to record the fastest regional growth, with a 15.66% CAGR between 2026 and 2031. North America remained the largest regional contributor in 2025, with a 45.68% share.
Why is incrementality testing becoming more important?
Incrementality testing helps determine whether marketing activity produced additional sales or outcomes. It is useful when user-level tracking is less reliable and when marketing teams need stronger evidence before reallocating budget.