Hardware Encryption Market Size and Share
Market Overview
| Study Period | 2020 - 2031 |
|---|---|
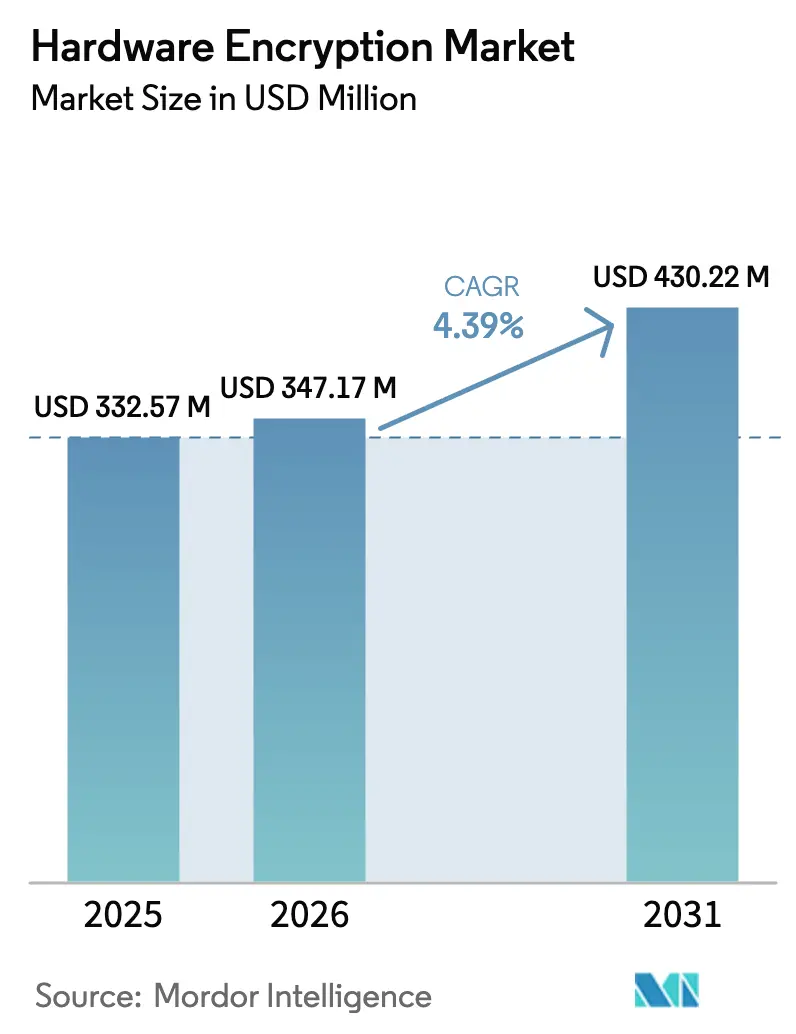
| Market Size (2026) | USD 347.17 Million |
| Market Size (2031) | USD 430.22 Million |
| Growth Rate (2026 - 2031) | 4.39% CAGR |
| Fastest Growing Market | Asia Pacific |
| Largest Market | North America |
| Market Concentration | Medium |
Major Players*Disclaimer: Major Players sorted in no particular order Image © Mordor Intelligence. Reuse requires attribution under CC BY 4.0. | |
Hardware Encryption Market Analysis by Mordor Intelligence
The hardware encryption market size was valued at USD 332.57 million in 2025 and estimated to grow from USD 347.17 million in 2026 to reach USD 430.22 million by 2031, at a CAGR of 4.39% during the forecast period (2026-2031). This growth occurs while the ecosystem shifts from legacy symmetric algorithms toward quantum-resistant approaches adopted in response to rising quantum-computing threats. Mandatory federal rules, a higher incidence of zero-trust frameworks, and enterprise risk-mitigation programs are the primary factors shaping demand. The fast rollout of solid-state drives in data-center refresh cycles, combined with edge-AI inferencing needs, accelerates the deployment of hardware-based cryptography in storage controllers. Post-quantum algorithm launches and automotive mandates for encrypted electronic architectures supply additional momentum. At the same time, premium pricing, supply-chain scarcity for advanced crypto-IP cores, and export-control constraints temper overall expansion.
Key Report Takeaways
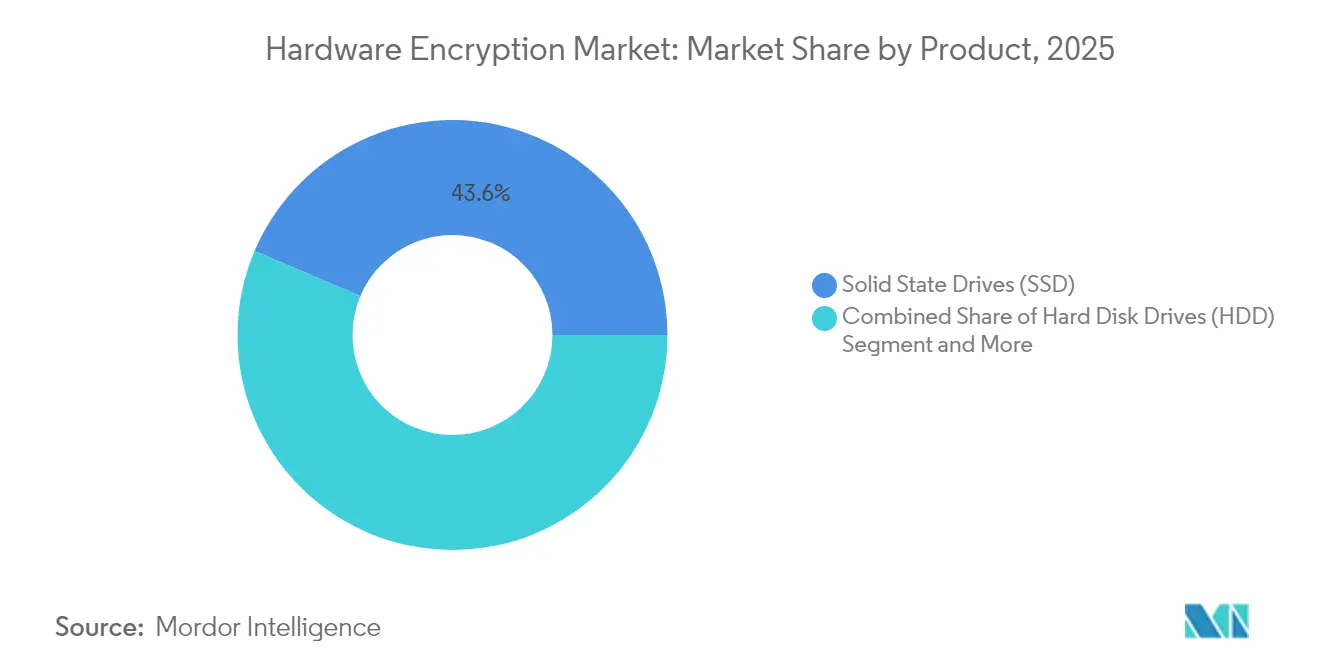
- By product category, solid state drives led with 43.62% revenue share in 2025, while the same segment posts the highest 20.4% CAGR through 2031.
- By algorithm standard, Advanced Encryption Standard captured 61.75% of the hardware encryption market share in 2025; post-quantum algorithms record the fastest 35.1% CAGR to 2031.
- By architecture, application-specific integrated circuits held 57.05% share of the hardware encryption market size in 2025, while system-on-chip with secure element integration expands at a 22.3% CAGR.
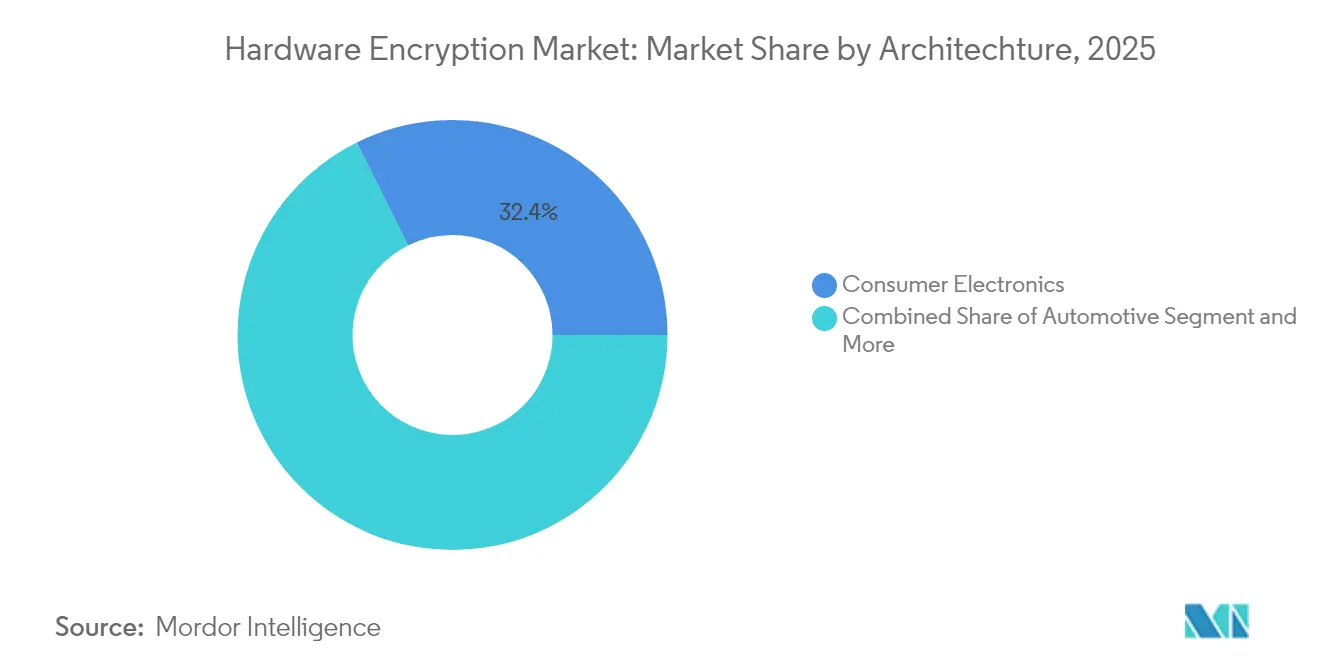
- By end-use industry, consumer electronics accounted for 32.35% of the hardware encryption market size in 2025; automotive advances at a 26.4% CAGR through 2031.
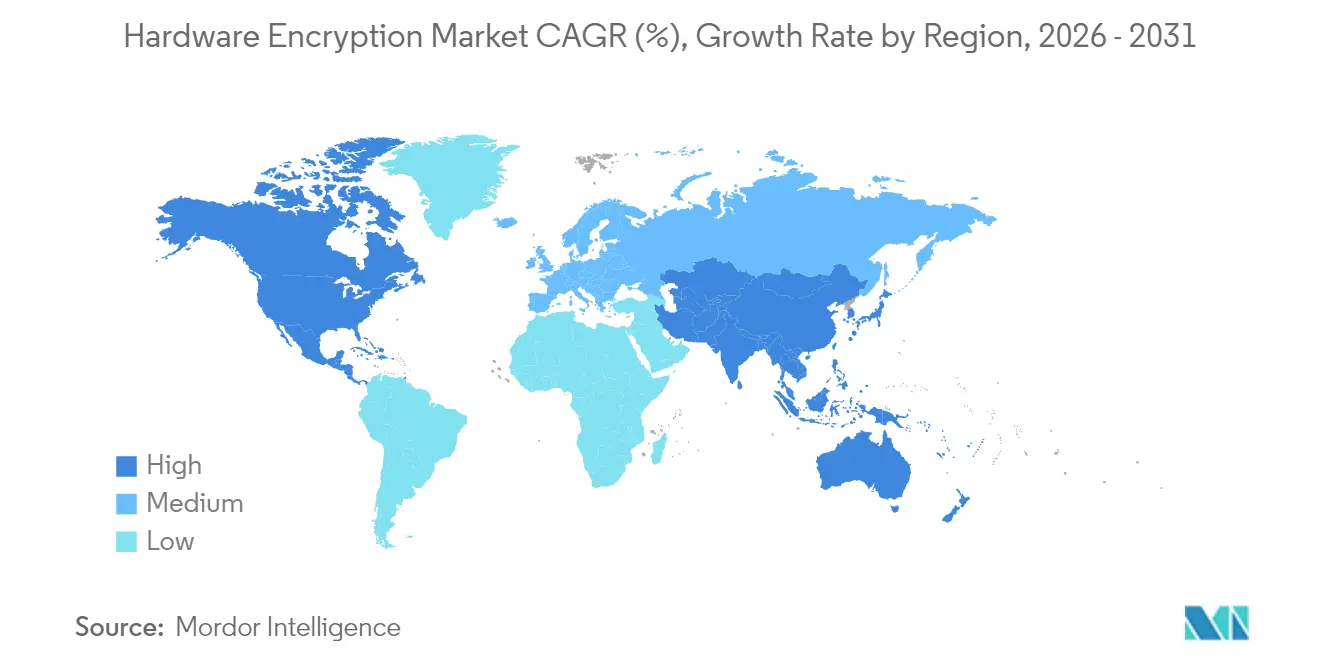
- By geography, North America controlled 37.95% revenue in 2025, whereas Asia-Pacific records the highest 21.9% CAGR.
Note: Market size and forecast figures in this report are generated using Mordor Intelligence’s proprietary estimation framework, updated with the latest available data and insights as of 2026.
Market Trends and Insights
Drivers Impact Analysis of Hardware Encryption Market*
| Driver | (~) % Impact on CAGR Forecast | Geographic Relevance | Impact Timeline |
|---|---|---|---|
| Rising SSD adoption in enterprise data-centres | +1.2% | Global, concentrated in North America and Asia-Pacific | Medium term (2-4 years) |
| Regulatory push for encrypted storage in automotive E/E architectures | +0.8% | Global, led by EU and North America | Long term (≥ 4 years) |
| Edge-AI proliferation demanding on-device security accelerators | +0.9% | APAC core, spill-over to North America | Medium term (2-4 years) |
| National zero-trust mandates in public clouds | +0.7% | North America and EU, expanding to Asia-Pacific | Short term (≤ 2 years) |
| Quantum-resistant controller chip launches | +0.6% | Global, early adoption in defense sectors | Long term (≥ 4 years) |
| Circular-economy demand for drive-level crypto-erase | +0.3% | EU and North America | Medium term (2-4 years) |
| Source: Mordor Intelligence | |||
Rising SSD Adoption in Enterprise Data-Centres
Enterprise operators moved rapidly to encrypted NVMe SSDs because AI training and inference workloads require simultaneous performance and security. Micron reported data-center SSD revenue above USD 1 billion in a single quarter of 2024, with encrypted drives priced 15-20% higher than standard models[1]Micron Technology, “Micron Reports Data Center SSD Revenue Milestone,” micron.com. KIOXIA’s CM9 series shows that PCIe 5.0 interfaces now deliver real-time encryption with a 65% gain in random write throughput versus the prior generation Kioxia. This performance parity removes historic hesitancy around cryptographic overhead. Hyperscale providers are consequently standardizing encrypted storage to satisfy sovereign data-protection frameworks across regions.
Edge-AI Proliferation Demanding On-Device Security Accelerators
Inference hardware at the edge requires embedded cryptographic blocks that shield model weights and input data. Apple’s Private Cloud Compute design uses secure enclaves to lock AI parameters during execution. NXP integrates EdgeLock Secure Enclave inside i.MX processors to manage keys and detect tampering for AI boards NXP. Advantech combines TPM features with NVIDIA Jetson modules to harden robotics and smart-camera deployments. This tight coupling of AI acceleration and encryption opens new demand segments where protection of intellectual property becomes a purchase criterion.
National Zero-Trust Mandates in Public Clouds
Executive memo M-22-09 orders all United States federal agencies to encrypt data in transit and at rest, explicitly favoring hardware modules for sensitive workloads. CISA’s BOD 25-01 extends similar conditions to federal cloud suppliers. FedRAMP modernization gives fast-track approval to providers that show hardware-based security evidence, creating ripple effects across commercial cloud offerings. As a result, the hardware encryption market sees accelerated uptake from cloud operators keen to retain government contracts.
Quantum-Resistant Controller Chip Launches
SEALSQ’s QS7001 secure element includes CRYSTALS-Kyber and CRYSTALS-Dilithium algorithms, marking commercial feasibility of post-quantum cryptography in small form factors. HP embedded similar algorithms in enterprise printers through dedicated ASICs. Microchip added quantum resistance into embedded controllers to align with the 2027 CNSA 2.0 timeline. Early adoption offers equipment makers a branding advantage while aligning long-term compliance with future federal standards.
Restraints Impact Analysis of Hardware Encryption Market*
| Restraint | (~) % Impact on CAGR Forecast | Geographic Relevance | Impact Timeline |
|---|---|---|---|
| Premium pricing versus software encryption | -0.9% | Global, acute in price-sensitive markets | Short term (≤ 2 years) |
| Supply-chain scarcity of advanced crypto-IP cores | -0.7% | Global, concentrated in Asia-Pacific manufacturing | Medium term (2-4 years) |
| Export-control restrictions on high-grade algorithms | -0.5% | Global, US-origin technology restrictions | Long term (≥ 4 years) |
| Firmware-level side-channel attack disclosures | -0.4% | Global, affecting trust in hardware solutions | Short term (≤ 2 years) |
| Source: Mordor Intelligence | |||
Premium Pricing Versus Software Encryption
Hardware solutions cost 40-60% more than software counterparts, limiting penetration in consumer devices and small enterprises. Kingston’s encrypted USB line sells for USD 89-199, far above USD 29-49 unencrypted options. Data-center SSDs show 15-20% premiums that some operators still consider non-essential. While software encryption can satisfy baseline compliance, long-run performance drag and key-management complexity raise operational expense, nudging large workloads toward hardware when budgets allow.
Supply-Chain Scarcity of Advanced Crypto-IP Cores
A small pool of IP vendors makes cutting-edge cryptographic cores, so sudden demand spikes stretch foundry slots. Hafnium price jumps of 400% lifted DRAM controller costs that feed encryption SSDs. TSMC’s 3-6% wafer-price increase further compresses margins for niche security chips. Export limits on 7 nm fabrication tools add pressure, giving incumbents with secured allocations a structural edge and delaying novel designs from start-ups.
*Our forecasts treat driver/restraint impacts as directional, not additive. The impact forecasts reflect baseline growth, mix effects, and variable interactions.
Hardware Encryption Market Segment Analysis
By Product:
SSD Dominance Drives Enterprise TransformationSolid state drives held 43.62% of the hardware encryption market share in 2025 and are expanding at a 20.4% CAGR to 2031, demonstrating how performance requirements converge with cryptographic mandates. The hardware encryption market size attached to SSD shipments is projected to surpass HDD shipments before 2027 as hyperscalers refresh fleets. Samsung’s PM9C1a rolls out Device Identifier Composition Engine standards while sustaining 6,000 MB/s reads. HDDs still serve archival tiers and show slower rotation speeds but remain relevant where cost per TB matters. Seagate’s Exos X24 provides 24 TB per drive with built-in encryption for hyperscale cold storage. USB drives satisfy mobile workflows, whereas inline network encryptors protect SAN links that exceed 64 GFC and now integrate quantum-resistant functions.
The product landscape evolves toward tighter storage-encryption coupling. Integrated solutions remove latency from external appliances and simplify key life-cycle workflows. In the automotive domain, encrypted eMMC and UFS modules also adopt the same SSD controller designs, opening cross-segment synergies. Vendors that control NAND, firmware, and cryptographic IP simultaneously are positioned to capture value when customers pursue single-vendor validation to streamline audits.


By Algorithm Standard:
Post-Quantum Emergence Challenges AES HegemonyAdvanced Encryption Standard algorithms possessed 61.75% share in 2025 because regulators and industry bodies long endorsed AES-128 and AES-256 for bulk data. Yet the post-quantum cohort records the highest 35.1% CAGR through 2031, reflecting urgent preparation for quantum attacks. The hardware encryption market size linked to post-quantum shipments accelerates once NIST finalizes draft standards in 2025. SEALSQ demonstrated Kyber and Dilithium inside secure elements that fit the same footprint as prior RSA modules. Hybrid modes that pair AES-256 with Kyber-1024 offer backward compatibility during migration.
RSA and elliptic-curve methods linger in digital-signature workflows where certification chains remain static. Intel pledged FIPS 140-3 certification across new product launches to remove procurement friction for federal buyers. As algorithm tool-chains mature, cross-vendor interoperability becomes key, pushing the hardware encryption market toward open certification suites and common APIs that hide algorithm changes from application developers.
By Architecture:
SoC Integration Transforms Security ParadigmsApplication-specific integrated circuits delivered 57.05% revenue in 2025 because they offer watt-efficient throughput for bulk cryptography in data-center flash arrays. The shift to system-on-chip designs with secure elements drives a superior 22.3% CAGR as IoT and automotive platforms seek single-package cost control. The hardware encryption market size captured by SoC-based designs will overtake discrete ASIC designs by 2029 if the present trajectory holds.
NXP embeds autonomous key storage inside i.MX9 processors, eliminating the need for external security chips in gateways or smart meters. FPGAs remain relevant to prototype post-quantum algorithms because bit-stream updates allow field upgrades without full silicon respins. Intel’s Total Memory Encryption provides runtime memory confidentiality inside server CPUs, removing the need for motherboard TPMs in some secure-boot chains. As more encryption moves on-die, board layouts simplify, and supply-chain validation is easier because fewer chips change between revisions.
By End-Use Industry:
Automotive Acceleration Outpaces Consumer GrowthConsumer electronics stored 32.35% revenue in 2025 driven by default smartphone encryption and secure enclave processors in personal computers. Automotive, though smaller, advances with a 26.4% CAGR as software-defined vehicles rely on encrypted electronic control units and protected over-the-air updates. AUTOSAR’s Secure Hardware Extension sets uniform AES-128 requirements for microcontrollers that manage drivetrain safety. Vehicle manufacturers select hardware modules that pass functional safety and FIPS validations in parallel.
Government and defense sectors keep ordering high-assurance modules that meet stringent temp and tamper-proof specs. Banking and financial services align adoption timelines with PCI DSS 4.0 rules that encourage hardware-based cryptography for point-of-sale and tokenization servers. Healthcare adopts encryption for patient records as HIPAA modernization calls out hardware modules for field medical devices. Manufacturing plants protect industrial intellectual property through encrypted PLC firmware, while IT and telecom providers prefer line-rate network encryptors that combine traffic inspection with post-quantum upgrades.
Geography Analysis
North America Hardware Encryption Market
North America commanded 37.95% revenue in 2025. Executive Order 14028 mandates encryption across federal systems, propelling FIPS-validated module demand GSA. Western Digital logged 119% cloud-business growth as encrypted SSDs became standard for hyperscalers. Canada’s alignment with the Cryptographic Module Validation Program extends similar requirements northward, while Mexico’s manufacturing corridor deploys secure industrial networks for cross-border trade.
APAC Hardware Encryption Market
Asia-Pacific posts the strongest 21.9% CAGR. Samsung’s semiconductor business generated KRW 30.1 trillion in Q4 2024, underpinned by high-bandwidth memory and server SSD lines that now default to hardware encryption. China’s critical-infrastructure law insists on localized encrypted storage in power and telecom grids. India’s financial digitization effort pushes banks to roll out FIPS-compliant HSMs for real-time payment rails. Japan’s Basic Cybersecurity Act obliges key infrastructure to adopt certified modules, fueling domestic demand. South Korea leads NAND capacity expansions that feed the worldwide hardware encryption market.
Europe Hardware Encryption Market
Europe gains steady traction because GDPR and the NIS 2 directive embed encryption in data-protection norms. German vehicle makers pioneer encrypted ECU communications ahead of UN R155 rules. The United Kingdom emphasizes domestically controlled encryption IP in its post-Brexit cyber strategy. Nordic governments run fully digital healthcare systems that rely on secure microcontrollers. France focuses on secure microcontroller development, while Spain and Italy roll encryption into smart-meter rollouts. Harmonized certification schemes in ETSI and ENISA streamline vendor penetration and maintain balanced growth.

Competitive Landscape
The hardware encryption market balances between diversified storage suppliers and specialist security chip makers. Western Digital, Samsung, Micron, and Seagate embed encryption directly in drives, capitalizing on scale to pass FIPS tests quickly. Intel, Broadcom, and Marvell add cryptographic offload into processors and adapter cards to maintain data-center performance margins. Thales and SEALSQ court defense and finance buyers with certified high-assurance modules that integrate post-quantum functions.
Vertical integration remains the dominant strategy. Companies that own cryptographic IP, firmware stacks, and validation laboratories reduce time to certification and capture premium pricing. Marvell’s LiquidSecurity card gives cloud operators HSM functionality without external appliances. Patent portfolios around hybrid post-quantum schemes act as competitive shields. Supply-chain control also matters; firms with local 7 nm foundry agreements avoid export-control disruption. Start-ups targeting automotive secure gateways or edge-AI coprocessors partner with Tier-1 suppliers to overcome certification learning curves.
Market entrants differentiate on post-quantum readiness, energy efficiency, and integrated secure-boot frameworks. Strategic alliances, such as PQShield with SiFive, extend RISC-V chips into the security domain while lowering licensing costs. Acquisition activity continues as larger EDA providers, like Cadence, buy embedded security IP vendors to bundle encryption hard macros into chip-design suites. Over the next five years, certification costs and foundry scarcity could lift consolidation momentum, narrowing the field to players with end-to-end cryptographic competence.
Hardware Encryption Industry Leaders
Western Digital Technologies
Samsung Electronics
Micron Technology, Inc.
Kingston Technology Corporation
Seagate Technology
- *Disclaimer: Major Players sorted in no particular order
Hardware Encryption Market Companies Covered in this Report
- Western Digital Technologies
- Samsung Electronics
- Micron Technology
- Kingston Technology
- Seagate Technology
- Intel Corporation
- Thales Group
- Broadcom Inc
- IBM Corporation
- NetApp Inc
- Toshiba Corporation
- Microchip Technology
- Kanguru Solutions
- Gemalto (Thales DIS)
- Maxim Integrated (ADI)
- WinMagic
- Apricorn
- Rohde & Schwarz Cybersecurity
- Futurex
- SEALSQ (WISeKey)

Recent Industry Developments in Hardware Encryption Market
- May 2025: SEALSQ unveiled QS7001 secure element with Kyber and Dilithium to protect cryptocurrency wallets against quantum attacks.
- May 2025: KIOXIA announced CM9 Series PCIe 5.0 NVMe SSDs up to 61.44 TB, offering 65% faster random writes over predecessors.
- April 2025: Seagate introduced Exos M hard drives up to 36 TB using Mozaic 3+ HAMR, cutting power per TB by 60% in data-center racks.
- April 2025: Micron reorganized into a dedicated Automotive and Embedded unit to align security-focused memory with vehicle connectivity.


Hardware Encryption Market Report Scope and Research Methodology
Market Definition and Coverage
Our study defines the hardware encryption market as revenue generated from dedicated silicon or board-level components that encrypt data at rest or in motion within storage drives, removable media, and inline network encryptors. The definition follows the scope set out in the FIPS 140 validation program and covers both consumer-grade and enterprise-grade self-encrypting devices that ship new from the factory.
Scope Exclusion: Purely software-based cryptography, cloud key-management services, and general-purpose hardware security modules sit outside the frame of this report.
Segments Covered in This Report
- By Product
- Hard Disk Drives (HDD)
- Solid State Drives (SSD)
- Universal Serial Bus (USB) Drives
- Inline Network Encryptors
- By Algorithm Standard
- Advanced Encryption Standard (AES)
- Rivest-Shamir-Adleman (RSA)
- Elliptic-Curve Cryptography (ECC)
- Post-Quantum Algorithms
- By Architecture
- Application-Specific IC (ASIC)
- Field-Programmable Gate Array (FPGA)
- System-on-Chip (SoC) with Secure Element
- Trusted Platform Module (TPM)
- By End-Use Industry
- Consumer Electronics
- Automotive
- Government and Defense
- Healthcare and Life Sciences
- Banking, Financial Services and Insurance (BFSI)
- Manufacturing
- IT and Telecom
- Others
- By Geography
- North America
- United States
- Canada
- Mexico
- South America
- Brazil
- Argentina
- Rest of South America
- Europe
- United Kingdom
- Germany
- France
- Italy
- Spain
- Nordics
- Rest of Europe
- Middle East and Africa
- Middle East
- Saudi Arabia
- United Arab Emirates
- Turkey
- Rest of Middle East
- Africa
- South Africa
- Egypt
- Nigeria
- Rest of Africa
- Middle East
- Asia-Pacific
- China
- India
- Japan
- South Korea
- ASEAN
- Australia
- New Zealand
- Rest of Asia-Pacific
- North America
Data Sources, Market Sizing, and Validation
Primary Research
We interviewed firmware architects at SSD suppliers, procurement managers for Tier-1 data-center operators in North America and APAC, and information-security consultants serving government, healthcare, and automotive clients. Their insights validated adoption rates, clarified average selling prices, and highlighted regulation-driven demand shifts that secondary sources could not fully capture.
Desk Research
Mordor analysts first collected publicly available datasets from agencies such as NIST (FIPS 140 certificates), the U.S. Bureau of Industry and Security export statistics, Eurostat trade codes for encrypted drives, and customs records accessed through Volza. Additional inputs came from Trusted Computing Group white papers, SEC filings of major drive OEMs, and press releases tracked in Dow Jones Factiva. Company annual reports, investor decks, and patent families sourced via Questel rounded out trend mapping. This list is illustrative, not exhaustive, and many other publications were reviewed for corroboration.
Market-Sizing & Forecasting
A top-down model begins with annual shipments of SSD, HDD, USB, and inline encryptor units published by IDC and SIA, multiplied by encryption attach rates derived from primary calls. Results are then reconciled with a bottom-up roll-up of sampled supplier revenue to refine totals. Core variables include NVMe SSD shipment growth, FIPS 140-3 certification backlog, average capacity per encrypted drive, regulatory fines linked to GDPR, and enterprise cloud storage penetration. Multivariate regression, supported by scenario analysis for regulatory tightening, projects values to 2030, with gaps in supplier disclosures filled through weighted interpolation of peer data.
Data Validation & Update Cycle
Model outputs pass variance checks against independent indicators, after which a senior analyst reviews anomalies. Reports refresh yearly, while any material event, such as a new federal mandate, triggers an interim update followed by a fresh editorial pass before release.
How Mordor Intelligence's Hardware Encryption Market Size Compares to Other Published Estimates
Published figures often diverge because firms choose dissimilar scopes, pricing ladders, and refresh cadences.
Key gap drivers include whether USB tokens or full HSM appliances are bundled, if currency conversions use average or spot rates, and the aggressiveness of scenario assumptions. Mordor's disciplined segmentation and yearly refresh ensure a balanced baseline clients can trace back to explicit variables.
Benchmark comparison
| Market Size | Anonymized source | Primary gap driver |
|---|---|---|
| USD 332.57 million (2025) | Mordor Intelligence | - |
| USD 359.5 million (2025) | Global Consultancy A | Counts self-encrypting drives only and then extrapolates limited vendor samples, omitting inline encryptors. |
| USD 368.11 billion (2025) | Industry Research Firm B | Bundles HSMs, cryptographic IP cores, and automotive security microcontrollers, leading to magnitude inflation. |
| USD 505.46 billion (2025) | Trade Journal C | Conflates all encryption-enabled silicon, including smartphone SoCs, and applies optimistic ASP progressions. |
The comparison shows that when scope widens indiscriminately or validation steps are skipped, totals swing wildly. By anchoring estimates to shipment evidence, verified attach rates, and a transparent review cycle, Mordor Intelligence delivers a dependable reference point for strategic planning.


Key Questions Answered in the Report
What is the current value of the hardware encryption market?
The market stands at USD 347.17 million in 2026 and is forecast to reach USD 430.22 million by 2031.
Which product segment grows the fastest?
Solid state drives show the highest 20.4% CAGR, reflecting rising data-center adoption.
Why is post-quantum cryptography important for hardware encryption?
Quantum-resistant algorithms such as Kyber and Dilithium safeguard data against future quantum-computer attacks and already appear in secure elements and printers shipping in 2025.
Which region offers the strongest growth potential?
Asia-Pacific posts the fastest 21.9% CAGR due to semiconductor manufacturing capacity, new cybersecurity laws, and expanding cloud infrastructure.
How do premium costs affect hardware encryption adoption?
Hardware options cost up to 60% more than software, delaying purchases in cost-sensitive sectors, though performance and key-management advantages often justify the investment for high-throughput workloads.
What certification is most critical for hardware encryption vendors?
FIPS 140-3 validation remains the cornerstone for federal and regulated-industry sales, driving vendors to integrate approved algorithms and undergo rigorous testing.
Page last updated on:


