
Wedding Services Market Size and Share
Market Overview
| Study Period | 2022 - 2032 |
|---|---|
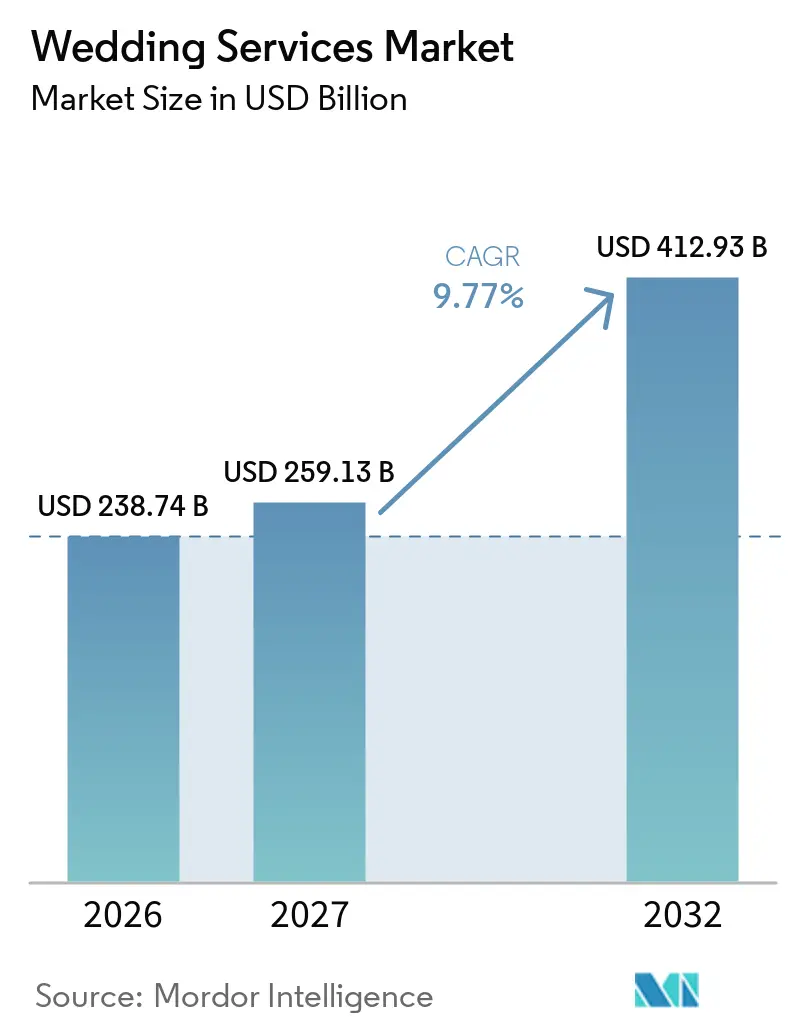
| Market Size (2027) | USD 259.13 Billion |
| Market Size (2032) | USD 412.93 Billion |
| Growth Rate (2027 - 2032) | 9.77 % |
| Fastest Growing Market | Asia-Pacific |
| Largest Market | Asia-Pacific |
| Market Concentration | Low |
Major Players *Disclaimer: Major Players sorted in no particular order Image © Mordor Intelligence. Reuse requires attribution under CC BY 4.0. | |
Wedding Services Market Analysis by Mordor Intelligence
The global wedding services market size was valued at USD 238.74 billion in 2026 and is estimated to grow from USD 259.13 billion in 2027 to reach USD 412.93 billion by 2032, at a CAGR of 9.77% during the forecast period (2027-2032). Growth reflects a shift toward multi-vendor celebrations that combine catering, décor, planning, photography, and travel services. Couples are spending more on personalized formats, guest experiences, and professional coordination, increasing revenue per celebration despite pressure on marriage volumes. In Asia-Pacific, large ceremonies, destination weddings, and hotel-led service packages increase value per wedding. The global wedding services market also benefits from digital discovery, which gives couples access to more verified vendors, while offline consultations remain central to final decisions. Higher operating costs and declining marriage rates in several mature economies constrain volumes but have not eliminated demand for professionally managed celebrations.
Key Report Takeaways
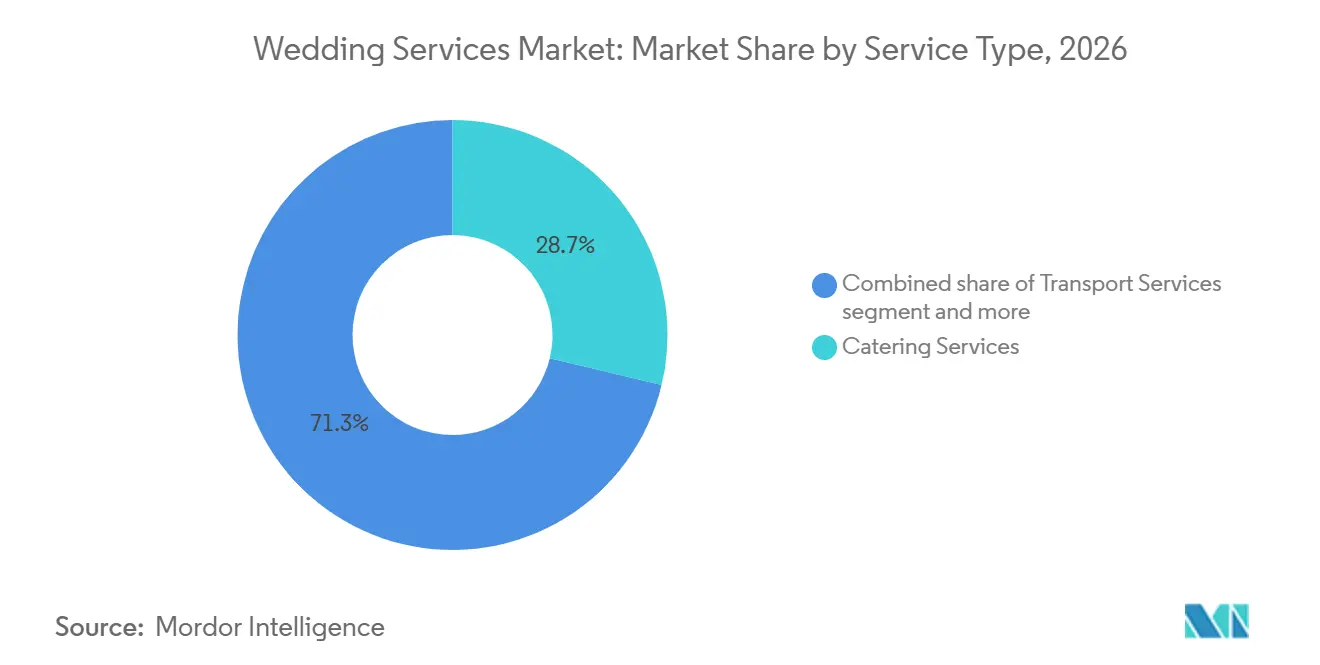
- By service type, Catering Services accounted for 28.73% of the global wedding services market share in 2026, while Decoration and Floral Services are projected to grow at a 10.73% CAGR through 2032.
- By wedding type, Local Weddings accounted for 75.93% of the global wedding services market share in 2026, while Destination Weddings are projected to grow at a 10.93% CAGR through 2032.
- By booking mode, Offline Booking accounted for 59.62% of the global wedding services market share in 2026, while Online Booking is projected to grow at an 11.73% CAGR through 2032.
- By planning model, Full-Service Planning accounted for 43.83% of the global wedding services market share in 2026, while Partial Planning is projected to grow at a 10.93% CAGR through 2032.
- By geography, Asia-Pacific accounted for 33.92% of the global wedding services market share in 2026 and is projected to grow at an 11.01% CAGR through 2032.
Note: Market numbers in this report are based on Mordor Intelligence's proprietary estimation framework, which combines nine months of actuals with Q4 projections for base year 2026.
Market Trends and Insights
Drivers Impact Analysis of Wedding Services Market*
| Driver | (~) % Impact on CAGR Forecast | Geographic Relevance | Impact Timeline |
|---|---|---|---|
| Rising Spending on Personalized and Premium Weddings | +2.5% | Global, with intensity in Asia-Pacific, North America, the Middle East and Africa | Medium term (2-4 years) |
| Expansion of Destination and Multi-Day Weddings | +1.8% | Global, highest in Europe, Asia-Pacific, and North America | Medium term (2-4 years) |
| Adoption of Digital and AI-Assisted Wedding Planning | +1.5% | North America, Europe, East Asia, with early Asia-Pacific adoption | Short term (≤ 2 years) |
| Increasing Outsourcing of Vendor Coordination to Professionals | +1.2% | Asia-Pacific core, with growth in the Middle East and Africa and South America | Medium term (2-4 years) |
| Weddings Evolving into Multi-Event Travel Ecosystems | +0.8% | North America, Europe, and Asia-Pacific | Long term (≥ 4 years) |
| Virtual Venue Tours Enabling Cross-Border Booking | +0.5% | Global, with strongest adoption in Europe and North America | Short term (≤ 2 years) |
| Source: Mordor Intelligence | |||
Rising Spending on Personalized and Premium Weddings
Personalization is increasing the number and value of services purchased for each celebration in the global wedding services market. In the United States, 77% of couples who adjusted their budgets due to economic pressures increased spending, while three in four considered their 2025 wedding financially worthwhile[1]. Gen Z accounted for 41% of surveyed United States couples and drove demand for original vows, wedding content creators, and locally sourced products, increasing demand for planners, florists, caterers, and photographers. In India, destination wedding budgets averaged INR 58 lakh (USD 65,200) in 2025, and more than 60% of weddings with budgets above INR 1 crore (USD 112,400) took place away from home. This preference supported higher-value hotel packages and bundled vendor services, particularly in Rajasthan, Goa, and other established wedding destinations. Providers that coordinate individualized design choices rather than treating each service as a separate transaction play a broader role in the market.
Expansion of Destination and Multi-Day Weddings
Destination and multi-day wedding formats increase per-event spending on accommodation, food, décor, travel, and logistics. In India, destination weddings accounted for one in four events in 2025, with 89% held within the country. Rajasthan, Himachal Pradesh, and Goa benefit from this trend, as heritage venues and resorts can host multiple functions during a single stay[2]. Italy hosted more than 15,000 weddings involving foreign couples in 2024, generating nearly EUR 1 billion (USD 1.18 billion) in revenue and demonstrating the revenue potential of international celebrations. These formats also require longer planning cycles to coordinate accommodations, transportation, guest schedules, and multiple ceremonies. The global wedding services market benefits from changing venue preferences and the expanded range of billable services associated with destination and multi-day weddings.
Adoption of Digital and AI-Assisted Wedding Planning
The global wedding services market is evolving as digital planning tools help couples identify, compare, and contact suppliers. The Knot reported that 36% of United States couples used artificial intelligence in their 2025 wedding planning, nearly double the 2024 level. Its Make It Yours feature used saved inspiration to match couples with local vendors. In pilot testing, users of the related Your Vendors feature were 16% more likely to move from shortlists to confirmed bookings. David’s Bridal introduced its AI-powered Pearl Planner in beta in June 2025, offering guided support for more than 100 wedding planning tasks. In China, providers introduced virtual dress fitting, image editing, and 24/7 planning support, supporting vendor discovery and customer service. These tools can shorten early-stage discovery across dispersed destination venues, although final decisions often depend on family consultations and site visits.
Increasing Outsourcing of Vendor Coordination to Professionals
The global wedding services market benefits from professional coordination as weddings involve multiple suppliers and complex schedules. The Knot’s 2025 Real Weddings Study found that United States couples hired an average of 13 vendors, highlighting the operational complexity of managing catering, photography, floral design, entertainment, and venue services. In Tuscany, wedding-planner use reached 52.8% among foreign couples in 2024, while Italy’s national rate rose from 44.2% to 46.3%. These trends support demand for professional coordination and flexible planning packages. Partial planning can appeal to couples who retain creative control while delegating vendor management and event-day execution to specialists.
Restraints Impact Analysis of Wedding Services Market*
| Restraint | (~) % Impact on CAGR Forecast | Geographic Relevance | Impact Timeline |
|---|---|---|---|
| Declining Marriage Rates in Mature Markets | -1.2% | Western Europe, East Asia, and North America | Long term (≥ 4 years) |
| Inflation in Venue, Food, Labor, and Floral Costs | -0.8% | Global, with greater intensity in North America and Western Europe | Medium term (2-4 years) |
| Fragmented Vendor Cancellation and Quality Risk | -0.6% | Global, with higher exposure in Asia-Pacific and emerging markets | Medium term (2-4 years) |
| Cross-Border Travel Disruption and Guest Affordability Pressure | -0.4% | Middle East and Africa, Asia-Pacific, and South America | Short term (≤ 2 years) |
| Source: Mordor Intelligence | |||
Declining Marriage Rates in Mature Markets
Lower marriage rates reduce the number of potential wedding events in mature economies. The European Union's crude marriage rate was 3.9 per 1,000 persons in 2024, compared with 8.0 per 1,000 persons in 1964[3]. The rate declined across 15 European Union countries with available 2024 data. South Korea has also experienced a long-term decline in marriage rates, driven by changing economic conditions and shifts in the relative economic positions of men and women. These trends constrain volume growth for providers that rely on local ceremonies, particularly in Western Europe and East Asia. Higher spending per event can partially offset lower volumes but cannot overcome this demographic constraint.
Inflation in Venue, Food, Labor, and Floral Costs
Rising costs affect couples’ budgets and supplier margins in the global wedding services market. In the United States, 85% of couples reported that economic conditions influenced their 2025 wedding planning, with imported florals, fabrics, and specialty food items facing cost pressures. The average wedding catering cost was USD 80 per guest in 2024, compared with USD 85 in 2023, a decline that may reflect menu changes and vendor margin pressure rather than lower underlying costs. Higher hospitality prices in several markets also make it more difficult for mid-tier customers to maintain full-package wedding budgets. Couples responded by selecting curated food stations, reducing guest lists, or choosing partial-service arrangements. These trends may divide demand between full-service, high-cost celebrations and budget-focused events that purchase fewer bundled services.
*Our forecasts treat driver/restraint impacts as directional, not additive. The impact forecasts reflect baseline growth, mix effects, and variable interactions.
Consumer Preferences & Spending Patterns
Wedding planning increasingly combines digital discovery with professional guidance and family-led decision-making. In the United States, 89% of couples booked a venue, 88% hired a photographer, and 85% secured catering for their 2025 weddings. Additionally, 36% used AI for planning tasks. These findings indicate demand for essential vendors and digital planning tools. Platforms offering searchable vendor profiles, virtual consultations, transparent pricing, and reliable on-ground coordination can reduce comparison friction while maintaining family confidence in booking decisions. Short-form video and social media-ready photography also create opportunities for differentiated media packages.
India’s wedding spending increased by 8% year over year in 2025. Destination wedding budgets rose from INR 51.1 lakh (USD 57,400) in 2024 to INR 58 lakh (USD 65,200) in 2025, while average wedding loans reached INR 15.5 lakh (USD 17,400), according to WedMeGood’s 2025–2026 industry report. Higher spending and borrowing indicate demand for enhanced wedding experiences, although affordability remains a key consideration. Full-service packages can serve high-spending clients, while partial-planning and à-la-carte coordination can support cost-conscious families without requiring them to relinquish control over key decisions.
Wedding Services Market Performance Intelligence
Wedding service pricing varies by format, location, and scope, supporting tiered packages and destination offerings. In the United States, couples spent an average of USD 34,000 in 2025, including USD 12,200 on venues and USD 80 per guest on catering, according to The Knot Worldwide’s 2026 Real Weddings Study. In India, destination weddings averaged INR 58 lakh (USD 65,200) in 2025, compared with INR 39.5 lakh (USD 44,400) for average weddings, according to WedMeGood’s 2025-2026 industry report. Tuscany recorded average destination wedding spending of EUR 68,600 (USD 80,695) in 2024, according to Fondazione Destination Florence. These higher costs support bundled venue, catering, and coordination services, while travel and accommodation costs increase budget sensitivity.
Digital discovery reshapes vendor acquisition, but conversion depends on trust and responsiveness. The Knot’s vendor-planning pilot found that users managing vendor shortlists were 16% more likely to confirm a booking, while 37% of couples expanded vendor outreach during 2025 planning. In India, WedMeGood reported 38% digital payment adoption among its couple base in 2025. These trends favor verified profiles, faster responses, and secure payments.
Wedding Services Market Segment Analysis
By Service Type:
Catering Anchors Revenue as Décor Outpaces GrowthCatering Services accounted for 28.73% of the global wedding services market in 2026, making it the largest service category. Food and beverages remain central to the guest experience across wedding formats. In the United States, 85% of couples secured a caterer for their 2025 wedding. Caterers also benefit from multi-day celebrations. Multi-day weddings often require varied menus for different rituals and guest groups, supporting caterers and hotel kitchens. However, food, energy, labor, and imported ingredient costs affect menu design and margins.
Decoration and Floral Services segment is forecast to grow at a 10.73% CAGR through 2032. Social media and content creation drive demand for themed décor, tablescapes, floral installations, and photogenic settings. Photography and Videography Services also benefit from demand for video and short-form content alongside traditional photographs. In Japan, 71% of wedding photographers reported demand for video alongside photography in 2025. Wedding Planning Services benefit from coordination needs, especially for destination events. Transport and other services, including entertainment and stationery, benefit as multi-day formats add functions and guest travel.


By Wedding Type:
Local Weddings Sustain Volume as Destination Formats Revalue the MarketLocal weddings accounted for 75.93% of category revenue in 2026, as most ceremonies take place near the couple’s home location. Guest convenience, family traditions, and lower travel requirements support this share. Local events also drive the adoption of digital booking tools, automated vendor searches, and standardized catering packages. They provide recurring demand across cities and towns, reducing providers’ reliance on destination locations. Local weddings remain significant despite increased attention to destination formats. Providers with reliable local vendor networks can serve higher ceremony volumes and offer additional options when budgets permit.
Destination weddings are forecast to grow at a CAGR of 10.93% through 2032, outpacing the broader category. India’s average destination wedding budget was INR 58 lakh (USD 65,200) in 2025, compared with an average wedding budget of INR 39.5 lakh (USD 44,400)[4]. Higher costs reflect accommodation, travel, multi-day catering, and guest programming. These weddings require stronger vendor coordination because families may organize events away from their home cities. Domestic destinations reduce cross-border travel barriers while allowing hotels and heritage properties to provide immersive event settings.
By Booking Mode:
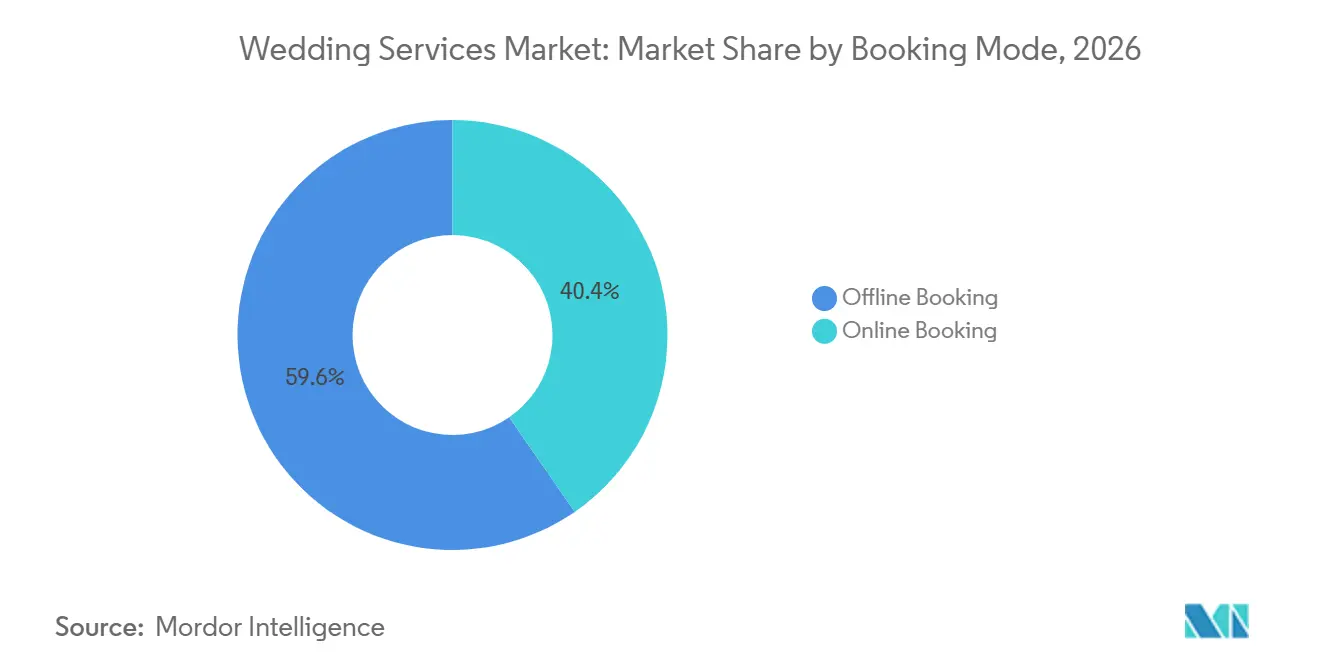
Offline Trust Persists While Online Booking Accelerates StructurallyOffline booking accounted for 59.62% of category revenue in 2026. Couples prefer site visits, tasting sessions, direct meetings, and family discussions before committing to event-day services. This preference remains strong in Asia-Pacific, the Middle East and Africa, and Southern Europe, where families often influence vendor decisions. Offline consultations allow planners and hotels to explain package inclusions, customization limits, and backup arrangements. For destination weddings, venue walkthroughs help couples assess room inventory, travel access, and ceremony spaces together. These factors keep physical consultations relevant despite online searches.
Online booking is forecast to grow at an 11.73% CAGR through 2032. Online tools help couples review suppliers, compare options, create shortlists, and begin planning across cities. The Knot’s network of 200,000 professionals demonstrates how marketplaces aggregate fragmented supply. Artificial intelligence can match aesthetic and location preferences with vendors, reducing discovery time. Digital payments provide transparent transaction records and strengthen customer confidence. Growth will be strongest where platforms combine convenience, human support, and reliable service verification.
By Planning Model:
Full-Service Dominates but Partial Planning Is the Growth EngineFull-Service Planning accounted for 43.83% of category revenue in 2026. This model suits destination weddings, luxury functions, and large multi-day celebrations requiring coordination of multiple vendors over several months. Couples value it for separate rituals, large guest lists, and complex travel schedules. Planners manage budgets, supplier contracts, timelines, and on-site issues, reducing the burden on families. However, planners require a strong reputation because they oversee the overall experience of events. Hotels with in-house wedding specialists offer a similar model within their venues.
Partial Planning is forecast to grow at a 10.93% CAGR through 2032. It allows couples to retain control of design, guest experience, and selected vendors while professionals manage scheduling and execution. The model suits younger couples seeking personalized events but requiring logistical support. It also addresses budget constraints by allowing customers to pay only for difficult-to-manage services. Families can retain cultural and creative decisions while delegating coordination across multiple functions. Day-of coordination and flexible formats expand access without requiring full-service contracts.
Geography Analysis
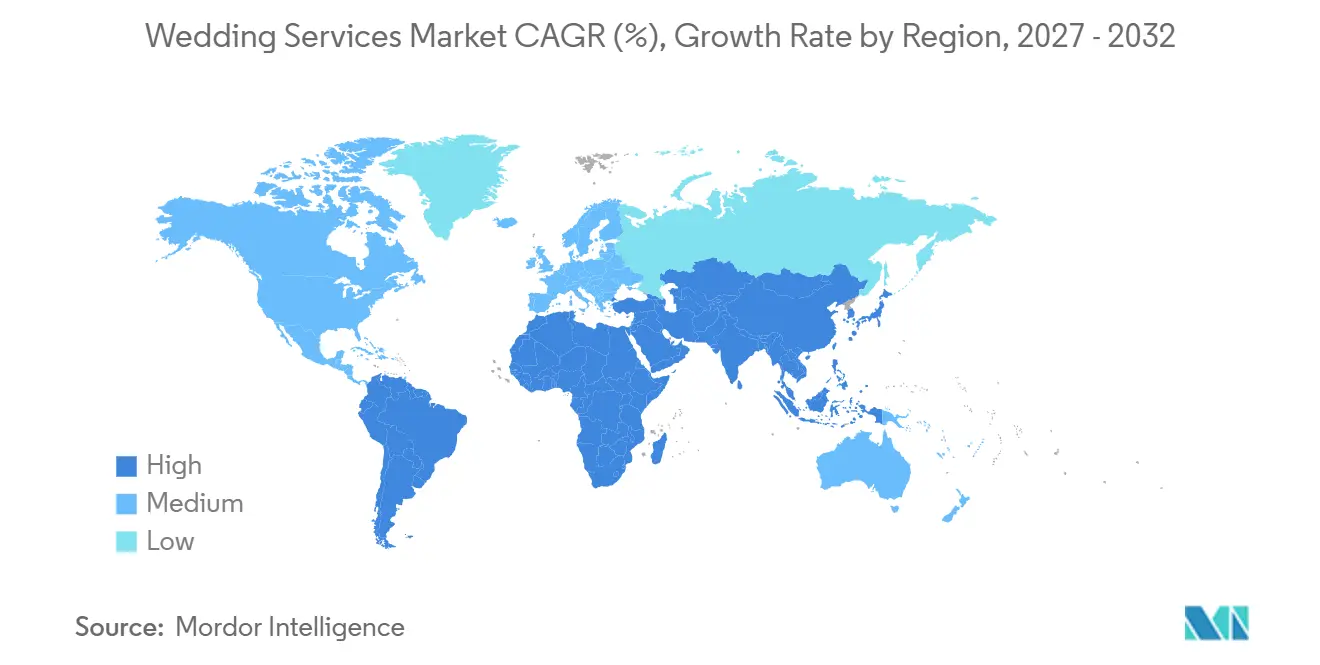
Asia-Pacific accounted for 33.92% of the global wedding services market in 2026 and is projected to grow at an 11.01% CAGR through 2032. High wedding volumes, rising spending, and greater use of professional services support growth. India’s wedding economy reached INR 6.5 lakh crore (USD 73.0 billion) in 2025, while average spending increased 8% year over year. Jaipur recorded India’s highest average destination wedding budget, at INR 73 lakh (USD 82,000). Hotel expansion in Rajasthan, including Hilton Jaipur Kukas, supports large events.
North America is the second-largest regional market, supported by United States spending and digital planning adoption. The United States recorded nearly 2 million weddings in 2025, with average spending of USD 34,000 per event. Venue costs averaged USD 12,200 in 2024. United States couples drive outbound destination demand, including for Italian venues, while Mexico and Canada support domestic and resort-based events. Europe combines high event spending with destination appeal, despite declining marriage volumes in several countries. Italy hosted over 15,000 foreign-couple weddings in 2024, generating nearly EUR 1 billion (USD 1.18 billion). Tuscany recorded over 3,380 events and EUR 215.2 million (USD 253.14 million) in turnover. South America and the Middle East and Africa are developing markets supported by destination locations and demand for professional coordination. The UAE and Saudi Arabia are expanding destination capabilities, while African cities support formal vendor networks.
Service Provider Network & Expansion Intelligence
The global wedding services market comprises fragmented local vendors, digital platforms, and hotel-led ecosystems. The Knot Worldwide’s 2026 Real Weddings Study highlights a network connecting couples with approximately 200,000 local wedding professionals. In India, WedMeGood’s 2025-2026 industry report draws insights from more than 500 professionals across planning, photography, beauty, and venues. Shaadi by Marriott Bonvoy coordinates services through dedicated specialists at Indian properties. These models simplify supplier selection and help providers gain visibility, bundled bookings, and access to destination-wedding demand. Independent vendors continue to compete on price, reputation, and specialization.
Hotel-led expansion is increasing destination capacity and bundled wedding offerings. Hilton Jaipur Kukas, signed in September 2025 and scheduled to open in 2029, will feature 122 rooms, nearly 10,000 sq. ft. of indoor event space, and a 25,000 sq. ft. outdoor banquet lawn. Sandals announced a USD 200 million transformation of three Jamaican resorts in March 2026. These investments integrate venues, accommodation, catering, and guest experiences. Independent planners and specialist vendors can partner with hotels, although bundled resort packages may intensify competition.
Competitive Landscape
Market Concentration
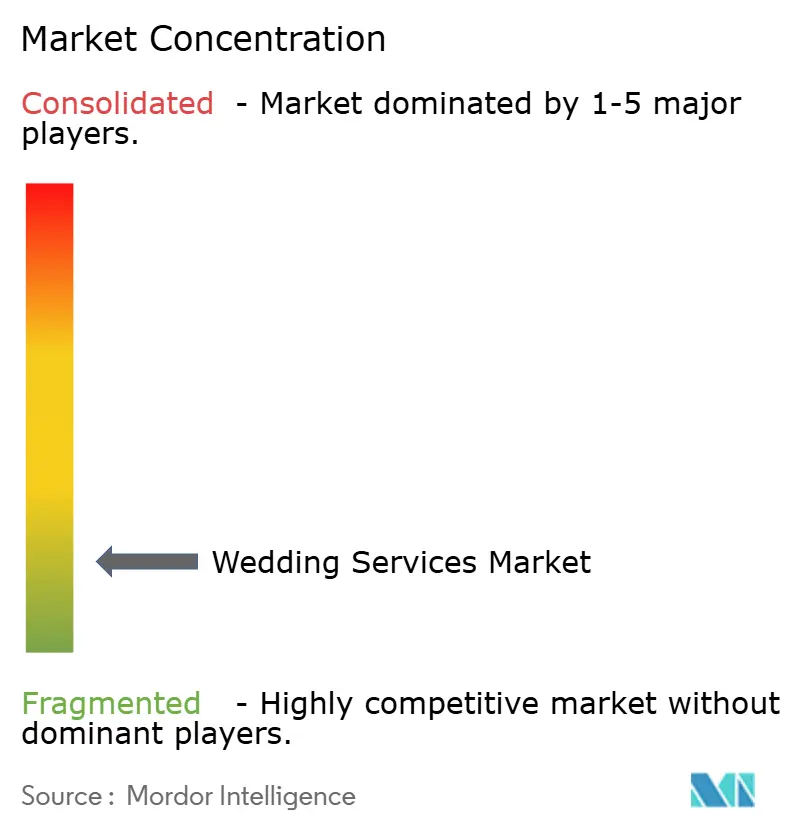
The global wedding services market remains fragmented across hospitality groups, online marketplaces, and independent planners, with no single dominant global provider. Marriott International, Hilton, Hyatt, Four Seasons, and Sandals compete through venue-led wedding services and destination packages, while The Knot Worldwide, WedMeGood, Bridebook, and Easy Weddings facilitate vendor discovery. Hotels leverage event spaces, accommodation, catering, and coordinated services, whereas marketplaces connect couples with independent suppliers. Boutique planners differentiate through personalized design, established vendor networks, and high-touch coordination.
Providers increasingly differentiate through planning technology, personalized packages, and selected sustainability-led offerings. The Knot introduced its AI-powered Make It Yours experience in September 2025 to recommend local vendors using saved visual inspiration. David’s Bridal introduced Pearl Planner in beta in June 2025, offering guided support for more than 100 planning tasks. Marriott’s Shaadi by Marriott Bonvoy integrates wedding planning and property-based services in India. RRoseate Hotels has also adopted 3D digital-twin technology. These developments highlight opportunities in digital discovery and integrated service delivery, while vendor reliability, local relationships, and execution quality remain important competitive factors.
Wedding Services Industry Leaders
-
Marriott International, Inc.
-
Hilton Worldwide Holdings Inc.
-
The Knot Worldwide
-
The Knot Worldwide
-
Sandals Resorts International
- *Disclaimer: Major Players sorted in no particular order
Wedding Services Market Companies Covered in this Report
- The Knot Worldwide
- Marriott International, Inc.
- Hilton Worldwide Holdings Inc.
- Hyatt Hotels Corporation
- Sandals Resorts International
- Four Seasons Hotels and Resorts
- The Indian Hotels Company Limited
- ITC Hotels Limited
- Weddingz.in
- WedMeGood
- Easy Weddings
- Bridebook
- Peerspace
- Tagvenue
- David Stark Design and Production
- Colin Cowie Lifestyle
- Fallon Carter Events
- David Tutera
- Mindy Weiss Party Consultants
- JZ Events
Recent Industry Developments in Wedding Services Market
- August 2026: Sandals Resorts introduced a complimentary Sweetheart Wedding Package for up to 50 guests for eligible 2027 stays at Sandals Montego Bay, Sandals Caribbean Cay, and Sandals South Coast, the three Jamaican resorts undergoing their USD 200 million transformation. The resorts are adding upgraded accommodations, dining concepts, and wedding venues.
- July 2026: Marriott International Philippines launched its first national wedding campaign, Where Love Takes You, positioning its portfolio as wedding destinations and offering Marriott Bonvoy rewards for couples and planners.
- June 2026: The Knot Worldwide partnered with Venmo to enable guests to contribute to wedding cash funds through The Knot’s registry platform, expanding its capabilities from discovery and planning to gifting and payment workflows.
- May 2026: The Knot Worldwide launched the USD 500,000 WeddingPro Grant Program, awarding grants to 26 small wedding vendors across four tiers. The program provided advertising support and mentorship and received more than 1,170 applications.
Global Wedding Services Market Report Scope
The Global Wedding Services Market report analyzes professional services supporting wedding planning, coordination, and execution. The market is segmented by service type (Catering, Decoration and Floral, Transport, Photography and Videography, Wedding Planning, and Other Services), wedding type, booking mode, planning model, and geography. The study assesses drivers, including rising expenditure on personalized weddings, destination celebrations, digital planning tools, professional vendor coordination, and multi-event wedding travel. It also examines restraints such as declining marriage rates in mature markets, inflation in venue and service costs, vendor cancellation risks, and guest affordability pressures. The report evaluates provider networks, geographic expansion, service pricing, package structures, booking conversion, customer acquisition costs, wedding budgets, and consumer booking preferences. It provides market size and growth forecasts, regional and country-level analyses, competitive landscape assessments, market concentration, strategic developments, and profiles of hospitality groups, wedding platforms, venue marketplaces, and specialist planners. It also explores opportunities in integrated destination wedding and guest-travel platforms, AI-enabled sustainable planning, and vendor assurance. Market estimates and forecasts are presented in value (USD) across all covered segments.
Segmentation Overview
Key Questions Answered in the Report
What is the projected value of the global wedding services market by 2032?
The global wedding services market was valued at USD 238.74 billion in 2026 and is projected to reach USD 412.93 billion by 2032, growing at a 9.77% CAGR from 2027 to 2032.
Which global wedding service is the largest by revenue?
Catering Services led with a 28.73% share in 2026 because food and beverage are core requirements across wedding formats.
Which global wedding service is growing the fastest?
Decoration and Floral Services are forecast to grow at a 10.73% CAGR through 2032, supported by demand for personalized visual settings.
Which region leads the global wedding services market?
Asia-Pacific accounted for 33.92% of the global wedding services market in 2026 and is projected to grow at an 11.01% CAGR through 2032, supported by high wedding volumes and rising spending per event.
How is artificial intelligence changing wedding planning?
Artificial intelligence supports vendor search, timelines, décor ideas, and communication, with 36% of United States couples using it in 2025.
Why do couples still use offline booking?
Offline booking held a 59.62% share in 2026 because site visits, direct consultation, and family confidence remain important before making high-value commitments.