
Market Overview
| Study Period | 2020 - 2031 |
|---|---|
| Market Size (2026) | USD 5.26 Billion |
| Market Size (2031) | USD 7.32 Billion |
| Growth Rate (2026 - 2031) | 6.83 % |
| Fastest Growing Market | Asia-Pacific |
| Largest Market | North America |
| Market Concentration | Medium |
Major Players *Disclaimer: Major Players sorted in no particular order Image © Mordor Intelligence. Reuse requires attribution under CC BY 4.0. | |
Safety Instrumented System Market Analysis by Mordor Intelligence
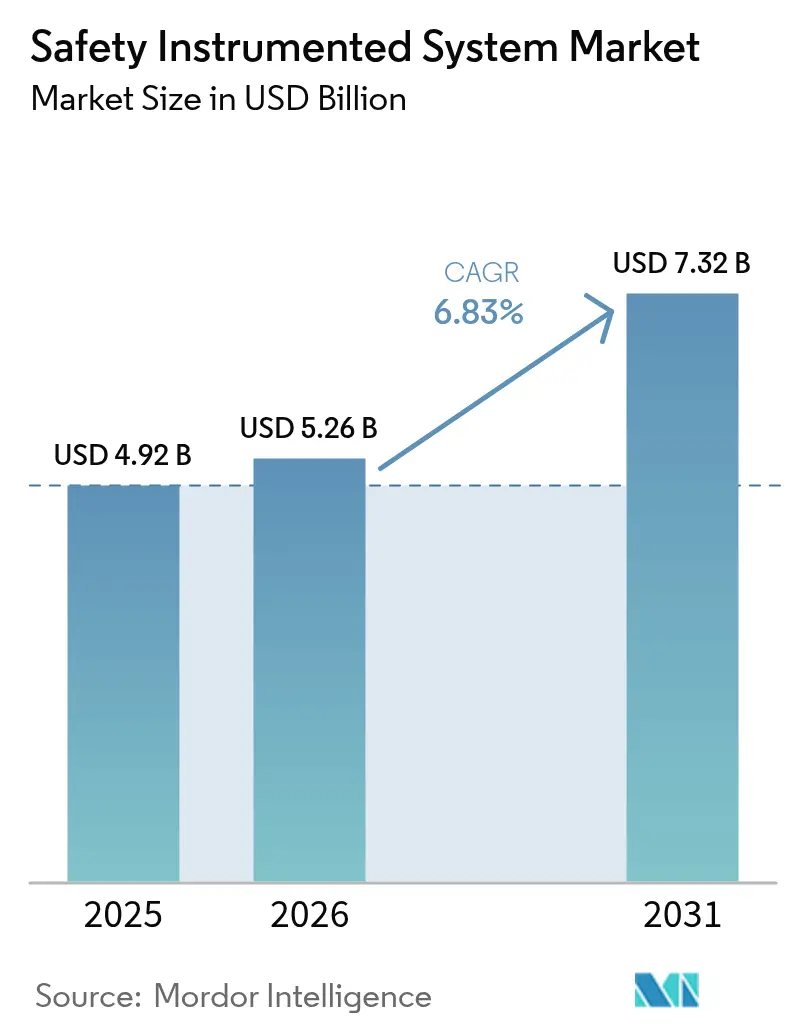
The Safety Instrumented System market size was valued at USD 4.92 billion in 2025 and estimated to grow from USD 5.26 billion in 2026 to reach USD 7.32 billion by 2031, at a CAGR of 6.83% during the forecast period (2026-2031). Escalating functional-safety regulations, rising brownfield modernization, and the surge of decarbonization projects position the Safety Instrumented System market for steady capacity additions. Operators in oil, gas, power, and chemicals view certified systems as essential insurance against single events that can incur losses of more than USD 100 million.[1] Digitalized diagnostics are shortening proof-test intervals and trimming maintenance budgets by as much as 30%, while modular “Safety-as-a-Service” offerings unlock new adoption among mid-tier facilities.[2] Competitive rivalry intensifies as niche specialists target high-pressure hydrogen and CO₂ transport with High-Integrity Pressure Protection Systems (HIPPS) capable of handling operating pressures above 1,000 bar and sustaining SIL 3 certification.
Key Report Takeaways
- By component, safety sensors held 38.10% of the safety instrumented system market share in 2025, whereas software and services is projected to post the fastest 7.11% CAGR through 2031.
- By application, emergency shutdown systems dominated with 41.30% revenue in 2025 in the safety instrumented system market, while HIPPS is forecast to expand at a 7.23% CAGR through 2031 owing to decarbonization infrastructure needs.
- By end-user, oil and gas contributed 45.92% of the safety instrumented system market size in 2025; power generation is set to grow the quickest at a 7.32% CAGR to 2031 on nuclear life-extension and grid-modernization programs.
- By service, engineering and consulting captured 34.10% share in 2025 in the safety instrumented system market, yet testing, certification and audit is seen rising at a 7.09% CAGR under stricter IEC 61511 audit cycles.
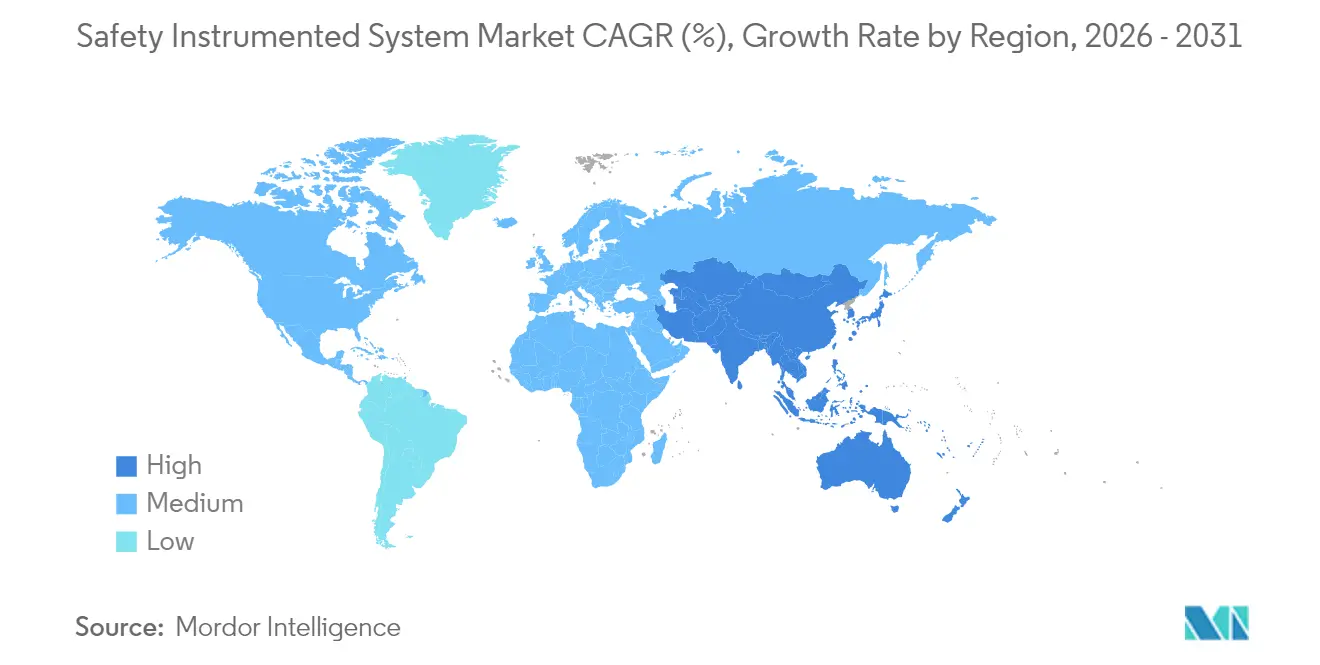
- By geography, North America led with 39.24% of 2025 revenue in the safety instrumented system market, while Asia-Pacific is the fastest-growing region at 8.13% CAGR because greenfield industrial capacity embeds certified safety from project inception.
Note: Market size and forecast figures in this report are generated using Mordor Intelligence’s proprietary estimation framework, updated with the latest available data and insights as of 2026.
Market Trends and Insights
Drivers Impact Analysis of Safety Instrumented System Market*
| Driver | (~) % Impact on CAGR Forecast | Geographic Relevance | Impact Timeline |
|---|---|---|---|
| Stricter global functional-safety regulations (IEC 61511, OSHA PSM) | +1.8% | Global, with strongest enforcement in North America and EU | Medium term (2-4 years) |
| Accelerating brown-field upgrades in oil and gas and chemicals | +1.5% | North America and Middle East core, expanding to Asia-Pacific | Short term (≤ 2 years) |
| Digitalized diagnostics and IIoT cut downtime and proof-test cost | +1.2% | Global, led by North America and Europe | Medium term (2-4 years) |
| SIL-certified cyber-secure architectures drive replacement demand | +1.0% | Global, with priority in critical infrastructure regions | Long term (≥ 4 years) |
| Modular "Safety as-a-Service" platforms for mid-tier plants | +0.8% | Asia-Pacific and emerging markets primarily | Medium term (2-4 years) |
| Decarbonization (blue-H₂, CCUS) projects require new HIPPS | +0.7% | North America, Europe, Middle East | Long term (≥ 4 years) |
| Source: Mordor Intelligence | |||
Stricter Global Functional-Safety Regulations Drive Systematic Compliance
Global enforcement of IEC 61511 and OSHA Process Safety Management elevates the Safety Instrumented System market as facilities migrate from periodic audits to continuous performance verification. Functional-safety assessments grew 40% since 2024, stretching engineering resources and elongating project lead times. Operators with legacy platforms face mandatory overhauls, creating a seller’s market for certified integrators able to commit resources and deliver turnkey upgrades within eighteen to twenty-four months. High demand also supports premium pricing for TÜV-certified components, reinforcing revenue growth momentum.
Brownfield Upgrades Accelerate as Aging Infrastructure Meets Modern Standards
The Safety Instrumented System market benefits when older refineries and chemical complexes retrofit integrated safety architectures instead of constructing new plants. Brownfield retrofits already represent 65% of projects; Gulf Coast facilities spearhead activity as insurance underwriters tie coverage to conformance with current standards. Integration engineers bridge legacy protocols with contemporary Safety PLCs, often shrinking retrofit payback to less than four years by combining incident-risk mitigation with downtime reduction.[3]
Digitalized Diagnostics Transform Proof-Testing Economics
Continuous device health monitoring backed by machine learning permits condition-based maintenance. Operators reduce unplanned outages by up to 35% and triple proof-test intervals without lowering SIL ratings. The outcome lowers annual lifecycle cost by 25% and redirects scarce plant labor toward higher-value tasks. Predictive insight also limits false trips that in hydrocarbon processing can cost USD 100,000-500,000 in lost output per event, reinforcing the business case for advanced analytics.
SIL-Certified Cyber-Secure Architectures Address New Threats
Cybersecurity is now integral to functional safety. Updated frameworks stipulate authenticated remote access, encrypted safety logic transfer, and anomaly detection algorithms that flag unsafe code revisions. Vendors partner with OT security specialists to embed threat-mitigation functions that preserve SIL certification. The trend stimulates retrofit demand because equipment installed before 2018 cannot meet current cyber-secure requirements without hardware replacement.
Restraints Impact Analysis of Safety Instrumented System Market*
| Restraint | (~) % Impact on CAGR Forecast | Geographic Relevance | Impact Timeline |
|---|---|---|---|
| High capex and lifecycle maintenance cost | -1.2% | Global, particularly impacting mid-tier operators | Short term (≤ 2 years) |
| Legacy-system integration complexity | -0.8% | North America and Europe with aging infrastructure | Medium term (2-4 years) |
| Shortage of TÜV/CFSE-certified safety engineers | -0.6% | Global, most acute in Asia-Pacific and emerging markets | Medium term (2-4 years) |
| SIL-grade component supply-chain constraints | -0.4% | Global, with regional variations in component availability | Short term (≤ 2 years) |
| Source: Mordor Intelligence | |||
High Capital and Lifecycle Costs Challenge Mid-Tier Adoption
Full-facility deployments range from USD 5 million to USD 15 million, a hurdle for mid-size operators. Annual upkeep absorbs 15-20% of initial cost, covering proof-testing, component swaps, and software patches. Capital scarcity in emerging markets hampers replacement planning despite mounting compliance pressure. “Safety-as-a-Service” subscription schemes now spread capital across multi-year operating budgets, yet financing options remain limited, especially where local lenders assign high risk premiums.
Legacy-System Integration Complexity Extends Timelines and Budgets
Proprietary fieldbus protocols and mixed-vendor architectures require custom gateways that double engineering hours for brownfield work. Shortage of integration engineers proficient in both decades-old platforms and contemporary Safety PLCs inflates labor rates 20-30%. Project slippage risks compound if replacement windows coincide with peak demand seasons, pushing some operators to stage phased upgrades that stretch over several budget cycles.
*Our forecasts treat driver/restraint impacts as directional, not additive. The impact forecasts reflect baseline growth, mix effects, and variable interactions.
Safety Instrumented System Market Segment Analysis
By Component:
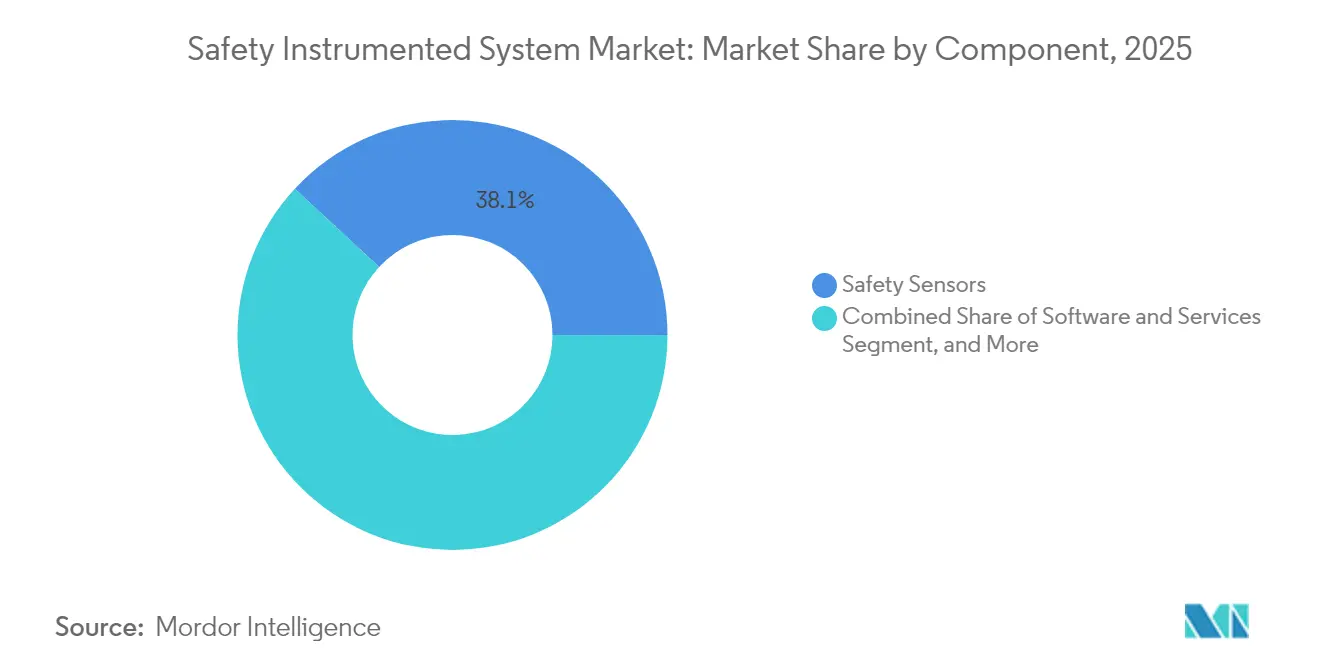
Software and Services Catalyze Predictive AnalyticsSoftware and Services recorded the fastest 7.11% CAGR because cloud analytics, machine learning, and virtual-commissioning tools unlock fresh value streams. The Safety Instrumented System market size for Software and Services is projected to climb from USD 1.27 billion in 2025 to USD 1.91 billion by 2031. AI-enhanced platforms distinguish genuine process excursions from noise, cutting nuisance trips by 50% and conserving production. Sensors retain a 38.10% revenue lead, yet the market pivots toward data-centric offerings that complement hardware with actionable insight.
Logic Solvers and Safety PLCs grow at a steady clip, buoyed by rising demand for high-pressure and high-speed applications. Final Elements leverage smart actuators providing continuous feedback, strengthening proof-test coverage. Vendors bundle sensors with subscription analytics, shifting revenue toward recurring models and reinforcing stickiness among installed-base customers.

By Application:
HIPPS Surges on Hydrogen and CO2 InfrastructureEmergency Shutdown retains 41.30% share in 2025, yet HIPPS experiences the highest 7.23% CAGR. Hydrogen pipelines and blue-ammonia export terminals require HIPPS capable of 2 second closure under 1,000 bar pressure. The Safety Instrumented System market size attached to HIPPS is forecast to almost double by 2030 as governments allocate record hydrogen incentives. Fire and Gas monitoring accelerates on stricter emissions controls, introducing multi-spectrum detectors that reduce false alarms. Burner Management Systems and Turbomachinery Control integrate with plant-wide safety layers, enabling coordinated shutdown to avert cascading failures.
By End-User Industry:
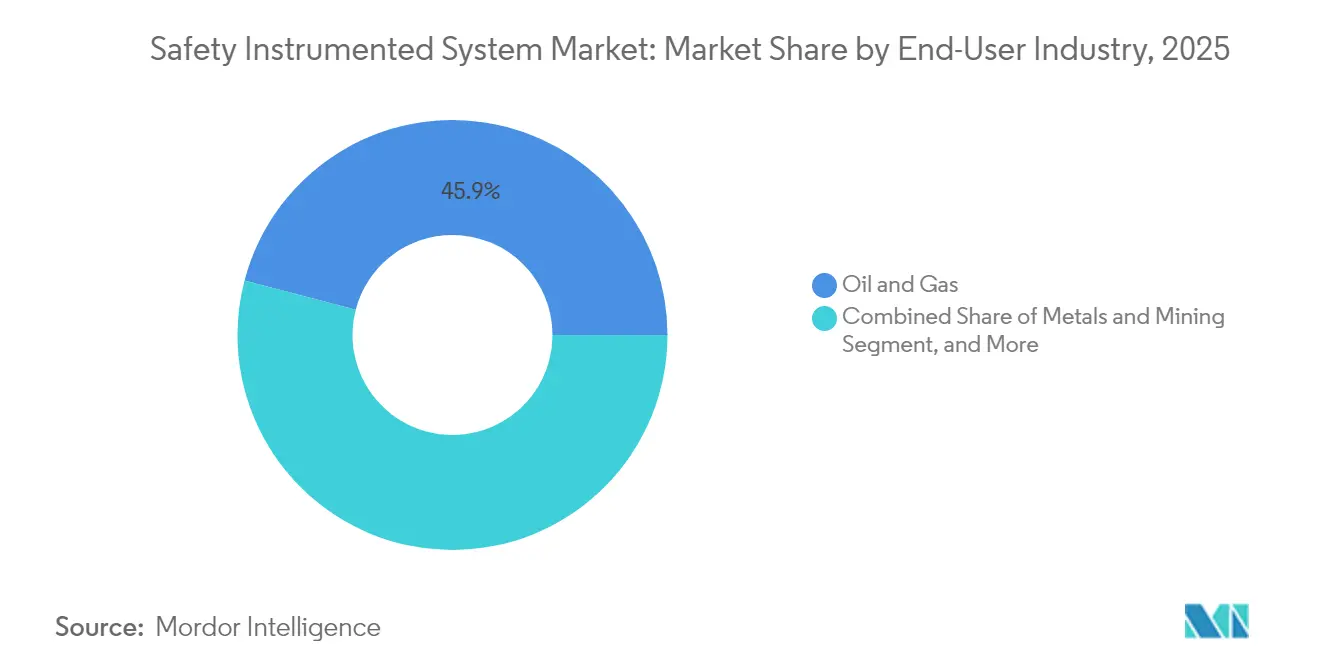
Power Generation Outpaces as Grids ModernizeOil and gas dominated 45.92% of 2025 revenue, propelled by offshore platform mandates after well-publicized disasters. Power generation exhibits a 7.32% CAGR because nuclear life-extension, combined-cycle plant upgrades, and synchronous condenser retrofits require new certified safety layers. The Safety Instrumented System market share is set to rebalance modestly toward power by 2031, aided by renewable integration that adds volatility and amplifies protection needs. Chemicals, pharmaceuticals, and water utilities adopt predictive diagnostics to align with strict product-quality and environmental standards while curbing operating expense.
By Service:
Testing and Certification Escalates Under IEC 61511 CyclesEngineering and Consulting held 34.10% in 2025, yet Testing, Certification and Audit registers the quickest 7.09% CAGR. Recertification intervals tighten as regulators mandate ongoing proof of performance, elevating demand for TUV, Exida, and CSA audits. Remote sensor validation and cybersecurity penetration tests gain prominence in integrated service contracts. Predictive analytics platforms funnel device health logs into certification portals, reducing manual document handling and shortening compliance cycles.
Geography Analysis
North America Safety Instrumented System Market
North America generated 39.24% of 2025 revenue on the back of OSHA Process Safety Management rigor and Gulf Coast brownfield programs. The United States alone houses more than 3,000 newly certified functional-safety engineers every year, sustaining a robust project pipeline. Operators focus on analytics upgrades, integrating cloud dashboards that visualize safety metrics for executive leadership. Canada’s upstream LNG terminals invest in SIL 3 HIPPS to safeguard high-pressure pipelines.
Europe Safety Instrumented System Market
Europe follows with sizeable share under SEVESO III and the push for digital sovereignty that embeds cybersecurity into functional safety. Refiners in Germany and the Netherlands add predictive proof-testing to optimize turnarounds. Offshore North Sea platforms retrofit common-asset safety suites monitored from onshore control centers, shrinking field labor requirements.
APAC Safety Instrumented System Market
Asia-Pacific is the fastest-growing territory at 8.13% CAGR. China and India commission large chemical parks with integrated safety from day one, bypassing legacy barriers. Government hydrogen roadmaps fast-track HIPPS spending, while Southeast Asian petrochemical hubs adopt modular Safety-as-a-Service to cap upfront capital. Australia’s mining sector deploys AI-based diagnostics to balance extreme uptime demands with worker-safety mandates.
MEA and South America Safety Instrumented System Market
The Middle East and Africa channel petro-revenues into high-spec refineries, often engaging international licensors that include certified safety as part of engineering packages. South America shows rising activity within mining and biofuels as operators align with stricter environmental standards and insurer expectations.
Regulatory Landscape
Functional safety compliance for process plants continues to be anchored by IEC 61511 and its national adoptions, including ANSI/ISA-61511/ISA-84 in the United States. In July 2026, IEC published the IEC 61511:2026 series for safety instrumented systems in the process industry, reinforcing lifecycle obligations around hazard and risk assessment, SIL verification, proof testing, and management of change. In the United States, OSHA Process Safety Management (29 CFR 1910.119) is frequently applied using RAGAGEP expectations that reference recognized industry standards such as IEC 61511/ANSI/ISA-61511, supporting demand for TÜV/Exida/CSA-certified components and auditable SIS lifecycle documentation.
Regulatory and standards activity outside traditional process safety bodies is also influencing SIS requirements where digital technologies and software are used in safety functions. The EU Machinery Regulation (EU) 2023/1230 applies from January 20, 2027 and updates essential health and safety requirements for machinery incorporating digital technologies, including aspects relevant to safety-related control and software. In China, GB/T 21109.3-2026 (issued January 28, 2026, implemented August 1, 2026) adds a national standards layer for SIS that increasingly mirrors IEC frameworks, shaping design documentation, local project acceptance, and the validation workload for multinational operators and EPCs executing projects in-country.
Value Chain Analysis
The SIS value chain starts with certified hardware, including safety sensors, transmitters/flowmeters, safety PLCs/logic solvers, and final elements such as valves and solenoids. These are supported by embedded diagnostics, safety application software, and cybersecurity-hardening tools. Component suppliers and system vendors maintain functional-safety certification libraries, commonly through TÜV SÜD, TÜV Rheinland, Exida, or CSA programs, while OEMs and automation majors bundle devices into integrated control and safety systems (ICSS).
Engineering and consulting, system integration, and lifecycle services, such as proof testing, periodic functional safety assessments, recertification audits, and training, form a large downstream services layer, with end users and insurers driving documentation rigor under IEC 61511 lifecycle expectations. Project execution and aftermarket pull-through increasingly run through large EPC-led capital programs and owner-operator modernization packages, where Main Automation Contractor (MAC) roles concentrate procurement and integration responsibility. In July 2026, Yokogawa was selected as MAC for the USD 13 billion Commonwealth LNG project in Louisiana, illustrating how SIS demand is often packaged with DCS, fire and gas, cybersecurity, and commissioning services under single-vendor or prime-contractor delivery. Upstream of delivery, standards evolution expands verification steps for software content, and cybersecurity tooling is being pulled into the automation stack, such as Emerson's April 2026 reseller agreement with OPSWAT to integrate OT patch management into the Ovation platform, tightening the linkage between SIS lifecycle management, OT security operations, and plant maintenance workflows.
Competitive Landscape
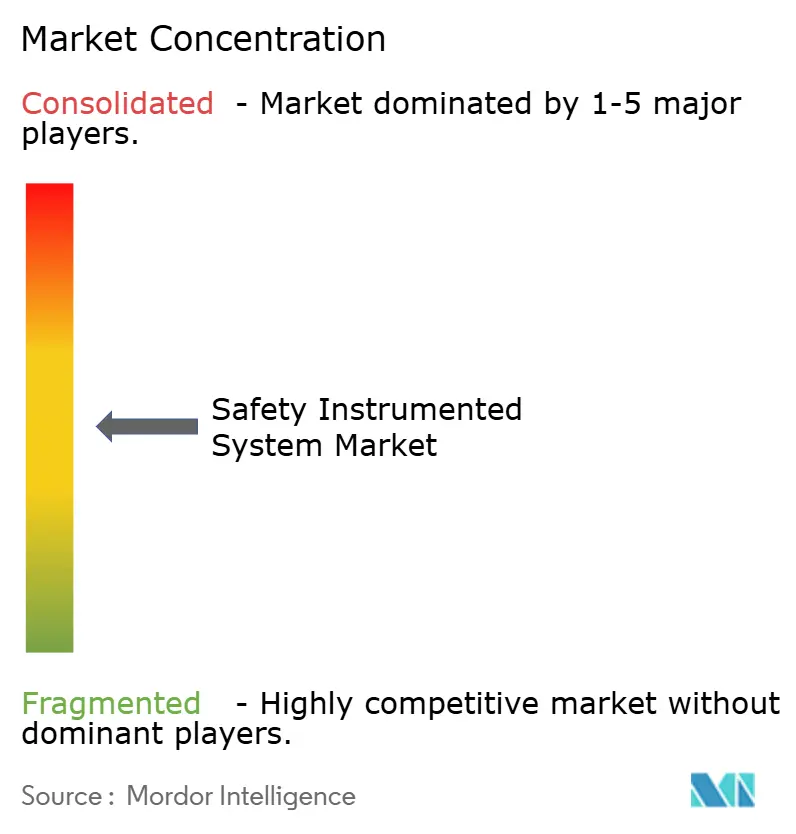
The Safety Instrumented System market is moderately consolidated. Five global automation majors account for more than two-thirds of revenue, leveraging cross-portfolio breadth, global service hubs, and extensive TÜV-certification libraries. Honeywell, ABB, Siemens, Emerson, and Schneider Electric differentiate through integrated platforms that marry sensors, logic solvers, and analytics. Software has emerged as the new battleground. Rockwell Automation introduced its Logix SIS controller in January 2025 with embedded machine learning that shrinks proof-test intervals to 18 months without compromising SIL 3 status.
Specialists pursue white-space by focusing on modular cloud architectures that suit mid-tier plants. Vendors such as Nozomi Networks weave cybersecurity into safety diagnostics to address converging threats. Sensor manufacturers partner with safety-system suppliers, evidenced by the SICK and Endress+Hauser collaboration initiated in 2024 to blend field instrumentation with certified logic environments. Acquisitions continue as strategy: Halma bought Global Fire Equipment and MK Test Systems to reinforce fire, gas, and testing coverage, while MSA Safety acquired M&C TechGroup to deepen gas analysis know-how.
Pricing pressure exists, yet life-cycle support contracts and subscription analytics defend margins. Suppliers embed proprietary analytics engines that interpret sensor health and event signatures, thereby locking in clients for multiyear service agreements and creating annuity streams.
Safety Instrumented System Industry Leaders
-
Rockwell Automation Inc.
-
Emerson Electric Company
-
Honeywell International Inc.
-
Yokogawa Electric Corporation
-
ABB Ltd.
- *Disclaimer: Major Players sorted in no particular order
Safety Instrumented System Market Companies Covered in this Report
- ABB Ltd.
- Baker Hughes Co.
- Emerson Electric Co.
- General Electric Co.
- HIMA Paul Hildebrandt GmbH and Co KG
- Honeywell International Inc.
- Johnson Controls International plc (Tyco Fire and Security)
- Mangan Inc.
- Mitsubishi Electric Corp.
- Moore Industries-International, Inc.
- Omron Corp.
- Pepperl+Fuchs SE
- Pilz GmbH and Co. KG
- Proserv Controls LLC
- Rockwell Automation Inc.
- Rotork plc
- Schneider Electric SE
- Schlumberger NV
- Siemens AG
- SIS-TECH Solutions LP
- Valmet Oyj
- Yokogawa Electric Corp.
Market Opportunities and Future Outlook
Auditability of software and data-driven functions is emerging as a practical whitespace for SIS suppliers and service providers. The publication of IEC 61511-3:2026 (May 2026) and the IEC 61511:2026 series (July 2026) elevates the need for lifecycle tooling that supports third-party audits, including traceable configuration management, test evidence capture, and explainable diagnostics workflows. That requirement creates room for software and services that reduce compliance workload, particularly in brownfield environments where integration complexity and limited TÜV-certified engineering capacity stretch upgrade timelines.
Large greenfield and decarbonization-linked projects are also translating into integrated control-and-safety scope awards, pulling SIS into bundled ICSS contracts and long-term service agreements. Examples include Yokogawa's MAC award for the USD 13 billion Commonwealth LNG project in Louisiana (July 2026) and the use of independent functional safety assessments at Chevron Phillips Chemicals USD 8.5 billion Golden Triangle ethylene project. On the hardware side, incremental opportunities come from expanding the pool of certified devices for safety loops, illustrated by ABB's SensyMaster FMT400 flowmeter receiving SIL 2 certification from TÜV SÜD (June 2026). That development supports broader substitution of smart instrumentation into safety-critical applications and creates follow-on demand for validation, proof-test optimization, and spares management services.
Recent Industry Developments in Safety Instrumented System Market
- July 2026: Rockwell Automation published a case study on a gas terminal project that unified safety instrumented systems with process control and fire and gas systems as part of an export capacity expansion to 5 Mtpa. The project reflects continued end-user preference for integrated architectures that reduce operational silos and streamline alarm, event, and maintenance workflows across safety layers.
- December 2025: Honeywell was selected to supply integrated automation systems, including control and safety systems, for the Net Zero Teesside Power and Northern Endurance Partnership projects in the United Kingdom. The award ties SIS scope to large-scale CCUS-linked infrastructure programs, reinforcing demand for certified safety platforms with long lifecycle support and cybersecurity alignment.
- June 2024: Endress+Hauser and SICK initiated a collaboration to blend field instrumentation and sensing capabilities with certified logic and safety environments. The collaboration supports tighter interoperability between measurement devices and SIS platforms, improving diagnostics coverage and simplifying proof-testing and documentation across multi-vendor installations.
Safety Instrumented System Market Report Scope and Research Methodology
Market Definition and Coverage
This market covers safety instrumented systems used to detect abnormal operating conditions and move industrial processes to a safe state through sensors, logic solvers, and final control elements, along with related software and services, where they are deployed in process and discrete environments.
Scope exclusions: We exclude general-purpose basic process control systems, standard industrial automation hardware that is not used for a safety function, and on-site incident response services that do not change process risk through SIS actions.
Segments Covered in This Report
- By Component
- Safety Sensors
- Logic Solvers / Safety PLCs
- Final Elements (Valves, Actuators, Solenoids)
- Software and Services
- By Application
- Emergency Shutdown Systems (ESD)
- Fire and Gas Monitoring and Control (FandG)
- High-Integrity Pressure Protection Systems (HIPPS)
- Burner Management Systems (BMS)
- Turbomachinery Control (TMC)
- By End-User Industry
- Oil and Gas
- Chemicals and Petrochemicals
- Power Generation (incl. Nuclear and Renewables)
- Pharmaceuticals and Life Sciences
- Food and Beverage
- Metals and Mining
- Water and Wastewater
- Other End-User Industries
- By Service
- Engineering and Consulting
- Integration and Installation
- Testing, Certification and Audit
- Maintenance and Training
- By Geography
- North America
- South America
- Europe
- Asia-Pacific
- Middle East and Africa
Data Sources, Market Sizing, and Validation
Desk Research
Desk research started with public safety and standards references to keep definitions consistent, then moved into demand signals linked to process industries. We used items such as IEC functional safety standards references, OSHA process safety materials, the US EIA for energy and refining indicators, Eurostat for industrial production series, and the IEA for longer-run energy transition context that affects new projects and retrofits.
We also reviewed public company filings, investor presentations, and press releases on project wins and expansions, plus industry association content that discusses safety compliance trends and turnaround cycles. To fill in gaps around financial benchmarks and time-stamped deal activity, we relied on paid subscriptions focused on company financials and intelligence, news and financials, patent databases, and global contracts and tenders. These desk sources are not exhaustive, and many other public materials were used during data collection, validation, and research clarification.
Primary Interviews and Surveys
Primary interviews and surveys were used to pressure-test desk assumptions, especially the typical project mix (new builds versus upgrades), service attach rates, and pricing behavior linked to safety integrity requirements. We spoke with respondents across end users, system integrators, and component and solution providers, with balanced coverage across APAC, EMEA, and the Americas so regional capex cycles and compliance patterns are reflected in the final model.
Distribution of primary research fieldwork respondents
| Company type | Respondent position | Region |
|---|---|---|
| Top tier: 34% | CXOs: 13% | APAC: 45% |
| Mid tier: 48% | Functional/Unit leaders: 35% | EMEA: 36% |
| Smaller Players: 18% | Managers: 52% | Americas: 19% |
Market-Sizing & Forecasting
Sizing was built from a top-down demand pool view where industrial capex and operating safety spend indicators were translated into SIS adoption across high-risk assets. We then split the totals into hardware, software, and services using mix assumptions gathered from interviews.
To sanity-check the results, we ran selective bottom-up approximations such as sampled average selling prices multiplied by expected unit volumes for logic solvers, sensors, and final elements, then used channel and integrator checks to adjust shares where needed.
Key inputs that shaped the model included process industry project starts and brownfield modernization rates, refinery and chemical capacity additions, turnaround and maintenance cycles, safety compliance and audit activity, and the share of sites moving toward higher integrity protection architectures. For pricing, we used an ASP progression approach that distinguishes between new system installations, partial upgrades, and recurring services, because ticket size and mix behave differently across those cases. Forecasts were developed using scenario analysis supported by expert views on capex timing, energy and chemical expansion cycles, and the pace of safety upgrades, and then consolidated into a single base-case outlook.
Where bottom-up signals were incomplete by region or end use, gaps were handled through proxy ratios anchored to verified asset counts and investment series, and then re-checked with primary feedback so the final totals stayed realistic.
Data Validation & Update Cycle
Validation was done in several steps so the final outputs matched real-world signals. Model results were compared against independent indicators like industrial production direction, major project timing, and safety-driven retrofit activity, and any unusual jumps were traced back to a specific assumption before being accepted.
Before sign-off, the work is reviewed by another analyst who checks arithmetic, scope boundaries, and whether regional shares align with the supporting evidence. Reports are refreshed annually, and interim updates are added when material events occur, such as major project delays, policy shifts, or a clear change in pricing direction. Right before delivery, a fresh pass is completed so clients receive the latest updated view.
Mordor Intelligence's Global Safety Instrumented Systems Market Size Compared With Other Published Estimates
Published SIS market values can vary even when they look similar at first glance, because the year used for currency conversion, the way services are counted, and the pricing path assumed for upgrades versus new systems are not consistent across studies. We read other estimates as directional checks, and we focus on what is actually being counted and when it is being measured.
A refresh-led gap shows up when older ASP assumptions are carried forward after a change in component pricing or project timing, or when the currency window is not aligned to the same calendar year for global rollups. By updating the FX timing and re-validating upgrade-heavy pricing (where services and engineering often take a larger share), Mordor Intelligence keeps the 2026 number tied to current installation and maintenance behaviors rather than legacy price decks.
Benchmark comparison
| Source | Market Size | Gaps in Research Methodology |
|---|---|---|
| Mordor Intelligence | USD 5.26 B (2026) | |
| Global Consultancy A | USD 5.10 B (2024) | Uses a 2024 base and a process-automation framing, which can shift what is counted as SIS versus adjacent control and instrumentation bundles, and it may also keep earlier-year pricing mixes for upgrades when service attach rates change. |
| Regional Consultancy B | USD 4.90 B (2024) | Anchors the market in 2024 and may apply broader product groupings that blend SIS product families and components differently, which can move totals down when services, testing, and certification activities are treated as optional or outside scope. |
The spread in published values is mostly explained by timing and modeling choices rather than a true disagreement on demand direction. When currency timing, upgrade versus new-build pricing, and the service boundary are stated clearly and re-checked with field inputs, the market total becomes easier to trace, repeat, and use for planning.
Key Questions Answered in the Report
How large will global demand for certified safety systems be by 2031?
The Safety Instrumented System market is forecast to climb to USD 7.32 billion by 2031, reflecting a 6.83% CAGR over 2026-2031.
Which segment shows the fastest sales momentum?
High-Integrity Pressure Protection Systems post a 7.23% CAGR as hydrogen and carbon-capture infrastructures proliferate.
Why are Software and Services growing faster than hardware?
AI-driven diagnostics slash maintenance cost and shrink proof-test intervals, prompting users to invest in subscription analytics that enhance existing hardware.
What drives expansion in power generation applications?
Nuclear life-extension projects and grid-modernization efforts that integrate renewables require upgraded functional-safety layers with cyber-secure connectivity.
Which region leads in installed base upgrades?
North America commands nearly 39.24% of 2025 revenue thanks to OSHA regulation and Gulf Coast brownfield spending.