
E-Visa Market Size and Share
Market Overview
| Study Period | 2022 - 2032 |
|---|---|
| Market Size (2027) | USD 1.43 Billion |
| Market Size (2032) | USD 2.12 Billion |
| Growth Rate (2027 - 2032) | 8.19 % |
| Fastest Growing Market | Asia-Pacific |
| Largest Market | North America |
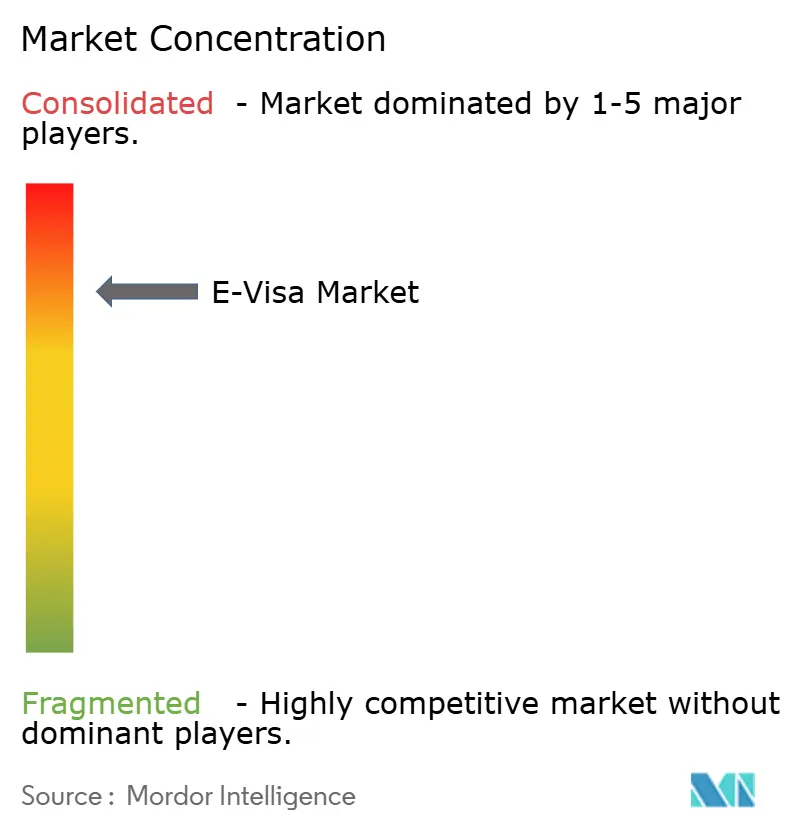
| Market Concentration | High |
Major Players *Disclaimer: Major Players sorted in no particular order Image © Mordor Intelligence. Reuse requires attribution under CC BY 4.0. | |
E-Visa Market Analysis by Mordor Intelligence
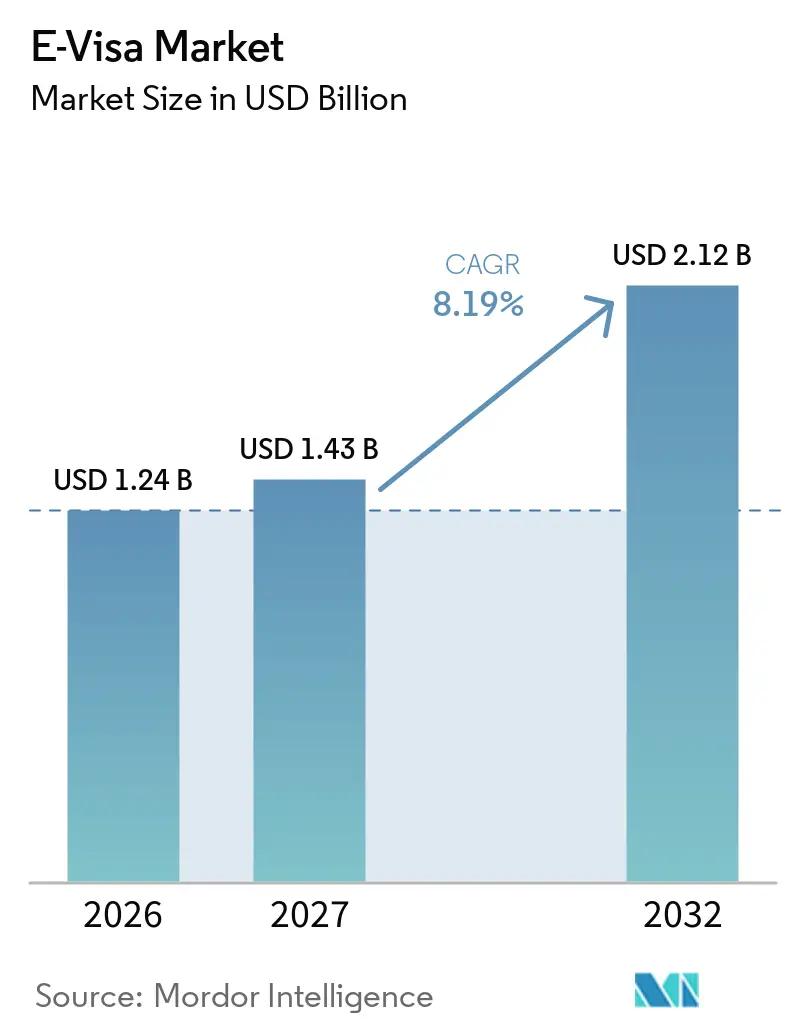
The global e-visa market size was valued at USD 1.24 billion in 2026 and is estimated to grow from USD 1.43 billion in 2027 to reach USD 2.12 billion by 2032, at a CAGR of 8.19% during the forecast period (2027-2032). Governments are driving the global e-visa market by shifting visa applications from paper forms and physical counters to digital platforms. International tourist arrivals reached 1.52 billion in 2025, expanding the pool of travelers requiring entry clearance before departure. Governments are also integrating digital visa systems into broader border modernization programs, particularly those involving biometric checks and risk screening. Large national programs illustrate this transition, such as India’s e-visa framework covering 172 nationalities across 13 subcategories. The market offers opportunities for secure application portals, biometric verification, payment systems, and interfaces connecting visa databases with border control systems.
Key Report Takeaways
- By application type, Multiple-Entry Visa accounted for 55.41% of the global e-visa market share in 2026 and is projected to grow at an 8.78% CAGR through 2032.
- By application, Tourism and Leisure Travel accounted for 65.74% of the global e-visa market in 2026, while Medical Travel is projected to grow at an 8.91% CAGR through 2032.
- By processing time, Standard Processing accounted for 74.91% of the global e-visa market in 2026, while Expedited Processing is projected to grow at a 9.56% CAGR through 2032.
- By geography, North America accounted for 34.85% of the global e-visa market in 2026, while Asia-Pacific is projected to grow at a 9.25% CAGR through 2032.
Note: Market numbers in this report are based on Mordor Intelligence's proprietary estimation framework, which combines nine months of actuals with Q4 projections for base year 2026.
Market Trends and Insights
Drivers Impact Analysis of E-Visa Market*
| Driver | (~) % Impact on CAGR Forecast | Geographic Relevance | Impact Timeline |
|---|---|---|---|
| International Travel and Cross-Border Mobility Recovery | +1.8% | Global, led by Europe and the Asia-Pacific rebound | Short term (≤ 2 years) |
| Government Digitalization and Paperless Immigration Mandates | +1.5% | Global, with early concentration in Europe, South Asia, and Sub-Saharan Africa | Medium term (2-4 years) |
| Expansion of Tourism, Business, Education, and Skilled-Migration Flows | +1.3% | Global, led by South Asia outbound and Gulf inbound corridors | Short term (≤ 2 years) |
| Mobile-First Visa Application and Payment Adoption | +1.0% | Asia-Pacific, with spillover to the Middle East and Africa and South America | Medium term (2-4 years) |
| Biometric Identity Verification and Fraud-Prevention Requirements | +0.9% | North America and Europe, with spillover to Asia-Pacific and the Middle East and Africa | Medium term (2-4 years) |
| Interoperable Digital Border Infrastructure and API-Based Processing | +0.7% | Europe and selected Asia-Pacific economies, with gradual global adoption | Long term (≥ 4 years) |
| Source: Mordor Intelligence | |||
International Travel and Cross-Border Mobility Recovery
The recovery in international travel increased demand for accessible, scalable visa-processing services. UN Tourism recorded 1.52 billion international tourist arrivals in 2025, up 4% year on year. Arrivals in Asia-Pacific grew 6%, while Northeast Asia recorded 13% growth. Digital adoption also advanced, with e-visas accounting for 82% of visa applications by Indian travelers in 2025, compared with 79% in 2024, according to Atlys. Governments expanded online application infrastructure. Germany launched its Consular Services Portal across 167 visa sections on January 1, 2025, covering 28 national visa categories[1]. Vietnam’s official e-visa portal supports online applications, payments, and result tracking, while India offers electronic visas for tourism, business, medical, student, and other eligible categories. These developments created opportunities for secure application portals, document verification, payment integration, and status-tracking services, particularly when seasonal demand strained processing capacity.
Expansion of Tourism, Business, Education, and Skilled-Migration Flows
Tourism remains a key driver of visa demand, alongside business, education, employment, and medical travel. Germany’s digital national visa services support online applications for employment, study, training, and family reunification. India’s digital visa framework includes e-Medical and e-Medical Attendant categories. Government data recorded 1.75 million Medical Visa and Medical Visa (E) holders between January 2023 and December 2025, along with 56,908 Medical Attendant and Medical Attendant (E) visa holders[2]. These categories require predictable processing timelines because travel often depends on enrollment dates, employment start dates, and scheduled medical treatment. The global e-visa market may benefit from category-specific documentation, transparent eligibility criteria, and streamlined pathways for repeat travelers.
Mobile-First Visa Application and Payment Adoption
Mobile application journeys are reshaping how travelers submit documents, pay fees, and receive entry approvals. SITA reported in 2025 that nearly 80% of air passengers were ready to store their passports on their phones. This shift makes smartphone-based visa journeys more practical for applicants who prefer not to visit a processing center. Australia expanded its IMMI App to additional countries in 2025, enabling eligible users to submit biometric information through their smartphones. E-visas accounted for 82% of visa applications by Indian outbound travelers in 2025, supporting this trend, supporting this trend. Payment options remain important, as card-only portals may exclude users who rely on regional digital wallets or bank transfers.
Biometric Identity Verification and Fraud-Prevention Requirements
Biometric verification has become a standard requirement in government border management programs. In October 2025, the United States Department of Homeland Security issued a final rule expanding facial biometric collection for noncitizens at air, land, and sea entry and exit points. In May 2025, the European Union operationalized the Shared Biometric Matching Service (sBMS) and upgraded the Visa Information System. These initiatives increased demand for secure capture devices, liveness detection solutions, matching software, and interoperable records. They also favored suppliers that meet government security and certification requirements. In the global e-visa market, biometric capabilities have become a core technical requirement rather than an optional add-on.
Restraints Impact Analysis of E-Visa Market*
| Restraint | (~) % Impact on CAGR Forecast | Geographic Relevance | Impact Timeline |
|---|---|---|---|
| Data Privacy, Cybersecurity, and Sovereignty Requirements | -1.0% | Global, with the highest regulatory intensity in Europe, the United Kingdom, and Southeast Asia | Medium term (2-4 years) |
| Uneven Digital Access, Payment Trust, and User Authentication Readiness | -0.7% | Sub-Saharan Africa, rural South Asia, and parts of South America | Long term (≥ 4 years) |
| Fragmented National Rules and Limited Interoperability Across Visa Systems | -0.5% | Global, most acute in the Middle East and Africa and South America | Long term (≥ 4 years) |
| Government Procurement Barriers and Dependence on Established Operators | -0.4% | North America, Europe, and Gulf states | Medium term (2-4 years) |
| Source: Mordor Intelligence | |||
Data Privacy, Cybersecurity, and Sovereignty Requirements
Data protection is a direct operational risk because e-visa systems store passport, biometric, identity, and travel data. In November 2025, a breach of Somalia’s e-visa platform exposed personal data for at least 35,000 applicants, according to a security alert from the U.S. Embassy in Mogadishu[3]. Such incidents can reduce applicant trust and increase scrutiny of government contractors. They highlight the need for secure system design, access controls, incident response capabilities, and documented data-handling practices. Governments in Asia-Pacific and the Middle East and Africa may prefer sovereign or locally controlled deployments, which could limit the use of globally standardized platforms. The global e-visa market must meet these requirements while maintaining simple application processes for legitimate travelers.
Uneven Digital Access, Payment Trust, and User Authentication Readiness
Digital-only services may exclude applicants who lack reliable internet access, compatible smartphones, or confidence in online payments. These constraints are particularly relevant in rural South Asia, Sub-Saharan Africa, and parts of South America. Applicants in these areas may rely on mobile money, direct transfers, or assisted channels instead of international card payments. Smartphone-based biometric submissions may fail because of poor camera quality, slow network speeds, or limited digital literacy. These issues can cause repeat submissions and increase processing costs for applicants and authorities. The global e-visa market requires accessible payment options and clear assisted pathways when self-service authentication is impractical.
*Our forecasts treat driver/restraint impacts as directional, not additive. The impact forecasts reflect baseline growth, mix effects, and variable interactions.
Traveler Behavior & E-Visa Trends
SITA’s 2025 survey of 7,500 passengers across 25 countries found that 79% were willing to use digital identities on smartphones, up from 75% in 2024, while 78% preferred smartphones that combine digital wallets, passports, and loyalty cards. These findings indicate growing demand for mobile-first travel. Visa platforms can offer mobile document uploads, application-status updates, trusted payment options, and accessible support.
UN Tourism’s Tourism Visa Openness Report found that the share of the global population eligible for e-visas rose from 3% in 2013 to 18% in 2023, while the share requiring traditional visas declined from 77% in 2008 to 47% in 2023. Providers can offer document assistance and expedited processing where officially available, while governments retain control over eligibility and approvals.
E-Visa Performance Intelligence
The European Union and Schengen-associated countries received 11.7 million short-stay visa applications in 2024, up 13.6% year over year. Authorities issued more than 9.7 million visas, and the refusal rate was 14.8%. In 2025, New Zealand decided on more than 470,000 visitor visa applications and approved 89%. These data show the need to assess application throughput, approval rates, and refusals separately across destinations.
Category-specific data can identify processing bottlenecks and distinguish demand growth from changes in decision outcomes. New Zealand issued more than 1.6 million New Zealand Electronic Travel Authority (NZeTA) requests in 2025. Australia received 9.5 million migration and temporary visa applications in 2024–25 and finalized 9.45 million applications. As these figures cover electronic travel authorizations and visa applications, they are not directly comparable. Tracking issuance volumes, decision throughput, and processing times separately helps governments assess service capacity and operational consistency without duplicating infrastructure or traveler behavior analysis.
E-Visa Market Segment Analysis
By Application Type:
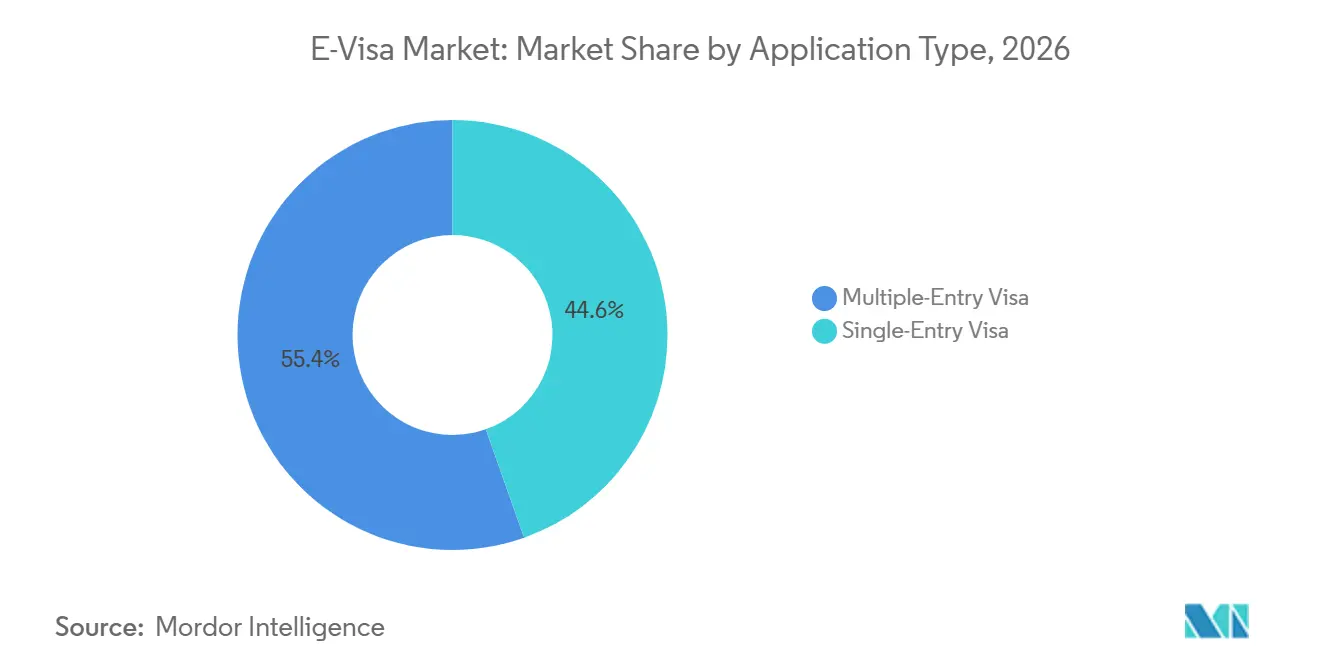
Multiple-Entry Visas Support Repeat TravelMultiple-entry visas accounted for 55.41% of the global e-visa market in 2026 and are projected to grow at an 8.78% CAGR through 2032. They serve frequent business travelers, skilled migrants, and repeat visitors. India offers multi-entry e-Medical visas for planned treatment travel. Kenya announced a multiple-entry Electronic Travel Authorization for cruise passengers in February 2025. Processing may require extended validity checks and detailed eligibility reviews.
Single-entry visas hold a 44.59% share in 2026 and remain relevant for first-time visitors, one-time medical travel, and destinations with simpler digital programs. They support travel limited to one journey. Platforms must clearly present rules for one-time and repeat visitors and address post-approval plan changes or documentation needs for later travel. Clear visa terms, permitted stays, and re-entry rights before payment and submission benefit the global e-visa market.
By Application:
Tourism Leads While Medical Travel Grows FasterTourism and leisure travel accounted for 65.74% of the global e-visa market size in 2026. This category has the broadest applicant base, as many destinations design entry systems primarily for short-stay visitors. Strong international arrivals in 2025 supported continued demand. Most e-visa programs include dedicated tourism categories. Seasonal application peaks also require stable system capacity[4].
Medical travel is forecast to grow at a CAGR of 8.91% through 2032, the highest among application categories. Treatment-related travel requires advance digital authorization, and the e-Medical Attendant category accommodates patients traveling with caregivers. Education, business, government, and other specialized applications also require category-specific processing. Reliable documentation workflows are essential, as approval delays can disrupt treatment, admission, or work plans.
By Processing Time:
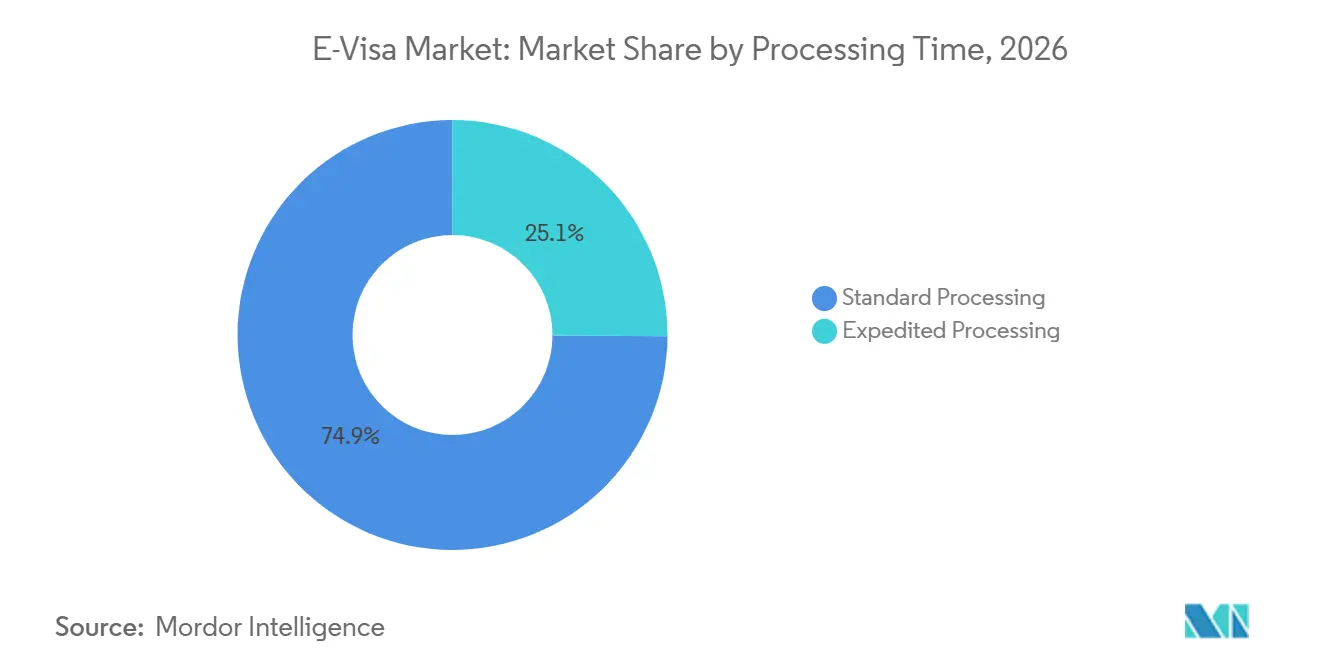
Standard Processing Is the Main Volume TierStandard Processing accounted for 74.91% of the market in 2026 and remains the primary option for cost-sensitive and planned travel. It suits travelers who apply well before departure and do not require priority handling. Standard processing helps governments manage high application volumes through established review and approval procedures. Clear service expectations are essential, as uncertainty may lead travelers to use unofficial intermediaries. The global e-visa market requires transparent guidance to help applicants select the appropriate service level.
Expedited Processing is forecast to grow at a 9.56% CAGR through 2032. It supports urgent business travel, medical appointments, and unforeseen family needs. Faster processing must maintain identity verification and risk screening and therefore requires strong automation and effective staff escalation procedures. Clear eligibility criteria and accurate processing timelines can meet demand for expedited services without compromising border controls.
Geography Analysis
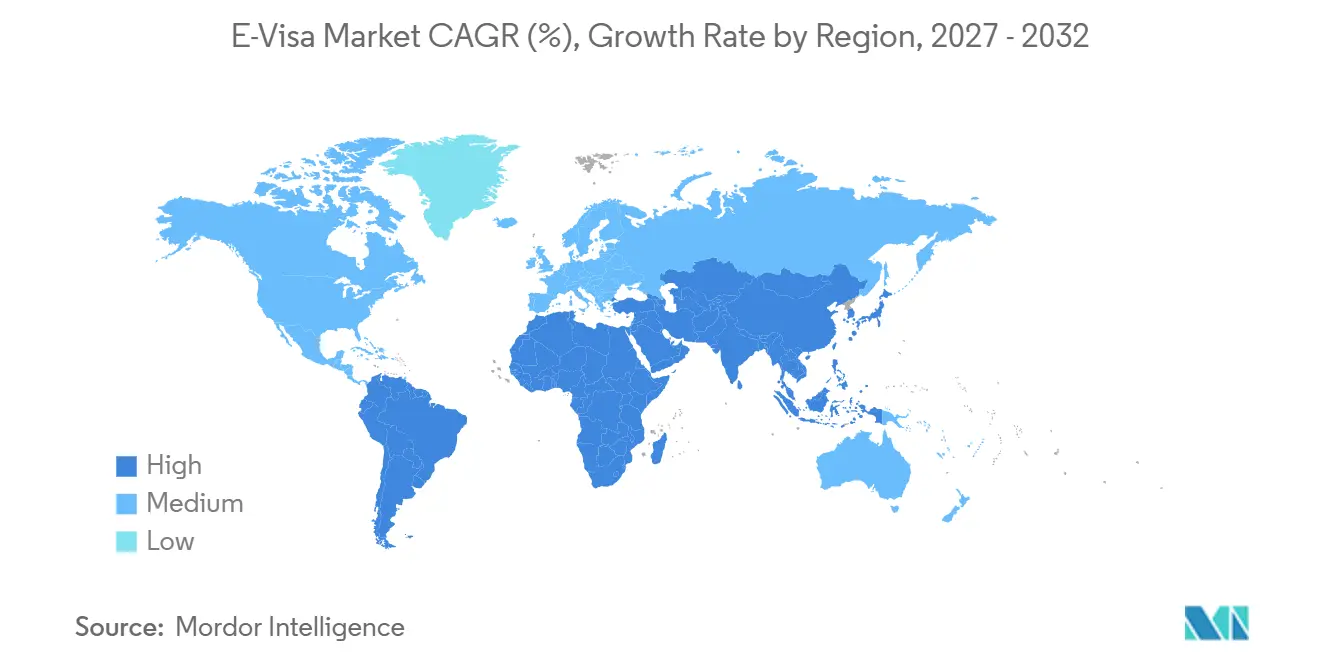
North America accounted for 34.85% of global e-visa services in 2026. Its mature border technology environment and high business and education travel volumes support demand. The United States biometric entry-exit rule increases demand for systems that collect and compare facial images across transportation modes. Canada operates an electronic travel authorization system for eligible visitors. These conditions support investment in data security, identity verification, and traveler-facing digital services. North American requirements can influence system design in other regions.
Europe plays a major role in digital border modernization through systems linking visa records with entry and exit checks. The progressive Entry/Exit System (EES) launch began in October 2025 and covers 29 countries. The sBMS and Visa Information System 4 (VIS4) provide shared biometric capabilities for participating in European systems. Germany’s online Consular Services Portal reflects the shift toward digital visa services. These initiatives drive demand for interoperable software and biometric equipment and establish high compliance requirements for suppliers.
Asia-Pacific is projected to grow at a 9.25% CAGR through 2032, the fastest regional rate. Large national programs, such as India’s, and online portals in markets such as Vietnam support regional adoption. South America, the Middle East, and Africa also offer growth opportunities as governments modernize online application portals.
E-Visa Infrastructure & Development Intelligence
India’s e-Visa framework covers 172 nationalities across 13 subcategories, supporting tourism, business, medical, and other travel purposes through a single digital platform. Designated airports and seaports link digital authorization with border entry, increasing the need to integrate application platforms with immigration checks as volumes rise. In the global e-visa market, opportunities include interoperable identity verification, automated eligibility checks, and risk-based screening that reduce manual processing without compromising security.
Germany launched its Consular Services Portal across 167 visa sections worldwide on January 1, 2025, enabling online applications for 28 national visa categories. The Maldives introduced its Maldives 2.0 initiative, including a mobile application, facial recognition, and e-Visa services, in November 2025. In May 2025, the European Union launched its shared Biometric Matching Service and upgraded the Visa Information System. These developments support demand for modular platforms that integrate biometrics, online applications, and border systems while enabling phased upgrades.
Competitive Landscape
The global e-visa market is highly concentrated. VFS Global, BLS International Services, TLScontact, CGI Inc., and General Dynamics Information Technology (GDIT) collectively account for a substantial share of identified government contract awards. Their positions reflect compliance records, global delivery capabilities, tender experience, and physical application-center networks for biometric enrollment and in-person support. New providers may find this model difficult to replicate. However, governments can reassign fixed-term contracts through new tenders, making the market concentrated but not closed.
Government procurement remains central to competition among visa-service operators. Long contract cycles favor suppliers that meet security, delivery, and local-support requirements. Opportunities emerge when governments renew mandates or expand coverage. Digital providers must combine online application intake with arrangements for physical verification where required and comply with country-specific data and operating requirements.
Biometric infrastructure suppliers operate at a related technical layer. In August 2026, eu-LISA selected a consortium of Accenture, ARHS Developments, IDEMIA Public Security France, and Thaleria. Digital platforms also simplify document collection, payment, and application tracking, while government authorities retain responsibility for visa decisions. The market balances streamlined traveler journeys with government-grade security and data controls.
E-Visa Industry Leaders
-
VFS Global
-
BLS International Services Limited
-
TLScontact
-
CGI Inc.
-
General Dynamics Information Technology
- *Disclaimer: Major Players sorted in no particular order
E-Visa Market Companies Covered in this Report
- VFS Global
- BLS International Services Limited
- TLScontact
- General Dynamics Information Technology
- CGI Inc.
- CIBT Inc.
- iVisa
- VisaHQ
- Atlys
- AlmavivA Group
- SCICOM (MSC) Berhad
- Muehlbauer Group
- Securiport LLC
- 4G Identity Solutions Private Limited
- Canadian Bank Note Company
- Entrust Corporation
- IDEMIA
- Thales
- Giesecke+Devrient
- Sherpa
Recent Industry Developments in E-Visa Market
- August 2026: A consortium led by Accenture, including ARHS Developments, IDEMIA Public Security France, and Thaleria, secured a 48-month eu-LISA contract with a maximum ceiling of EUR 53 million (USD 62.34 million) to develop and maintain the European Union’s Shared Biometric Matching Service.
- November 2025: The Maldives launched its e-visa service under the Maldives 2.0 initiative on November 10, and public applications opened on November 23. The rollout included a mobile application, facial recognition, and QR-coded e-visas for digital verification.
- October 2025: The European Union’s Entry/Exit System (EES) began its phased rollout across 29 European countries on October 12, digitally recording entries, exits, and refusals of entry for non-EU nationals traveling for short stays, alongside travel-document details, fingerprints, and facial images.
- February 2025: Atlys acquired United Kingdom-based visa services company Artionis following its USD 20 million Series B funding in September 2024, marking its United Kingdom market entry and expanding its European visa-processing capabilities.
Global E-Visa Market Report Scope
The global e-visa market report analyzes electronic visa systems that enable travelers to apply for and obtain travel authorization through digital platforms worldwide. The market is segmented by application type (Single-Entry Visa and Multiple-Entry Visa), application, processing time, and geography. The study examines key drivers, including international travel recovery, government digitalization, mobile-first applications, biometric verification, and growing cross-border tourism, business, education, and medical travel, alongside restraints such as cybersecurity risks, data-privacy requirements, uneven digital access, fragmented regulations, and government procurement barriers. It evaluates existing e-visa infrastructure, system modernization, application and approval trends, processing efficiency, traveler preferences, application-channel behavior, and visa-related spending. The report provides market size and growth forecasts, competitive landscape analysis, market concentration and share assessments, strategic developments, and profiles of leading providers. It also explores opportunities in interoperable digital identity, mobile-first visa infrastructure, and credential verification for multi-country travel. Market estimates and forecasts are presented in value (USD) across all covered segments.
Segmentation Overview
Key Questions Answered in the Report
What is driving growth in the global e-visa market?
The global e-visa market was valued at USD 1.24 billion in 2026 and is projected to reach USD 2.12 billion by 2032, growing at an 8.19% CAGR from 2027 to 2032, supported by government digitalization, recovery in international travel, mobile application adoption, and biometric border programs.
Which e-visa application type has the largest share?
Multiple-Entry Visa led application types with a 55.41% share in 2026 and is projected to grow at an 8.78% CAGR through 2032.
Which region holds the largest share of the global e-visa market?
North America accounted for 34.85% of the global e-visa market in 2026, supported by mature border technology and high business and education travel volumes.
Which travel purpose is growing fastest in e-visa applications?
Medical Travel is projected to grow at an 8.91% CAGR through 2032, supported by dedicated digital medical and medical-attendant categories.
What technology is changing visa and border processing?
Biometric identity checks, mobile document submission, secure portals, and links between visa and border databases are changing processing requirements.
Which region is expected to grow fastest?
Asia-Pacific is forecast to grow at a 9.25% CAGR through 2032, supported by regional travel recovery and wider adoption of digital visa programs.