Geotechnical Instrumentation And Monitoring Market Size and Share
Market Overview
| Study Period | 2020 - 2031 |
|---|---|
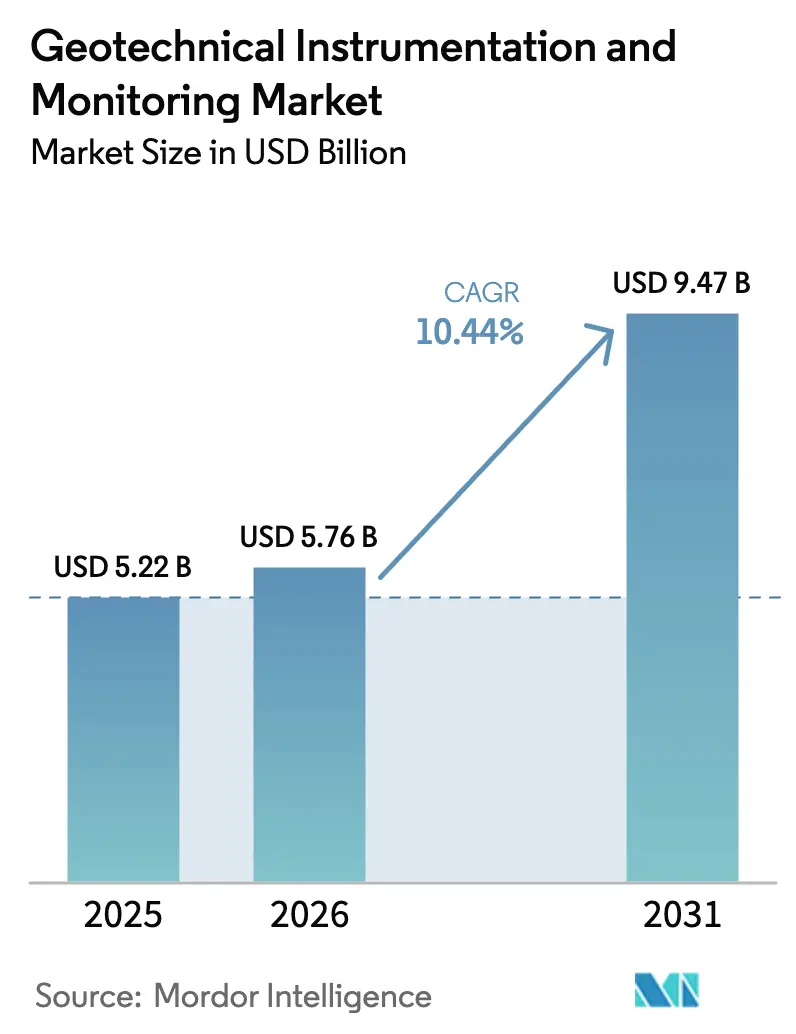
| Market Size (2026) | USD 5.76 Billion |
| Market Size (2031) | USD 9.47 Billion |
| Growth Rate (2026 - 2031) | 10.44% CAGR |
| Fastest Growing Market | Asia Pacific |
| Largest Market | North America |
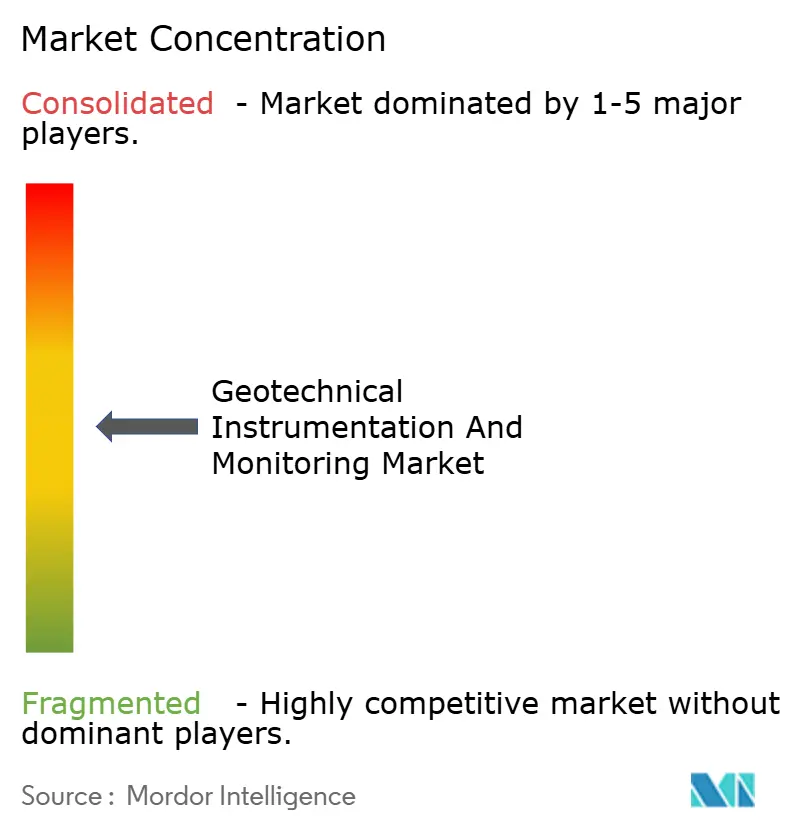
| Market Concentration | Medium |
Major Players *Disclaimer: Major Players sorted in no particular order Image © Mordor Intelligence. Reuse requires attribution under CC BY 4.0. | |
Geotechnical Instrumentation And Monitoring Market Analysis by Mordor Intelligence
Geotechnical instrumentation and monitoring market size in 2026 is estimated at USD 5.76 billion, growing from 2025 value of USD 5.22 billion with 2031 projections showing USD 9.47 billion, growing at 10.44% CAGR over 2026-2031. Rapid infrastructure upgrades, wider deployment of real-time subsurface sensors and progressively tighter safety mandates are powering this growth. The proliferation of IoT-ready devices, digital twin roll-outs and AI-enabled analytics is shifting demand from reactive data logging toward proactive risk prediction. Hardware continues to anchor spending, yet the strongest momentum is in software platforms that unlock predictive insights. Regionally, the adoption curve is steepest in Asia-Pacific, supported by headline infrastructure budgets, while North America sustains premium demand for high-accuracy systems meeting stringent regulatory norms. Competitive intensity is moderate; leading firms expand through vertical integration of sensors, analytics and field services, eroding the position of pure-play hardware vendors.
Key Report Takeaways
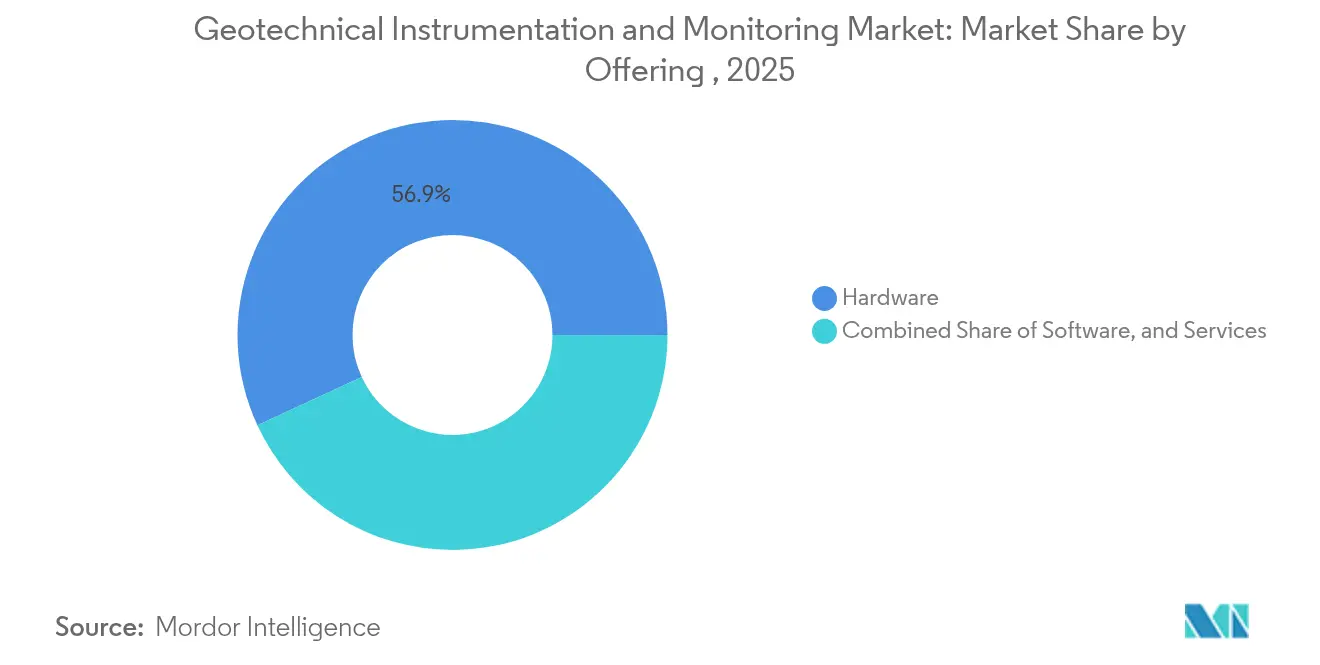
- By offering, hardware solutions held 56.90% of the geotechnical instrumentation and monitoring market share in 2025, whereas software is projected to advance at a 14.12% CAGR through 2031.
- By networking technology, wired systems accounted for 62.45% share of the geotechnical instrumentation and monitoring market size in 2025; wireless alternatives are rising at a 14.78% CAGR between 2026-2031.
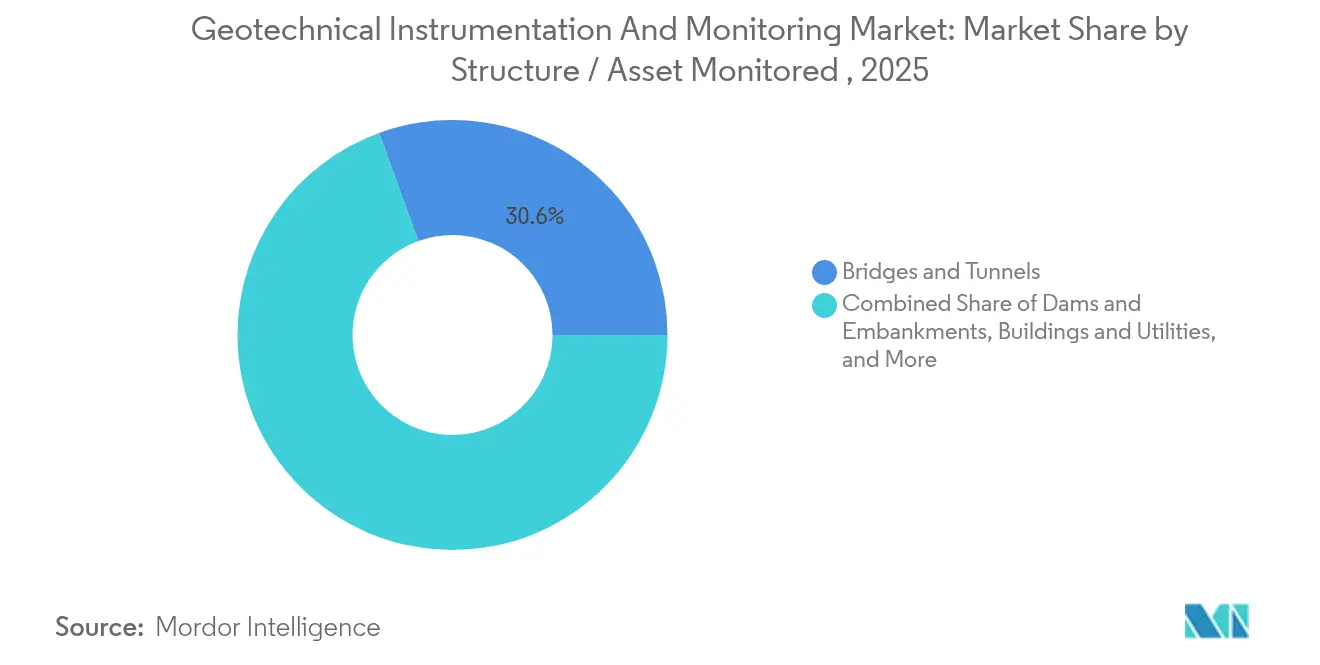
- By structure/asset monitored, bridges and tunnels captured 30.55% of the geotechnical instrumentation and monitoring market share in 2025, while rail and roadbeds are forecast to grow at 11.74% CAGR.
- By end-user industry, building and infrastructure developers led with 37.10% share of the geotechnical instrumentation and monitoring market size in 2025; transportation authorities are expanding at 12.46% CAGR to 2031.
- By region, North America contributed 34.05% revenue in 2025, while Asia-Pacific is poised for the fastest 12.12% CAGR through 2031.
Note: Market size and forecast figures in this report are generated using Mordor Intelligence’s proprietary estimation framework, updated with the latest available data and insights as of 2026.
Global Geotechnical Instrumentation And Monitoring Market Trends and Insights
Drivers Impact Analysis*
| Driver | (~) % Impact on CAGR Forecast | Geographic Relevance | Impact Timeline |
|---|---|---|---|
| Rising infrastructure investment up-cycle (2025-2030) | +2.8% | Global, with concentration in Asia-Pacific and North America | Medium term (2-4 years) |
| Integration of IoT, cloud analytics and edge AI | +2.1% | North America and EU leading, Asia-Pacific adoption accelerating | Short term (≤ 2 years) |
| Stricter global dam-safety and tailings regulations | +1.9% | Global, with emphasis on North America, Australia, Chile | Long term (≥ 4 years) |
| Surging underground metro and high-speed rail projects | +1.6% | Asia-Pacific core, spill-over to MEA and Latin America | Medium term (2-4 years) |
| Demand for remote frost-heave monitoring in polar assets | +0.8% | Arctic regions, Northern Canada, Alaska, Scandinavia | Long term (≥ 4 years) |
| Digital-twin build-out driving dense sensor deployments | +1.4% | North America and EU, expanding to Asia-Pacific urban centers | Short term (≤ 2 years) |
| Source: Mordor Intelligence | |||
Rising Infrastructure Investment Up-Cycle (2025-2030)
Governments and private investors are deploying record capital to modernize transport, water and energy assets. Unlike earlier waves, projects now embed monitoring systems at the design stage to avert failures and optimise life-cycle costs. Evidence from recent tenders shows every monitoring dollar can prevent USD 4-5 in reconstruction outlays, bolstering return on investment. Momentum is strongest in Asia-Pacific yet remains substantial in the United States, where the Infrastructure Investment and Jobs Act allocates multibillion funding for asset renewal.
Integration of IoT, Cloud Analytics and Edge AI
Next-generation data loggers, such as Campbell Scientific’s CR6, collect vibrating-wire readings and process them locally using patented VSPECT filtering, driving mean time between failures beyond five centuries [1]Campbell Scientific, “CR6 Measurement and Control System,” campbellsci.com. Edge analytics cuts latency, while cloud dashboards consolidate multi-site data for predictive modelling. Fugro’s GeoDIN plug-in for Civil 3D exemplifies integration, allowing designers to visualise subsurface behaviour within familiar CAD environments. The resulting shift from manual interpretation to automated risk alerts is redefining service value.
Stricter Global Dam-Safety and Tailings Regulations
Post-failure inquiries have triggered mandatory continuous monitoring. The Global Industry Standard on Tailings Management obliges owners to deploy real-time instrumentation throughout facility lifecycles. In the United States, Michigan’s Dam Risk Reduction Grant Program dedicates USD 14.9 million to advanced systems that issue automated alarms, signalling a new funding pipeline for sensor vendors [2]Michigan Department of Environment, Great Lakes, and Energy, “Dam Risk Reduction Grant Program,” michigan.gov. Compliance deadlines extend well into the 2030s, ensuring sustained demand.
Surging Underground Metro and High-Speed Rail Projects
Mega-projects such as the Grand Paris Express Line 18 rely on platforms like Sixense Geoscope to track millimetric ground shifts during tunnelling. Beijing Metro Line 12 employs Frauscher counter technology as a redundancy layer for train control, embedding geotechnical monitoring into operations. Similar instrumentation density is mandated on Melbourne Metro, which processes feeds from over 12,500 sensors via MissionOS. These references highlight the scale effect driving sensor volumes.
Restraints Impact Analysis*
| Restraint | (~) % Impact on CAGR Forecast | Geographic Relevance | Impact Timeline |
|---|---|---|---|
| High installation and life-cycle cost | -1.8% | Global, particularly affecting emerging markets | Medium term (2-4 years) |
| Shortage of GIM-skilled geotechnical engineers | -1.4% | North America and EU most affected, spreading globally | Long term (≥ 4 years) |
| Cyber-security risk to wireless sensor networks | -0.9% | Global, with higher impact in critical infrastructure | Short term (≤ 2 years) |
| Specialty fiber-optic sensor supply-chain fragility | -0.7% | Global, with concentration in Asia-Pacific manufacturing | Medium term (2-4 years) |
| Source: Mordor Intelligence | |||
High Installation and Life-Cycle Cost
Comprehensive systems can consume 3-5% of capital budgets and demand specialised crews for fit-out. Over a 20-year horizon, data hosting and maintenance often outstrip hardware expenses. Smaller contractors in South Asia and Africa delay adoption despite proven risk mitigation. Nevertheless, insurers increasingly factor monitoring coverage into premium calculations, gradually shifting the cost-benefit balance in favour of deployment.
Shortage of GIM-Skilled Geotechnical Engineers
The American Society of Civil Engineers warns of a persistent talent gap, with engineering retirements outpacing new graduates. Advanced IoT configuration, AI model tuning and digital-twin maintenance require hybrid competencies rarely taught in traditional curricula. Resultant capacity constraints lengthen commissioning schedules and elevate service fees, though turnkey offerings from multinational providers partly bridge the gap.
*Our forecasts treat driver/restraint impacts as directional, not additive. The impact forecasts reflect baseline growth, mix effects, and variable interactions.
Segment Analysis
By Offering: Hardware Anchors Spend, Software Accelerates Value Creation
Hardware secured 56.90% market share of the geotechnical instrumentation and monitoring market. Growth remains steady as every project still needs physical sensors for displacement, pore-pressure or strain. Software revenue, while smaller, is rising at 14.12% CAGR. The geotechnical instrumentation and monitoring market size for software is projected to reach USD 2.41 billion by 2031 as digital twins become a design-bid-build requirement. Hardware evolution continues, illustrated by SoilVue 10, a maintenance-free sensor that integrates waveform digitisation for seamless IoT connectivity.
Software adoption stems from demand for risk dashboards, automated alarms and life-cycle analytics. Fugro’s GroundIQ converts heterogeneous data into cavity-risk maps without manual post-processing. In turn, services revenues expand, covering calibration, cloud hosting and AI model management. Overall, integrated packages combining sensors, analytics and support capture rising share as owners favour single-throat accountability.


By Networking Technology: Wireless Momentum Builds Amid Wired Dominance
Wired architectures contributed 62.45% revenue in 2025, supported by the proven reliability of fiber-optic backbones across dams, tunnels and pipelines. The segment also recorded the largest geotechnical instrumentation and monitoring market share for data-dense assets. Distributed fiber sensing from AP Sensing pinpoints leaks and ground movement along entire routes, enhancing structural health visibility.
Wireless deployments, spanning sub-GHz LoRa, NB-IoT and Wi-Sun, clock a 14.78% CAGR as battery optimisation and edge processing reduce maintenance visits. GEOKON’s Model 8910 leverages LoRaWAN to stream vibrating-wire data where trenching is impossible . Cost benefits and flexibility position wireless as the default for temporary shoring, landslide watch and remote permafrost tracking. Hybrid topologies are emerging, combining wired trunks with wireless star networks to overcome site constraints.
By Structure/Asset Monitored: Rail Bed Stability Gains Urgency
Bridges and tunnels retained the largest geotechnical instrumentation and monitoring market share at 30.55% in 2025, shaped by aging assets that now exceed design life. Projects such as the Blisworth Embankment rehabilitation install inclinometers and strain gauges to detect slide surfaces before failure.
Rail and roadbeds display the fastest 11.74% CAGR. Frost-heave monitoring on Finnish lines employs temperature sensors and LVDTs to protect slab tracks from differential movement. High-speed corridors in China, India and the Gulf add thousands of sensors per kilometre to meet settlement tolerances below 2 mm. Dam and embankment monitoring is resurging under stricter tailings codes, while building foundations in megacities integrate inclinometer arrays to safeguard adjacent heritage structures.
By End-User Industry: Transportation Authorities Accelerate Adoption
Building and infrastructure developers represented 37.10% of the geotechnical instrumentation and monitoring market in 2025, ordering systems during construction to guarantee design compliance. Owners now specify automated monitoring in EPC contracts, elevating baseline demand. Public transportation agencies deliver the steepest 12.46% CAGR. Washington Metropolitan Area Transit Authority’s USD 11.1 billion capital programme budgets sensors for track geometry, tunnel convergence and station slab deflection.
Mining operators face mandatory continuous tailings tracking aligned with the global standard, driving sensor redundancy and satellite-to-ground data fusion. Oil and gas firms extend monitoring beneath wellpads for integrity and methane surveillance, while water authorities adopt piezometers and tiltmeters to anticipate levee breach during extreme rainfall.
Geography Analysis
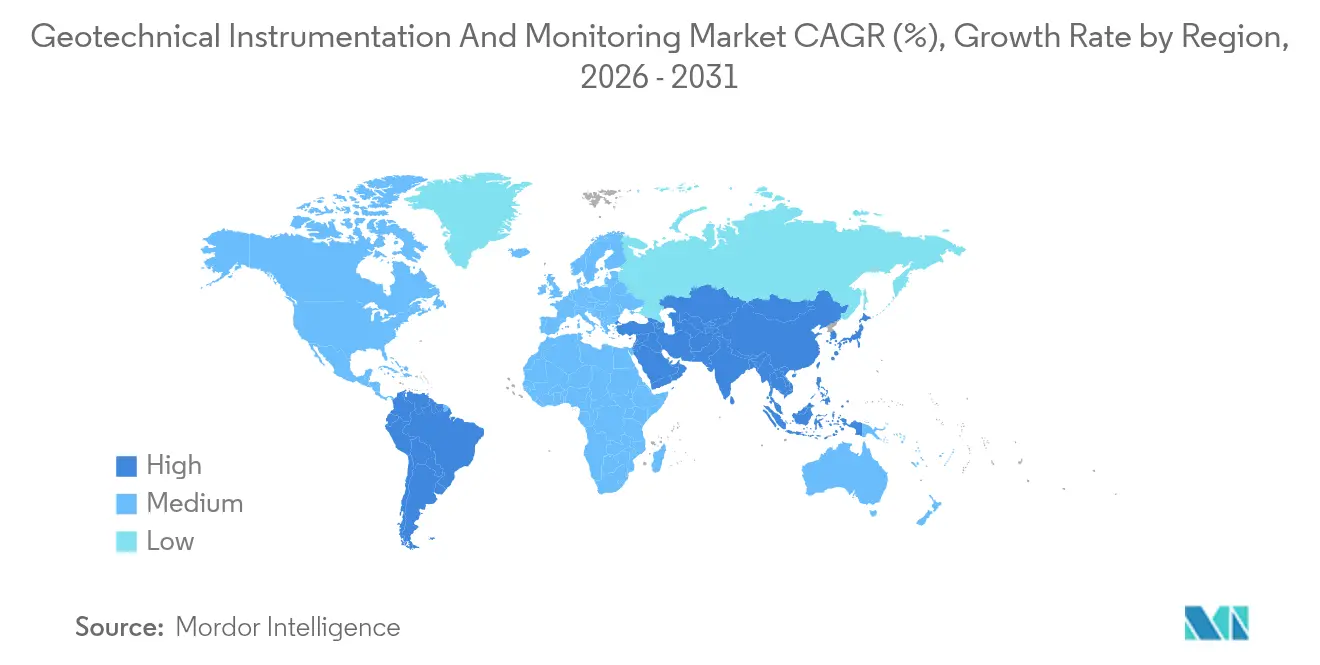
North America accounted 34.05% of the geotechnical instrumentation and monitoring market share, underpinned by renewed federal infrastructure funding and rigorous dam-safety codes. U.S. engineers also retrofit legacy bridges with fiber Bragg grating arrays to track fatigue cracks. Canada’s permafrost corridors deploy distributed temperature sensing to protect pipelines from frost heave.
Asia-Pacific is expanding at a 12.12% CAGR, outpacing all regions. The Asian Development Bank estimates USD 43 trillion transport investments by 2035, embedding sensor packages in expressways, metros and high-speed rails. China’s urban rail mileage exceeded 10,000 km in 2025, each project specifying automated settlement and deformation monitoring. India’s National Infrastructure Pipeline funds the Delhi–Mumbai Expressway and Ganga Expressway, both incorporating continuous instrumentation. Europe is a replacement market emphasising sustainability. Asset managers roll out digital twins to maximise life cycles, while EU Green Deal statutes encourage predictive maintenance. South America’s opportunity hinges on tailings dam compliance in Chile and Brazil, whereas the Middle East channels spending to metro extensions and low-carbon hydrogen hubs requiring ground stability assurance. Africa’s growth remains nascent but accelerates as public-private partnerships unlock capital for highways and power corridors.

Competitive Landscape
Market fragmentation prevails, yet scale advantages accrue to groups offering end-to-end solutions. Fugro posted 27.5% revenue growth by fusing site characterisation with analytics platforms, reducing client interface points. Keller Group recorded a 76% surge in underlying operating profit through bundling instrumentation with specialist foundation works.
Strategic alliances widen service scope. Worldsensing and IDS GeoRadar launched a unified mining monitoring suite that merges prism, radar and seismic feeds into one dashboard. Start-ups target niches such as MEMS tilt nodes or AI-based anomaly detection, frequently becoming acquisition targets once product-market fit is proven. Overall, differentiation shifts from sensor count to actionable intelligence, rewarding players that demonstrate predictive accuracy and uptime.
Geotechnical Instrumentation And Monitoring Industry Leaders
Fugro N.V.
Keller Group plc
Nova Metrix LLC
Sisgeo S.r.l.
RST Instruments Ltd.
- *Disclaimer: Major Players sorted in no particular order

Recent Industry Developments
- June 2025: Fugro opened a Jakarta geotechnical laboratory, raising capacity by 20% and trimming test turnaround by 30%.
- June 2025: Fugro won an offshore site characterisation contract with RWE and TotalEnergies for upcoming wind farms.
- May 2025: Michigan EGLE awarded USD 14.9 million for monitoring-centric dam upgrades under its Dam Risk Reduction Grant Program.
- January 2025: SOCOTEC acquired Ninyo and Moore, adding 16 U.S. offices and 600 staff to bolster environmental and infrastructure services.


Research Methodology Framework and Report Scope
Market Definitions and Key Coverage
Our study defines the geotechnical instrumentation and monitoring (GIM) market as all revenue earned from hardware, software, and associated services that record and analyze ground or structural behavior, such as stress, displacement, pore-water pressure, or vibration, across civil engineering, mining, energy, and environmental projects. Instruments covered include wired and wireless sensors, data loggers, and real-time telemetry platforms that feed decision-support analytics.
Scope exclusion: marine geophysical survey vessels and stand-alone soil testing laboratories are not included.
Segmentation Overview
- By Offering
- Hardware
- Software
- Services
- By Networking Technology
- Wired
- Copper-cabled
- Fiber-optic
- Wireless
- Short-range (Wi-Fi, ZigBee, BLE)
- LPWAN (LoRa, NB-IoT, LTE-M)
- Wired
- By Structure / Asset Monitored
- Bridges and Tunnels
- Dams and Embankments
- Buildings and Utilities
- Rail and Roadbeds
- Excavations and Deep Foundations
- Others
- By End-user Industry
- Building and Infrastructure Developers
- Energy and Power (incl. Renewables)
- Oil and Gas
- Mining and Quarrying
- Transportation Authorities
- Environmental and Water Management
- By Geography
- North America
- United States
- Canada
- Mexico
- South America
- Brazil
- Argentina
- Rest of South America
- Europe
- Germany
- United Kingdom
- France
- Italy
- Spain
- Russia
- Rest of Europe
- Asia-Pacific
- China
- Japan
- India
- South Korea
- Australia and New Zealand
- Rest of Asia-Pacific
- Middle East and Africa
- Middle East
- Saudi Arabia
- United Arab Emirates
- Turkey
- Rest of Middle East
- Africa
- South Africa
- Nigeria
- Egypt
- Rest of Africa
- Middle East
- North America
Detailed Research Methodology and Data Validation
Primary Research
Mordor analysts interviewed site engineers, sensor OEM product managers, and project consultants across North America, Europe, the GCC, and APAC. Dialogues clarified typical instrument lifecycles, average selling prices, and adoption barriers. Our short web-based survey of infrastructure owners provided utilization rates that desktop work could not surface.
Desk Research
We began with open government datasets (USGS, Eurostat construction output, India's MoRTH project tracker) and sector bodies such as the International Society for Soil Mechanics and Geotechnical Engineering, the American Concrete Institute, and the International Tunnelling Association to map infrastructure backlogs and project pipelines. Patent abstracts retrieved via Questel signaled sensor miniaturization trends, while contract notices from Tenders Info and shipment tallies on Volza helped us triangulate hardware flows. Company 10-Ks, bond prospectuses, and reputable press added price and margin clues. These sources illustrate, but do not exhaust, the wider document set our team examined.
Market-Sizing and Forecasting
We constructed a top-down demand pool by aligning annual civil construction spending, mine capital budgets, and dam refurbishment outlays with historical sensor penetration ratios, which are then validated through selective bottom-up roll-ups of leading supplier shipments. Key variables like average channel mark-ups, wired-to-wireless mix shift, sensor price deflation, and regulatory mandates on safety audits drive the model. A multivariate regression links these drivers to observed hardware and service revenue; its coefficients, reviewed with our interview panel, power the 2025-2030 forecast. Where supplier data were sparse, we used regional proxy ratios drawn from structurally similar asset classes and adjusted them during variance checks.
Data Validation and Update Cycle
Outputs pass a two-step analyst peer review, anomaly flags trigger re-checks with external experts, and currency conversions follow IMF average annual rates. The study refreshes every twelve months, with interim revisions if large infrastructure stimulus packages or major technology breakthroughs emerge.
Why Mordor's Geotechnical Instrumentation and Monitoring Baseline Stands Firm
Published figures often diverge because firms select different asset classes, apply varied price curves, or refresh on offset calendars.
Key gap drivers include: some estimations exclude software support, others freeze penetration rates despite accelerating retrofit mandates, and a few apply aggressive wireless price erosion that our interviews dispute.
Benchmark comparison
| Market Size | Anonymized source | Primary gap driver |
|---|---|---|
| USD 5.22 B (2025) | Mordor Intelligence | - |
| USD 5.05 B (2024) | Global Consultancy A | Omits installation and calibration services; relies on uniform ASP across regions |
| USD 3.20 B (2021) | Industry Association B | Older base year and limited to hardware, excluding cloud analytics fees |
In sum, by pairing transparent variable selection with annual refreshes and multi-source corroboration, we give decision-makers a balanced, reproducible baseline that aligns closely with on-site realities.


Key Questions Answered in the Report
What is the current value of the geotechnical instrumentation and monitoring market?
The market was valued at USD 5.76 billion in 2026 and is on track to reach USD 9.47 billion by 2031.
Which region generates the largest revenue?
North America leads with 34.05% of 2025 revenue due to stringent safety mandates and large refurbishment programmes.
Which segment is expanding the fastest?
Software platforms are growing at 14.12% CAGR as digital twins and AI analytics gain traction.
Why are transportation authorities increasing spending on monitoring?
Agencies adopt predictive monitoring to enhance safety and reduce maintenance outages, driving a 12.46% CAGR in this end-user segment.
What technologies are propelling future growth?
Edge AI, IoT sensor miniaturisation and wireless LPWAN networks collectively improve data quality while lowering deployment costs.
What is the main barrier to wider adoption?
High upfront and life-cycle costs, coupled with a shortage of engineers skilled in advanced monitoring systems, remain key hurdles.
Page last updated on:


