
Fiber Route Valuation and Monetization Market Size and Share
Market Overview
| Study Period | 2020 - 2031 |
|---|---|
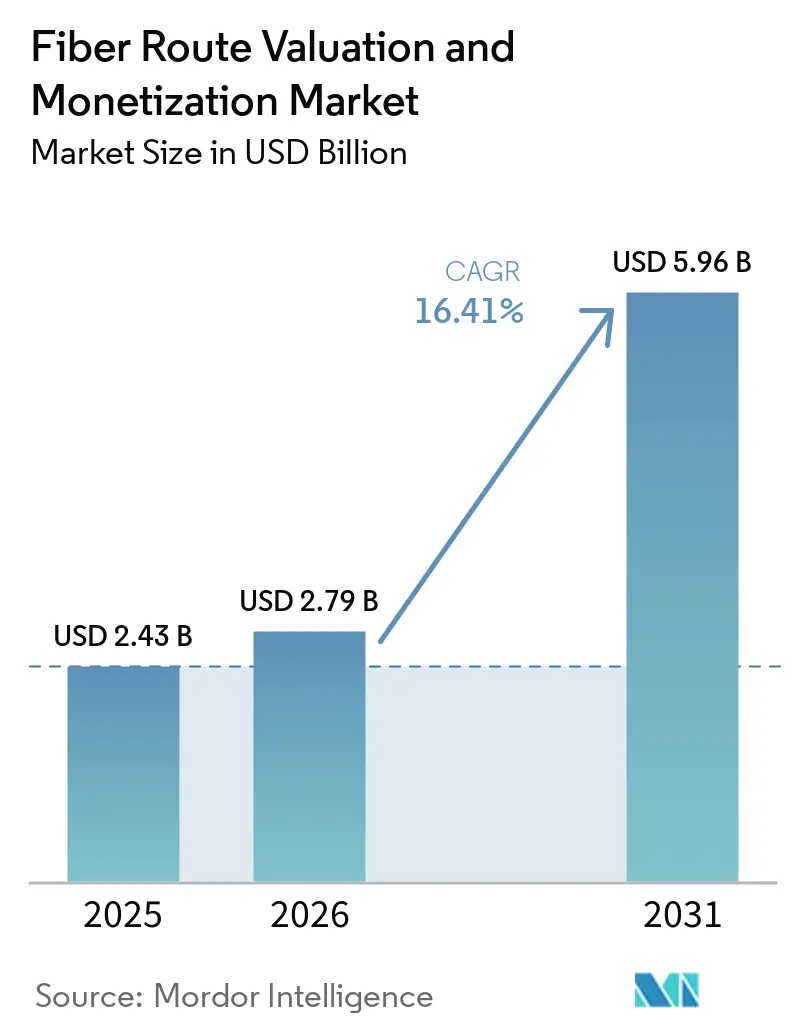
| Market Size (2026) | USD 2.79 Billion |
| Market Size (2031) | USD 5.96 Billion |
| Growth Rate (2026 - 2031) | 16.41 % |
| Fastest Growing Market | Asia-Pacific |
| Largest Market | North America |
| Market Concentration | Medium |
Major Players *Disclaimer: Major Players sorted in no particular order Image © Mordor Intelligence. Reuse requires attribution under CC BY 4.0. | |
Fiber Route Valuation and Monetization Market Analysis by Mordor Intelligence
The Fiber route valuation and monetization market size is expected to increase from USD 2.43 billion in 2025 to USD 2.79 billion in 2026 and reach USD 5.96 billion by 2031, expanding at a CAGR of 16.41% over 2026-2031. AI-related bandwidth needs are changing how owners value dark fiber, especially where routes can serve large data center clusters. Long-term indefeasible rights of use agreements are making capacity commitments more visible and supporting investment decisions for existing routes. Hyperscalers, carriers, AI infrastructure providers, and neoclouds are competing for routes with low latency, diverse paths, and reliable access to data centers. This demand favors operators that can combine route availability with permits, physical security, and clear network records. High construction costs, right-of-way fees, and approval delays continue to limit how quickly the Fiber route valuation and monetization market can add supply.
Key Report Takeaways
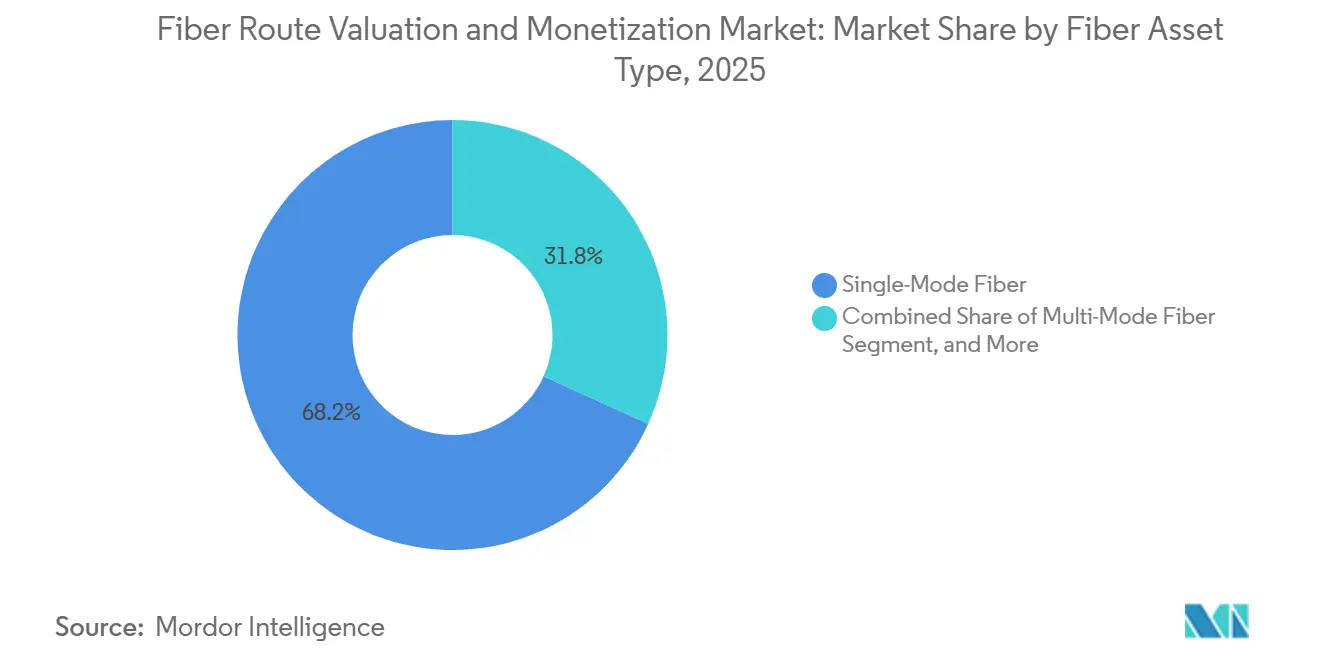
- By fiber asset type, Single-Mode Fiber held 68.22% of the Fiber route valuation and monetization market share in 2025, while Multi-Mode Fiber is projected to expand at a 16.72% CAGR through 2031.
- By network type, Metro Networks accounted for 39.47% of the Fiber route valuation and monetization market size in 2025, while Submarine Networks are projected to expand at a 16.88% CAGR through 2031.
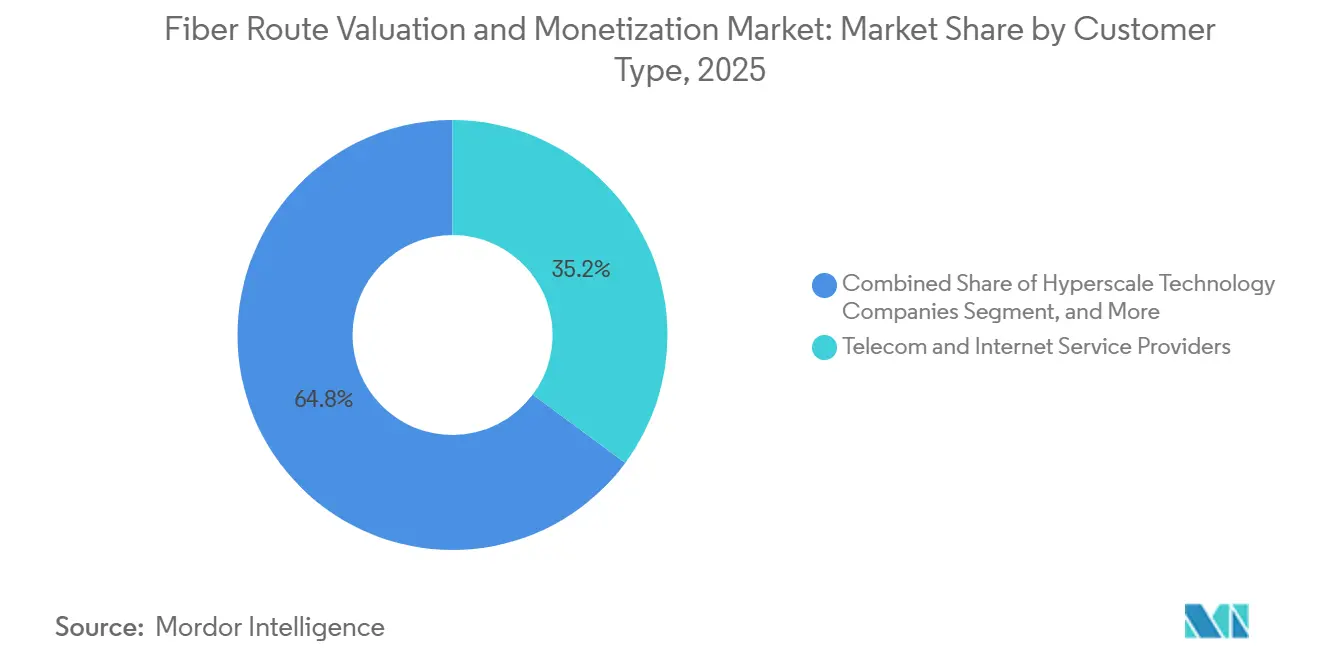
- By customer type, Telecom and Internet Service Providers held 35.16% revenue share in 2025, while Hyperscale Technology Companies are projected to expand at a 16.93% CAGR through 2031.
- By application, Data Transmission and Telecommunications accounted for 27.54% revenue share in 2025, while Data Center Interconnect is projected to expand at a 17.11% CAGR through 2031.
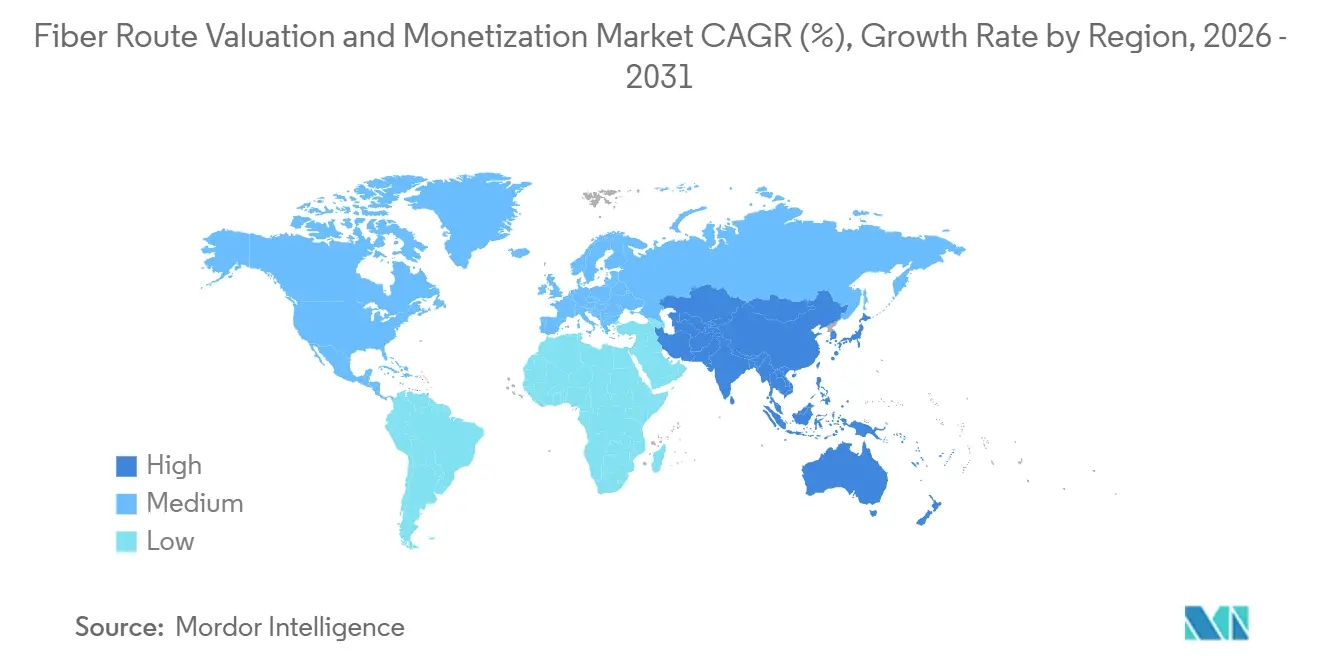
- By geography, North America held 37.26% revenue share in 2025, while Asia-Pacific is projected to expand at a 17.21% CAGR through 2031.
Note: Market size and forecast figures in this report are generated using Mordor Intelligence’s proprietary estimation framework, updated with the latest available data and insights as of January 2026.
Market Trends and Insights
Drivers Impact Analysis of Fiber Route Valuation and Monetization Market*
| Driver | (~) % Impact on CAGR Forecast | Geographic Relevance | Impact Timeline |
|---|---|---|---|
| AI Workload Expansion and Hyperscale Capacity Ownership | +4.8% | Global, concentrated in North America, Asia-Pacific, and Western Europe | Short term (≤ 2 years) |
| 5G Backhaul and Network Densification | +3.2% | North America, East and South Asia, with spillover into Middle East and Africa urban cores | Short term (≤ 2 years) |
| Data Center Interconnect and Cloud On-Ramp Expansion | +3.1% | North America, Western Europe, Asia-Pacific core | Medium term (2-4 years) |
| Sovereign Cloud and Data Residency Requirements | +1.8% | European Union, United Kingdom, Asia-Pacific, Gulf Cooperation Council | Medium term (2-4 years) |
| Municipal Open-Access Fiber Initiatives | +1.1% | United States, Western Europe | Medium term (2-4 years) |
| Subsea Landing and Terrestrial Route Diversification | +0.8% | Global, with priority in Pacific, Middle East and Africa, and South Atlantic corridors | Long term (≥ 4 years) |
| Source: Mordor Intelligence | |||
AI Workload Expansion and Hyperscale Capacity Ownership
AI clusters need direct, high-capacity links between computing systems, which makes managed wavelength procurement less suitable for the largest deployments. In January 2026, Meta and Corning announced a USD 6 billion, multiyear supply agreement through 2030 for optical fiber, cable, and connectivity products for Meta’s U.S. data centers.[1] Such commitments can secure manufacturing capacity before a route is built, which improves planning certainty for large network programs. The Fiber route valuation and monetization market benefits when customers commit early because route owners can use longer contracts to support construction and refinancing decisions. Zayo reported that long-haul dark fiber demand doubled from 2024 to 2025 and that new fiber sold tripled over the same period, with hyperscalers, carriers, and neoclouds becoming major purchasers.[2] The supply pressure leaves less readily available capacity for mid-sized buyers and gives value to routes that can be activated without lengthy new construction.
5G Backhaul and Network Densification
5G network densification requires more fiber transport, even when spending by cloud companies changes from year to year. New macro sites increasingly require high-capacity links, while concentrated small-cell deployments can exceed the limits of microwave backhaul. The fiber connected to a cell site can also support nearby enterprises, public safety networks, and other tenants, which improves the value of the same route over time. Lightpath said it expanded service to a substantial number of macro cell tower locations across several northeastern US states, adding extensive route miles and high-capacity aggregation links. The fiber route valuation and monetization market, therefore, gains from urban routes that can serve both mobile backhaul and fixed connectivity demand, improving the commercial use of route capacity in dense cities. Neutral-host access models and spectrum obligations can further increase demand for shared fiber in dense urban areas.
Data Center Interconnect and Cloud On-Ramp Expansion
Data Center Interconnect is projected to expand at a 17.11% CAGR through 2031, making it the fastest-growing application in the Fiber route valuation and monetization market. AI training campuses are increasingly located in secondary markets with access to power, which increases the need for links back to core cloud regions. This changes the value of routes outside traditional coastal data center centers because they can connect distributed computing capacity to established hubs in the Fiber route valuation and monetization market. In January 2026, Uniti Wholesale announced a major expansion in the U.S. South-Central region, supported by a long-term customer contract. The project connects major markets with emerging AI centers in Memphis, Little Rock, and Amarillo. Long-duration commitments can reduce demand uncertainty for independent operators that build routes before selling all available capacity.
Sovereign Cloud and Data Residency Requirements
Data residency requirements are increasing the need for locally terminated fiber paths in countries that previously relied on shared cross-border capacity. Where rules require local processing as well as local storage, cloud providers need routes that keep traffic within defined jurisdictions. AWS launched the AWS European Sovereign Cloud in January 2026 as infrastructure separate from standard AWS Regions, with local operations and controls designed for sovereignty requirements.[3] Equinix introduced Fabric Geo Zones in May 2026 to help enterprises keep traffic within selected geographic boundaries across its interconnected facilities.[4] The Fiber route valuation and monetization market gains where operators can document the physical path and show that traffic does not cross an undesired border. Those capabilities can differentiate certified routes from general-purpose capacity sold through shared infrastructure in the Fiber route valuation and monetization market.
Restraints Impact Analysis of Fiber Route Valuation and Monetization Market*
| Restraint | (~) % Impact on CAGR Forecast | Geographic Relevance | Impact Timeline |
|---|---|---|---|
| High Civil Works and Right-of-Way Costs | -2.1% | United States, Western Europe, South America | Short term (≤ 2 years) |
| Complex Permitting and Construction Lead Times | -1.5% | United States, European Union, emerging-market urban cores | Medium term (2-4 years) |
| Network Operations and Maintenance Complexity | -1.2% | Global, with highest exposure in multi-jurisdiction long-haul routes | Long term (≥ 4 years) |
| Route-Specific Demand and Stranded Fiber Risk | -0.7% | Tier-2 and Tier-3 cities globally | Long term (≥ 4 years) |
| Source: Mordor Intelligence | |||
High Civil Works and Right-of-Way Costs
Civil construction remains the largest part of a fiber deployment budget and limits the financial return from new routes. The Fiber Broadband Association’s deployment-cost report indicated that underground deployment costs increased year over year and that labor accounted for the majority of underground expenditure. Railroad crossing permits can also create substantial cost and timing risks for a route. The same industry evidence indicated that surveyed respondents expected deployment costs to increase further because of labor, materials, and permitting pressures. These conditions reduce the number of speculative builds that can proceed without a committed customer. They also increase the premium for existing routes with usable conduit, documented rights of way, and expansion capacity.
Complex Permitting and Construction Lead Times
A single route can require approvals from local governments, state transportation departments, waterway authorities, and railroads. Each agency may use separate review periods, making the project schedule difficult to manage as a single process. Fiber deployment respondents have reported significant project delays, with permitting extending schedules substantially and, in some cases, causing lengthy delays. Industry findings also indicate that permitting can represent a meaningful share of project costs and become particularly costly in high-friction locations. The Federal Communications Commission has proposed national standards for wireline access to rights of way, including safe-harbor fee levels and shot-clock provisions. Operators with established permitting teams and documented approvals can therefore offer a more predictable development schedule than operators entering an unfamiliar jurisdiction.
*Our forecasts treat driver/restraint impacts as directional, not additive. The impact forecasts reflect baseline growth, mix effects, and variable interactions.
Fiber Route Valuation and Monetization Market Segment Analysis
By Fiber Asset Type:
Single-Mode Leads Long-Haul and Campus Interconnect DemandSingle-Mode Fiber held 68.22% of the Fiber route valuation and monetization market share in 2025. It is used across long-haul routes, metro cores, and campus links that need high capacity over extended distances. Large data center operators are standardizing on single-mode fiber for campus interconnects, inter-building links, and backbone cabling as 400G and 800G deployments move beyond core network layers. Its technical reach supports routes that can carry substantial traffic and remain useful as transmission requirements rise. This creates a durable basis for long-term IRU revenue where a route reaches key facilities and has documented capacity for later upgrades in the Fiber route valuation and monetization market.
Multi-Mode Fiber is projected to expand at a 16.72% CAGR through 2031. AI pod designs use OM4 and OM5 multi-mode fiber for short intra-row and rack-to-rack connections, where VCSEL-based transceivers can offer cost benefits. This shorter-reach use complements rather than replaces the single-mode infrastructure used between buildings and across campuses. Glass Fiber continues to serve specialized industrial and defense applications that require tailored optical performance. Plastic Optical Fiber remains relevant to short-range and cost-sensitive connections where bend radius and connector simplicity outweigh maximum bandwidth. The Fiber route valuation and monetization market benefits when operators align fiber specifications with the technical needs of a customer site.

By Network Type:
Metro Networks Anchor Revenue While Submarine Routes Lead GrowthMetro Networks accounted for 39.47% of the Fiber route valuation and monetization market size in 2025. High-density urban corridors combine data center colocation, enterprise networking, and 5G small-cell backhaul on the same infrastructure. Unlike a long-haul route that may depend on one major IRU contract, a metro route can serve several tenants and applications over the same footprint. It can support dark fiber, wavelength services, and cell-site backhaul at the same time, which improves utilization across the asset life. Dense route footprints also allow an operator to add customers without replicating the entire civil construction cost, a core advantage in the Fiber route valuation and monetization market.
Submarine Networks are projected to expand at a 16.88% CAGR from 2026 to 2031. Hyperscalers are supporting dedicated transoceanic systems for AI traffic that moves between major computing regions. The Fiber route valuation and monetization market is also affected by disruption risk on established systems, which increases the value of diverse paths and alternative landing options. The International Telecommunication Union’s 2026 submarine cable resilience report called for stronger legal and regulatory frameworks, risk mitigation, and greater route diversity and redundancy. Long-Haul Networks continue to attract institutional demand from carriers and government entities. Local Access and Fiber-to-the-Building Networks benefit from open-access programs and broadband expansion projects in underserved areas.
By Customer Type:
Telcos Lead Revenue While Hyperscalers Change Buying PatternsTelecom and Internet Service Providers held 35.16% revenue share in 2025. Their position reflects long-term IRU agreements, wavelength resale, and wholesale dark fiber contracts that can produce recurring income independent of retail market conditions. Their purchasing model is changing as hyperscalers seek more direct control over route capacity and operational planning. Neoclouds and AI infrastructure providers are also becoming a distinct source of demand for dark fiber. The Fiber route valuation and monetization market gives route owners more customer types to serve, but it can reduce the role of managed connectivity services in the largest accounts.
Hyperscale Technology Companies are projected to expand at a 16.93% CAGR through 2031. Their shift from capacity purchasing to ownership supports longer commitments for routes that link large data centers and cloud regions. Data Centers and Cloud Providers can act as anchor tenants, creating demand for last-mile and campus interconnect fiber near their sites. Enterprise and Private Network Operators use dedicated fiber for private 5G, multi-cloud connectivity, and industrial automation. Government and Defense Organizations can offer long-duration contracts where security, physical protection, and route control are important. These buyers can improve the value of qualified corridors because their requirements are difficult to meet with shared general-purpose capacity in the Fiber route valuation and monetization market.
By Application:
Data Transmission Retains Share While DCI Changes Route EconomicsData Transmission and Telecommunications accounted for 27.54% revenue share in 2025. The segment is supported by carrier interconnect agreements and continuing income from established wavelength services that operate on existing infrastructure. It provides a broad base of demand for routes that already serve telecommunications customers. These contracts can keep installed infrastructure in service while customers add higher-capacity requirements. The Fiber route valuation and monetization market retains this revenue base even as newer applications change the mix of route demand.
Data Center Interconnect is projected to expand at a 17.11% CAGR through 2031. New DCI agreements are increasingly structured as 20-year IRU contracts with hyperscalers or neoclouds, which can make cash flow more predictable for infrastructure owners. These arrangements can convert one-time deployment activity into long-duration contracted income. 5G Backhaul and Fronthaul also need higher-capacity links as network architectures develop. Enterprise Networking supports dedicated fiber demand in financial services, health care, and manufacturing. Industrial Automation, Military and Defense Communications, and Network Redundancy and Disaster Recovery require reliability, low latency, and security, which can support premium pricing for qualified routes.
Geography Analysis
North America Fiber Route Valuation and Monetization Market
North America held 37.26% of the Fiber route valuation and monetization market share in 2025. The region has a large base of hyperscale data centers, AI infrastructure investment, and dark fiber assets that can be revalued through IRU and lease agreements. The U.S. South-Central corridor is gaining attention as a link between computing sites and established network markets. Uniti Wholesale’s large-scale project and substantial contract illustrate the value of committed demand in the region. Canada supports stable enterprise and government demand, while Mexico is drawing interest for latency-sensitive cross-border routes and links between major regional centers.
APAC Fiber Route Valuation and Monetization Market
Asia-Pacific is projected to expand at a 17.21% CAGR through 2031. Data center expansion in India, South Korea, and Japan is increasing the need for both terrestrial and submarine connectivity. In 2026, Google and Telstra announced a fiber partnership that gives Google access to inter-city dark fiber on Telstra’s Aura Network while Telstra leases capacity on Google’s Pacific subsea cable systems. The arrangement shows how owners can exchange access across terrestrial and subsea assets instead of relying on a single type of network. China continues to support large domestic fiber investment, while India’s 5G densification sustains transport fiber demand across urban and peri-urban areas in the Fiber route valuation and monetization market.
EMEA and South America Fiber Route Valuation and Monetization Market
Europe is moving from fiber rollout toward route monetization in mature markets, while Central and Eastern Europe offer less developed route opportunities. Germany’s telecommunications sector is making substantial investments in fiber networks, supported by significant federal funding through Gigabitförderung. The Middle East is pursuing route diversification, while Africa remains at an earlier monetization stage as operators upgrade networks and improve commercial use of existing coverage. South America is developing around submarine cable landing points and urban metro networks, creating opportunities for terrestrial connections into inland demand centers in the fiber route valuation and monetization market.
Competitive Landscape
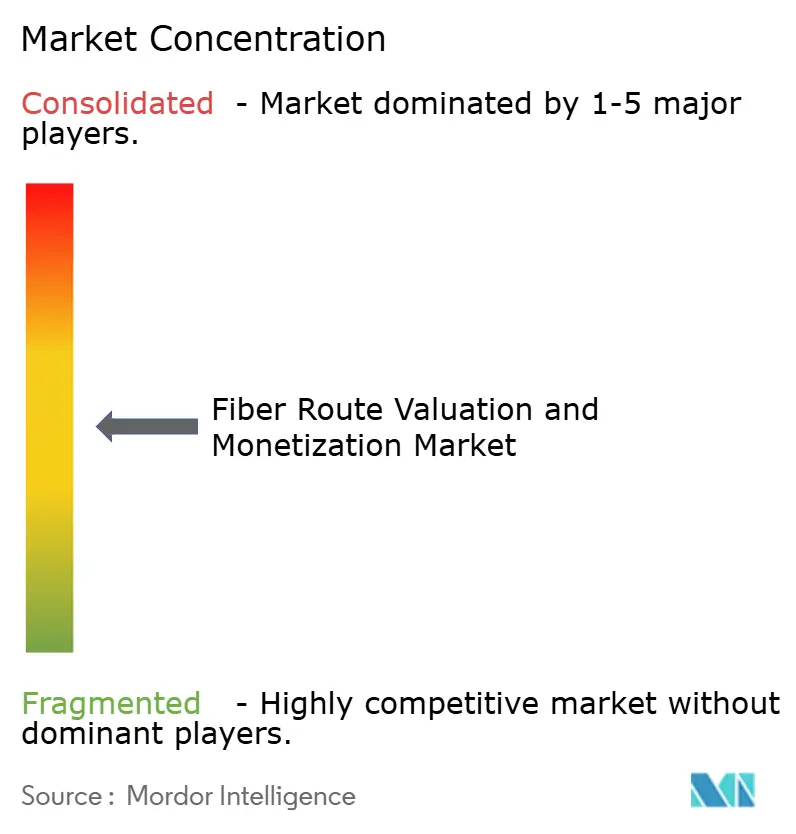
The Fiber route valuation and monetization market is moderately consolidated at the global level. Large infrastructure providers compete for anchor tenants, while regional operators rely on dense local networks and specific corridor knowledge. Consolidation has moved assets toward companies that can fund expansion and secure large customers. In May 2026, Zayo completed its USD 4.25 billion acquisition of Crown Castle’s Fiber Solutions business, expanding its network to 224,000 fiber route miles. The transaction increased Zayo’s wholesale reach across North America and demonstrated how acquisitions can secure routes that would take years to build.
EXA Infrastructure has pursued a combined terrestrial and subsea platform. The company refinanced its facilities and raised substantial funding to support network expansion and acquisition activity. Its approach combines North Atlantic routes, cable landing stations, and a pan-European terrestrial network. Project Visegrád uses corridors near the Druzhba oil pipeline, which can reduce dependence on conventional road-based rights of way and lower permitting exposure in underserved locations. The strategy allows the company to offer route diversity across terrestrial and subsea systems in the Fiber route valuation and monetization market.
Smaller providers including Arelion, euNetworks, GlobalConnect, and RETN compete in selected corridors by emphasizing route diversity, low latency, and access to cable landing stations. Arelion strengthened its Nordic and Baltic network in January 2026 to support expanding AI-related capacity needs. Security and critical-infrastructure rules favor providers that can document physical security and jurisdictional routing. The Fiber route valuation and monetization market has remaining demand in corridors connecting power-rich secondary data center locations and in sovereign-grade paths across Southeast Asia, East Africa, and the Gulf.
Fiber Route Valuation and Monetization Industry Leaders
-
Lumen Technologies, Inc.
-
Zayo Group Holdings, Inc.
-
Colt Technology Services Group Limited
-
Verizon Communications Inc.
-
AT&T Inc.
- *Disclaimer: Major Players sorted in no particular order
Fiber Route Valuation and Monetization Market Companies Covered in this Report
- AT&T Inc.
- Lumen Technologies, Inc.
- Zayo Group Holdings, Inc.
- Colt Technology Services Group Limited
- Verizon Communications Inc.
- Crown Castle Inc.
- Comcast Corporation
- Cogent Communications Holdings, Inc.
- EXA Infrastructure
- Arelion Sweden AB
- euNetworks Group Limited
- FirstLight Fiber, Inc.
- FiberLight, LLC
- GTT Communications, Inc.
- Consolidated Communications Holdings, Inc.
- Eurofiber Nederland B.V.
- GlobalConnect A/S
- RETN Limited
- UFINET Telecom, S.L.U.
- Dark Fibre Africa Proprietary Limited
Recent Industry Developments in Fiber Route Valuation and Monetization Market
- July 2026: The International Telecommunication Union published the International Advisory Body on Submarine Cable Resilience report, recommending practical guidance to accelerate cable deployment through strengthened legal and regulatory frameworks, mitigation of cable infrastructure risks, and promotion of route diversity and redundancy worldwide. The report directly shapes procurement standards for publicly funded route development projects across member states.
- May 2026: Zayo completed its USD 4.25 billion acquisition of Crown Castle's Fiber Solutions business, expanding its metro fiber footprint and enterprise reach to 224,000 fiber route miles across North America. Concurrent with the closing, Zayo and Arium Networks, the EQT entity that acquired Crown Castle's Small Cells business, entered into a long-term commercial agreement for Zayo to supply fiber to the Small Cells business.
- May 2026: RETN launched a new Point of Presence in Barcelona providing direct connectivity to Milan via the 2Africa submarine cable system, offering full physical path diversification compared with traditional terrestrial connections and reduced latency across the route.
- January 2026: Uniti Wholesale announced a landmark 1,100-route-mile dark fiber network expansion across the U.S. South-Central region, anchored by a 20-year customer contract with a total contract value exceeding USD 500 million. Phase 1 deliveries began connecting Tulsa to Little Rock and Little Rock to Memphis, establishing backbone infrastructure for AI data center markets in the region.
Global Fiber Route Valuation and Monetization Market Report Scope
Fiber Route Valuation and Monetization Market refers to advisory, analytics, and transaction services that assess the financial value of fiber-optic routes, strands, ducts, rights-of-way, and available network capacity. It covers lit fiber, dark fiber, metro and long-haul routes, backbone networks, subsea connections, and fiber infrastructure owned by telecom operators, utilities, municipalities, and infrastructure companies.
The Fiber Route Valuation and Monetization Market Report is Segmented by Fiber Asset Type (Single-Mode, Multi-Mode, Glass Fiber, and Plastic Optical Fiber), Network Type (Long-Haul, Metro, Submarine, Local Access), Customer Type (Telecom, Data Centers, Hyperscalers, Enterprise, and Government), Application (Data Transmission, DCI, 5G Backhaul, Industrial Automation, Military and Defense Communications, and Network Redundancy and Disaster Recovery), and Geography (North America, South America, Europe, Asia-Pacific, Middle East, and Africa). The Market Forecasts are Provided in Terms of Value (USD).
Segmentation Overview
| Single-Mode Fiber |
| Multi-Mode Fiber |
| Glass Fiber |
| Plastic Optical Fiber |
| Long-Haul Networks |
| Metro Networks |
| Submarine Networks |
| Local Access and Fiber-to-the-Building Networks |
| Telecom and Internet Service Providers |
| Data Centers and Cloud Providers |
| Hyperscale Technology Companies |
| Enterprise and Private Network Operators |
| Government and Defense Organizations |
| Other Customer Types |
| Data Transmission and Telecommunications |
| Data Center Interconnect |
| Enterprise Networking |
| 5G Backhaul and Fronthaul |
| Industrial Automation |
| Military and Defense Communications |
| Network Redundancy and Disaster Recovery |
| North America | United States |
| Canada | |
| Mexico | |
| South America | Brazil |
| Argentina | |
| Rest of South America | |
| Europe | Germany |
| United Kingdom | |
| France | |
| Spain | |
| Italy | |
| Rest of Europe | |
| Asia-Pacific | China |
| Japan | |
| India | |
| South Korea | |
| Rest of Asia-Pacific | |
| Middle East | Saudi Arabia |
| United Arab Emirates | |
| Turkey | |
| Rest of Middle East | |
| Africa | South Africa |
| Egypt | |
| Nigeria | |
| Rest of Africa |
| By Fiber Asset Type | Single-Mode Fiber | |
| Multi-Mode Fiber | ||
| Glass Fiber | ||
| Plastic Optical Fiber | ||
| By Network Type | Long-Haul Networks | |
| Metro Networks | ||
| Submarine Networks | ||
| Local Access and Fiber-to-the-Building Networks | ||
| By Customer Type | Telecom and Internet Service Providers | |
| Data Centers and Cloud Providers | ||
| Hyperscale Technology Companies | ||
| Enterprise and Private Network Operators | ||
| Government and Defense Organizations | ||
| Other Customer Types | ||
| By Application | Data Transmission and Telecommunications | |
| Data Center Interconnect | ||
| Enterprise Networking | ||
| 5G Backhaul and Fronthaul | ||
| Industrial Automation | ||
| Military and Defense Communications | ||
| Network Redundancy and Disaster Recovery | ||
| By Geography | North America | United States |
| Canada | ||
| Mexico | ||
| South America | Brazil | |
| Argentina | ||
| Rest of South America | ||
| Europe | Germany | |
| United Kingdom | ||
| France | ||
| Spain | ||
| Italy | ||
| Rest of Europe | ||
| Asia-Pacific | China | |
| Japan | ||
| India | ||
| South Korea | ||
| Rest of Asia-Pacific | ||
| Middle East | Saudi Arabia | |
| United Arab Emirates | ||
| Turkey | ||
| Rest of Middle East | ||
| Africa | South Africa | |
| Egypt | ||
| Nigeria | ||
| Rest of Africa | ||
Key Questions Answered in the Report
What is the size of the fiber route valuation and monetization market?
The market was USD 2.79 billion in 2026 and is forecast to reach USD 5.96 billion by 2031, at a 16.41% CAGR. These figures reflect the increasing value assigned to routes that serve AI and data center demand, especially when those routes have diverse paths, clear records, and capacity for later upgrades.
What is driving demand for fiber route valuation and monetization?
AI clusters, data center interconnect, 5G densification, and sovereign cloud requirements are increasing demand for dedicated and diverse fiber routes. Long-term IRU agreements can also provide a clearer contractual basis for new route investment and help owners plan capacity commitments before civil work begins.
Which fiber asset type has the largest revenue share?
Single-Mode Fiber held 68.22% revenue share in 2025 because it is used for long-haul, metro core, and high-capacity campus links. It remains important where transmission distance, high bandwidth needs, and later capacity upgrades influence a buyers procurement decision.
Which network type is expanding the fastest?
Submarine Networks are projected to expand at a 16.88% CAGR through 2031 as customers seek dedicated transoceanic capacity and route diversity. Cable resilience, alternative paths, and the need to protect critical international connections are also shaping investment decisions for owners, carriers, cloud providers, and public-sector buyers.
Which customer group is expanding the fastest?
Hyperscale Technology Companies are projected to expand at a 16.93% CAGR through 2031 as they seek more direct control over fiber capacity. Their long-duration commitments can help underwrite routes that link large computing locations with cloud regions and backbone networks.
Which region has the fastest projected expansion?
Asia-Pacific is projected to expand at a 17.21% CAGR through 2031, supported by data center growth and terrestrial and subsea network investment. India, Japan, and South Korea are among the key locations discussed, alongside new regional demand for data center and cable connectivity that links national networks with international routes across markets.