Market Overview
| Study Period | 2019 - 2030 |
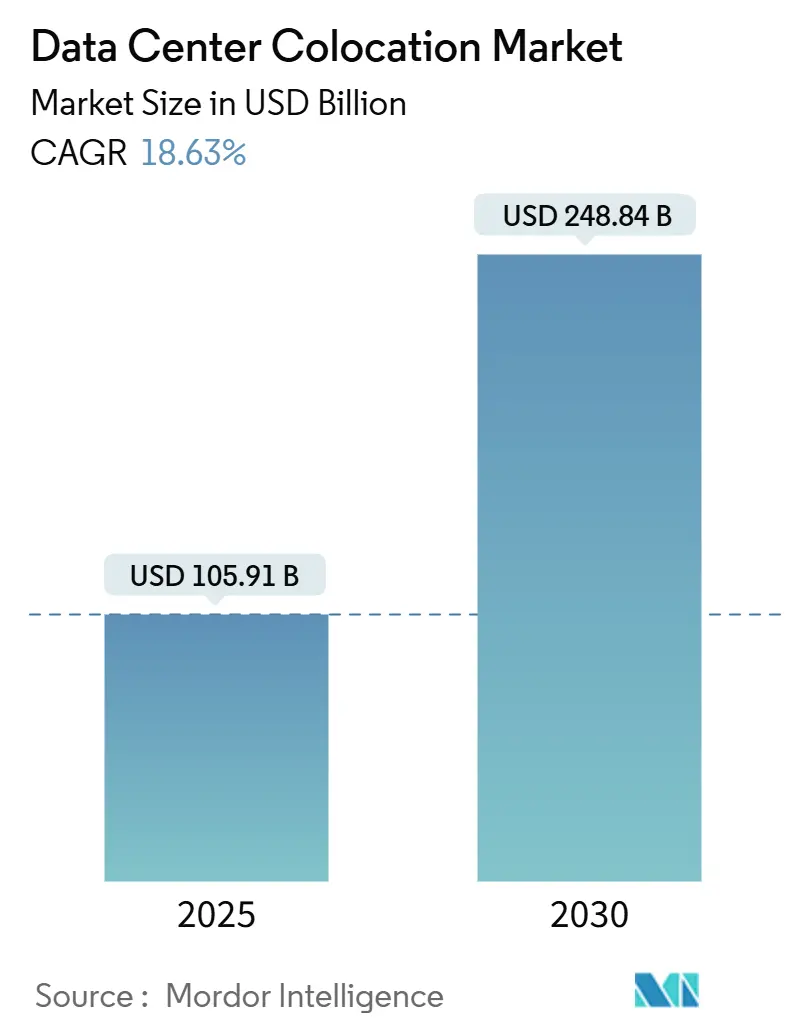
| Market Size (2025) | USD 105.91 Billion |
| Market Size (2030) | USD 248.84 Billion |
| Growth Rate (2025 - 2030) | 18.63% CAGR |
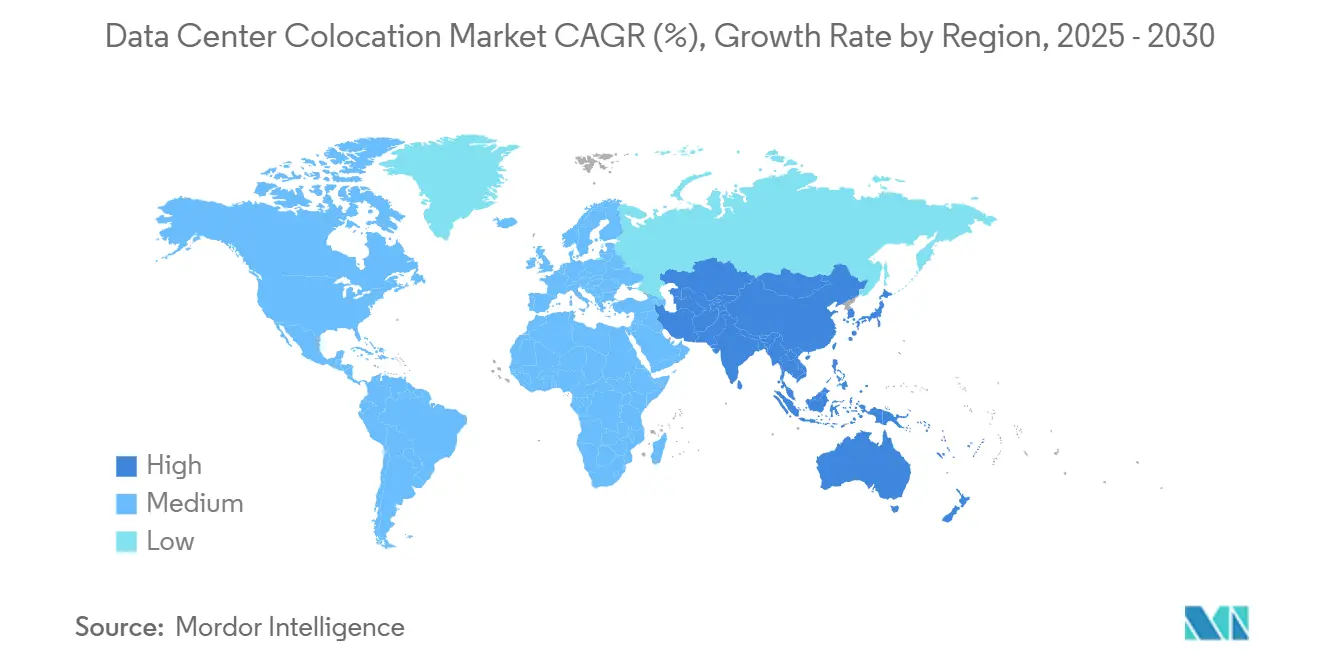
| Fastest Growing Market | Asia Pacific |
| Largest Market | North America |
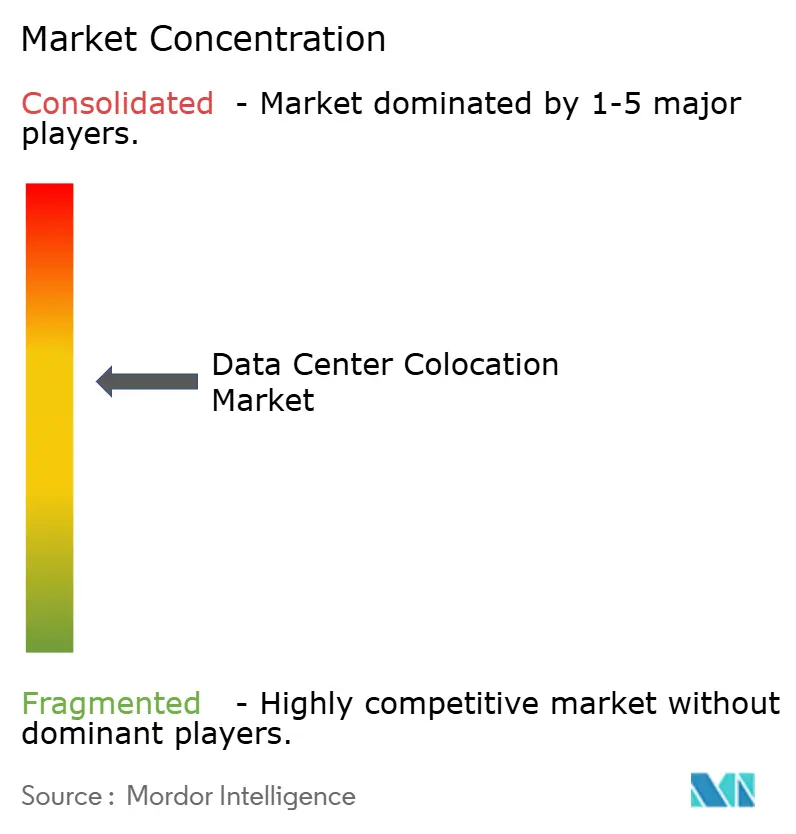
| Market Concentration | Medium |
Major Players
*Disclaimer: Major Players sorted in no particular order Image © Mordor Intelligence. Reuse requires attribution under CC BY 4.0. |
|
Data Center Colocation Market Analysis by Mordor Intelligence
The global data center colocation market stands at USD 105.91 billion in 2025 and is on track to reach USD 284.84 billion by 2030, advancing at an 18.63% CAGR. Rising artificial-intelligence workloads, tightening data-sovereignty rules and a pivot toward nuclear-assisted mega campuses are widening the addressable opportunity for colocation operators. Enterprises are retiring captive server rooms in favor of third-party facilities that offer cloud on-ramps, high-density liquid cooling and renewable-energy backed power purchase agreements. At the same time, private-equity backed roll-ups are accelerating platform scale while hyperscale pre-leases are anchoring multi-megawatt builds. Taken together, these forces elevate the data center colocation market to mission-critical infrastructure status for the hybrid-IT era.
Key Report Takeaways
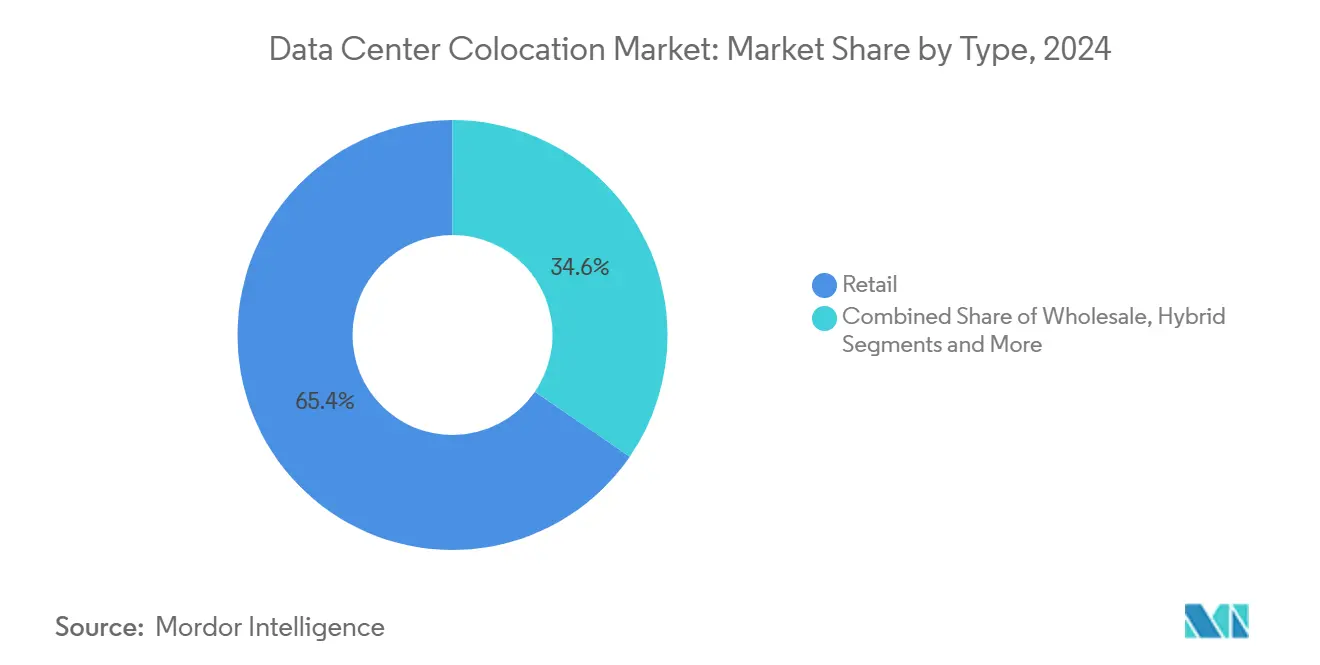
- By type, retail facilities led with 65.41% revenue share in 2024, while wholesale deployments are projected to grow at a 21.80% CAGR through 2030.
- By tier, Tier III sites accounted for 54.75% of the data center colocation market size in 2024; Tier IV footprints are expanding at a 22.20% CAGR to 2030.
- By enterprise size, large enterprises retained 45.89% demand in 2024, whereas hyperscale and cloud providers are forecast to post a 25.40% CAGR through 2030.
- By end user, IT and telecom captured 29.25% of the data center colocation market share in 2024; its AI-focused sub-segment is scaling at 24.60% CAGR.
- By geography, North America retained 40.36% demand in 2024, whereas Asia-Pacific and cloud providers are forecast to post a 25.90% CAGR through 2030
Global Data Center Colocation Market Trends and Insights
Drivers Impact Analysis
| Driver | (~) % Impact on CAGR Forecast | Geographic Relevance | Impact Timeline |
|---|---|---|---|
| Cloud and SaaS integration | +3.2% | North America, APAC | Medium term (2-4 years) |
| IoT, AI and edge data proliferation | +4.1% | APAC, North America | Long term (≥ 4 years) |
| Stricter data-sovereignty mandates | +2.8% | Europe, APAC | Medium term (2-4 years) |
| Small-modular-reactor power adoption | +1.9% | North America, select EU | Long term (≥ 4 years) |
| AI-driven liquid-cool density | +3.7% | Global metros | Short term (≤ 2 years) |
| Sovereign-AI hosting needs | +2.1% | APAC, Middle East | Medium term (2-4 years) |
Source: Mordor Intelligence
Increasing Integration of Cloud and SaaS Workloads
Hybrid-IT architectures now dominate enterprise roadmaps, pushing organizations to house latency-sensitive workloads in colocation facilities that sit one cross-connect away from major public clouds. Direct-connect ports to an average of 15–20 cloud platforms are becoming table stakes, enabling tenants to shrink egress fees and simplify regulatory compliance for multi-cloud deployments.[1]CBRE, “Global Data Center Trends 2025,” cbre.com Interconnection services already contribute 18% of total revenue for market leaders as customers accept 20–30% price premiums for plug-and-play cloud proximity.
Proliferation of Data from IoT/AI and Edge Workloads
Generative-AI training clusters routinely draw 40–80 kW per rack, a power envelope unsustainable in legacy air-cooled halls. Operators are therefore fitting liquid manifolds and immersion tanks to support GPU rigs that devour 3–5 times the electricity of traditional racks. Parallel edge rollouts place micro-nodes near factories, stadia and telco towers, all funneling traffic back to hub colocation sites via dark-fiber rings. This hub-and-spoke topology lets enterprises run real-time analytics while maintaining centralized governance.
Stricter Data-Sovereignty Laws Boosting In-Country Demand
Frameworks such as the EU Digital Services Act compel multinationals to store citizens’ data locally, which in turn is prompting an upsurge of new builds in every major economic bloc. Banks and payment processors are among the earliest movers, contracting dual-site capacity to satisfy redundant in-country hosting rules while still tapping provider-operated disaster-recovery nodes.[2]Equinix, “Regulatory Readiness and Data-Sovereignty Playbook,” equinix.com Compliance complexities are spawning consulting side businesses for operators able to guide tenants through labyrinthine cross-border transfer restrictions.
AI-Driven Workload Density Requiring Liquid-Cool-Ready Suites
Next-generation accelerator cards push thermal footprints that exceed 1,000 W per board, forcing designers to abandon raised-floor airflow in favor of rear-door heat exchangers and closed-loop direct-to-chip plumbing. Build-outs that advertise “AI-ready” floors now command 40–60% higher lease rates, a premium that offsets the 15–25% capex uplift associated with liquid systems.[3]Corning, “Optical and Thermal Solutions for Next-Gen Data Centers,” corning.com Hyperscalers routinely block-reserve entire mezzanines to guarantee contiguous power blocks for forthcoming AI farms.
Restraints Impact Analysis
| Restraint | (~ ) % Impact on CAGR Forecast | Geographic Relevance | Impact Timeline |
|---|---|---|---|
| High up-front build cost amid rate pressure | -2.4% | North America, Europe | Short term (≤ 2 years) |
| Grid-power and land shortages in tier-1 metros | -3.1% | North America, Europe, APAC | Medium term (2-4 years) |
| Carbon-tax escalation | -1.8% | Europe, North America, APAC | Long term (≥ 4 years) |
| Rising climate-risk insurance premiums | -1.2% | Global | Medium term (2-4 years) |
Source: Mordor Intelligence
High Up-Front Build Cost Amid Elevated Interest Rates
Average U.S. shell-and-core outlays climbed to USD 468.66 per sq ft in 2024 as steel, switchgear and fuel prices rose in tandem with financing costs. Developers are mitigating sticker shock through prefabricated modules, asset-backed securitizations and credit-tenant leases, but permitting queues still stretch delivery cycles to 18–24 months. Balance-sheet strength is therefore becoming a competitive advantage as nimble buyers pre-fund capacity before rivals even secure zoning approval.
Chronic Grid-Power and Land Shortages in Tier-1 Metros
Northern Virginia’s largest utility warned that new interconnections may wait up to eight years, a delay that risks stranding pipeline projects and pushing operators toward secondary markets with surplus renewables. As 300-acre campuses replace suburban 10-MW pods, well-capitalized hyperscalers are outbidding conventional providers for industrial-zoned parcels close to robust substations. The result is a two-speed market in which metro-core power scarcity coexists with greenfield abundance in less congested corridors.
Segment Analysis
By Type: Wholesale Expansion Accelerates Despite Retail Dominance
Retail facilities led with 65.41% revenue share in 2024, generating the majority of colocation invoices, yet wholesale blocks greater than 5 MW are eclipsing legacy rooms as cloud providers pre-lease contiguous megawatt tranches. Hyperscalers favor long-run power visibility and dedicated cages, which translates into 15-year contracts that underpin developer financing. Powered-shell offerings hit the sweet spot for customers that want bespoke layouts without waiting for greenfield constructions. Modular pods positioned at metro edges further blur the lines between retail and wholesale, enabling rapid stand-ups near 5G aggregation points.
Wholesale deployments are projected to grow at a 21.80% CAGR through 2030. Hybrid configurations are therefore rewriting go-to-market playbooks. Providers that historically specialized in sub-1 MW footprints are embedding wholesale wings inside urban campuses, while traditional shell landlords roll out concierge services to compete for smaller tickets. This convergence keeps the data center colocation market in flux and gives mid-market tenants more optionality than ever before.
Note: Segment shares of all individual segments available upon report purchase
By Tier: Tier IV Growth Outpaces Established Tier III Market
Tier III sites accounted for 54.75% of the data center colocation market size in 2024. Tier III plants remain the backbone of enterprise hybrid clouds due to their proven 99.982% availability level. Insurance auditors and boards recognize the certification, so CFOs seldom question its cost premium. However, AI model training, algorithmic trading desks and tele-medicine platforms are pushing some operators to upgrade to concurrently maintainable, fault-tolerant Tier IV blueprints. Those blueprints guarantee 99.995% uptime and eliminate single points of failure across feeders, chillers, and buses, commanding fees roughly half again higher than Tier III racks.
Tier IV footprints are expanding at a 22.20% CAGR to 2030. Experiments with Tier V concepts aimed at quantum and defense workloads are underway, but are commercially nascent. Meanwhile, Tier I-II footprints continue to lose relevance outside of dev-test sandboxes. The bifurcating tier mix underscores the need for operators to match facility class with application criticality rather than pursue a one-size-fits-all estate.
By Enterprise Size: Hyperscale Demand Reshapes Market Dynamics
Large enterprises still occupy almost half of the leased white space, and large enterprises retained 45.89% demand in 2024, a testament to ongoing mainframe repatriation and ERP modernization cycles. Yet the fastest climbing line item on colocation order books comes from hyperscale buyers that can consume a 50 MW tranche in a single phase. Hyperscale and cloud providers are forecast to post a 25.40%. Their share of total booked megawatts is doubling every two to three years, forcing data center colocation market participants to tweak electrical topologies and negotiate multi-decade PPAs to lock pricing.
As a result, providers are spinning up xScale-branded campuses with simplified corridor designs, six-foot truss heights and direct high-voltage feeds. These builds slash day-two visits and site tours, as hyperscalers manage their own servers behind opaque cages. For operators, the trade-off is lower gross margin per kilowatt but far higher revenue certainty over a much longer term.

Note: Segment shares of all individual segments available upon report purchase
By End-User Industry: AI Transformation Accelerates IT-Sector Growth
The IT-and-telecom vertical is set to widen its lead as AI inference traffic proliferates across content delivery, mobile networks and gaming. IT and telecom captured 29.25% of the data center colocation market share in 2024; its AI-focused sub-segment is scaling at 24.60% CAGR. Cloud-native software houses want direct express-route pipes into GPU farms, while telcos require localized edge rooms to collapse latency budgets for 5G slices. Banking and insurance firms rank second in incremental demand as algorithmic risk models, real-time fraud analytics, and e-payment clearing all gravitate to low-jitter silicon sitting less than one millisecond from trading engines.
E-commerce, media streaming, and healthcare trail close behind, each chasing their own flavor of real-time engagement or regulatory constraint. Whether driven by HIPAA, PSD2, or local payment rules, their infrastructure workbooks converge on the same outcome: reserve rack footprints in third-party facilities that guarantee deterministic power, cooling, and cross-connects. As those requirements solidify, the data center colocation market size allotted to application-specific hall designs continues to rise.
Geography Analysis
North America retained 40.36% demand in 2024, North America remains the largest revenue contributor thanks to decades of dark-fiber build-out, dense internet-exchange fabrics, and a mature hyperscale footprint that underpins cloud GDP. Power moratoriums in Northern Virginia and Silicon Valley, however, are steering new demand to Phoenix, Columbus, and Montréal, where utilities can still green-light 100 MW blocks inside 24 months. Local governments in these secondary hubs court developers with tax holidays and expedited permitting, tempering the land-scarcity issues dogging legacy metros.
Asia–Pacific is the fastest mover, Asia-Pacific is forecast to post a 25.90% CAGR through 2030. China’s digital-public-infrastructure drive, India’s commerce-cloud adoption, and Japan’s stringent data-residency amendments are all piling megawatt orders into regional pipelines. Singapore has reinstated a constrained build quota, funneling spill-over demand to Johor and Batam. Meanwhile, Australia, Indonesia and the Philippines are receiving first-time hyperscale commitments, positioning the bloc to outpace every other continent in incremental capacity through 2030.
Europe, South America and the Middle East-Africa corridor form the third growth tier. Frankfurt, Dublin and Madrid handle continental overflow as Amsterdam imposes stricter energy-efficiency hurdles. São Paulo is emerging as a southern-hemisphere hub, whereas Riyadh is leveraging sovereign capital to erect new digital corridors linked to Vision 2030 goals. Across all regions, renewable accessibility and streamlined grid interconnections are decisive site-selection filters, making wind-rich Patagonia and solar-dense Emirates unexpectedly attractive for the next wave of builds.
Competitive Landscape
The top 15 operators collectively control roughly half of global leased power, with Equinix, Digital Realty and China Telecom occupying the first three slots. Equinix alone claims an 11% global share and continues to layer software-defined interconnection atop its campus model. Digital Realty has sharpened its focus on multi-tenant wholesale halls following its Interxion integration, while China Telecom leverages domestic fiber dominance to expand outside Greater China.
Consolidation set new records in 2024 as private-equity sponsors closed USD 40 billion worth of mergers and carve-outs, a figure likely to be eclipsed again in 2025. Blackstone’s purchase of AirTrunk and KKR’s interest in Europe’s Global Switch underscore a shift toward infrastructure-fund ownership models that prize 20-year power-purchase annuities over transient technology bets. Competitive wedges now center on liquid-cool enablement, sovereign-AI accreditation and guaranteed carbon-free energy portfolios. Regional specialists are responding by forging utility joint ventures, signing small-modular-reactor MOUs or leasing entire solar farms to stay in the hunt.
Data Center Colocation Industry Leaders
-
Equinix Inc.
-
Digital Realty Trust Inc.
-
NTT Global Data Centers
-
CyrusOne Inc.
-
CoreSite Realty Corp.
- *Disclaimer: Major Players sorted in no particular order
Need More Details on Market Players and Competitors?
Download PDF
Recent Industry Developments
- February 2025: CapitaLand Investment unveiled a USD 700 million, 50 MW Osaka project aimed at hyperscale tenants.
- January 2025: Indosat Ooredoo Hutchison and BDx Indonesia agreed to co-develop new Indonesian data centers to back the nation’s digital-economy roadmap.
- December 2024: Iliad Group and InfraVia formed a pan-European hyperscale platform to accelerate regional cloud growth.
- September 2024: Princeton Digital Group purchased Yahoo’s SG3 Singapore site, boosting its APAC hyperscale footprint.
Global Data Center Colocation Market Report Scope
Colocation is when organizations place their own servers and other essential computing hardware for data storage in space rented in a physical data center owned and/or operated by a third party. Typically, colocation services include the building in which everything is housed, as well as networking, physical security, redundant power and redundant cooling components, which then support the servers and storage provided by the customer.
The data center colocation market is segmented by type (retail, wholesale, hybrid), by tier (tier 1 and 2, tier 3, tier 4), by enterprises (SMEs, large enterprises), by end-users (BFSI, IT and telecom, e-commerce, government, manufacturing, media and entertainment, other end-users), by geography (North America, Europe, Asia-Pacific, Latin America, Middle East and Africa). The market sizes and forecasts are provided in terms of value (USD) for all the above segments.
| By Type | Retail | |||
| Wholesale | ||||
| Hybrid | ||||
| Powered-Shell | ||||
| Modular / Edge Pods | ||||
| By Tier | Tier I and II | |||
| Tier III | ||||
| Tier IV | ||||
| By Enterprise Size | SMEs | |||
| Large Enterprises | ||||
| Hyperscale / Cloud Providers | ||||
| By End-user Industry | BFSI | |||
| IT and Telecom | ||||
| E-commerce and Retail | ||||
| Government and Defense | ||||
| Manufacturing and Industrial IoT | ||||
| Media and Entertainment | ||||
| Healthcare and Life Sciences | ||||
| Energy and Utilities | ||||
| By Geography | North America | United States | ||
| Canada | ||||
| Mexico | ||||
| South America | Brazil | |||
| Argentina | ||||
| Rest of South America | ||||
| Europe | United Kingdom | |||
| Germany | ||||
| France | ||||
| Italy | ||||
| Spain | ||||
| Russia | ||||
| Rest of Europe | ||||
| Asia-Pacific | China | |||
| Japan | ||||
| India | ||||
| South Korea | ||||
| Australia and New Zealand | ||||
| Rest of Asia-Pacific | ||||
| Middle East and Africa | Middle East | Saudi Arabia | ||
| UAE | ||||
| Turkey | ||||
| Rest of Middle East | ||||
| Africa | South Africa | |||
| Nigeria | ||||
| Kenya | ||||
| Rest of Africa | ||||
By Type
| Retail |
| Wholesale |
| Hybrid |
| Powered-Shell |
| Modular / Edge Pods |
By Tier
| Tier I and II |
| Tier III |
| Tier IV |
By Enterprise Size
| SMEs |
| Large Enterprises |
| Hyperscale / Cloud Providers |
By End-user Industry
| BFSI |
| IT and Telecom |
| E-commerce and Retail |
| Government and Defense |
| Manufacturing and Industrial IoT |
| Media and Entertainment |
| Healthcare and Life Sciences |
| Energy and Utilities |
By Geography
| North America | United States | ||
| Canada | |||
| Mexico | |||
| South America | Brazil | ||
| Argentina | |||
| Rest of South America | |||
| Europe | United Kingdom | ||
| Germany | |||
| France | |||
| Italy | |||
| Spain | |||
| Russia | |||
| Rest of Europe | |||
| Asia-Pacific | China | ||
| Japan | |||
| India | |||
| South Korea | |||
| Australia and New Zealand | |||
| Rest of Asia-Pacific | |||
| Middle East and Africa | Middle East | Saudi Arabia | |
| UAE | |||
| Turkey | |||
| Rest of Middle East | |||
| Africa | South Africa | ||
| Nigeria | |||
| Kenya | |||
| Rest of Africa | |||
Need A Different Region or Segment?
Customize Now
Key Questions Answered in the Report
What is the current value of the data center colocation market and its growth outlook?
The market stands at USD 105.91 billion in 2025 and is projected to reach USD 284.84 billion by 2030, implying an 18.63% CAGR.
Why are hyperscale cloud providers driving wholesale colocation demand?
Hyperscalers lease multi-megawatt blocks that require dedicated power and cooling, favoring wholesale halls for their scale economics and 15-year contract terms.
How are data-sovereignty regulations influencing facility location decisions?
Laws compelling localized storage push enterprises to place workloads inside in-country colocation sites, spurring new builds in Europe, APAC and emerging markets.
What cooling technologies are gaining traction for AI workloads?
Direct-to-chip and immersion liquid cooling are replacing traditional air systems to support rack densities up to 100 kW.

