
Broadband Experience Analytics Market Size and Share
Market Overview
| Study Period | 2020 - 2031 |
|---|---|
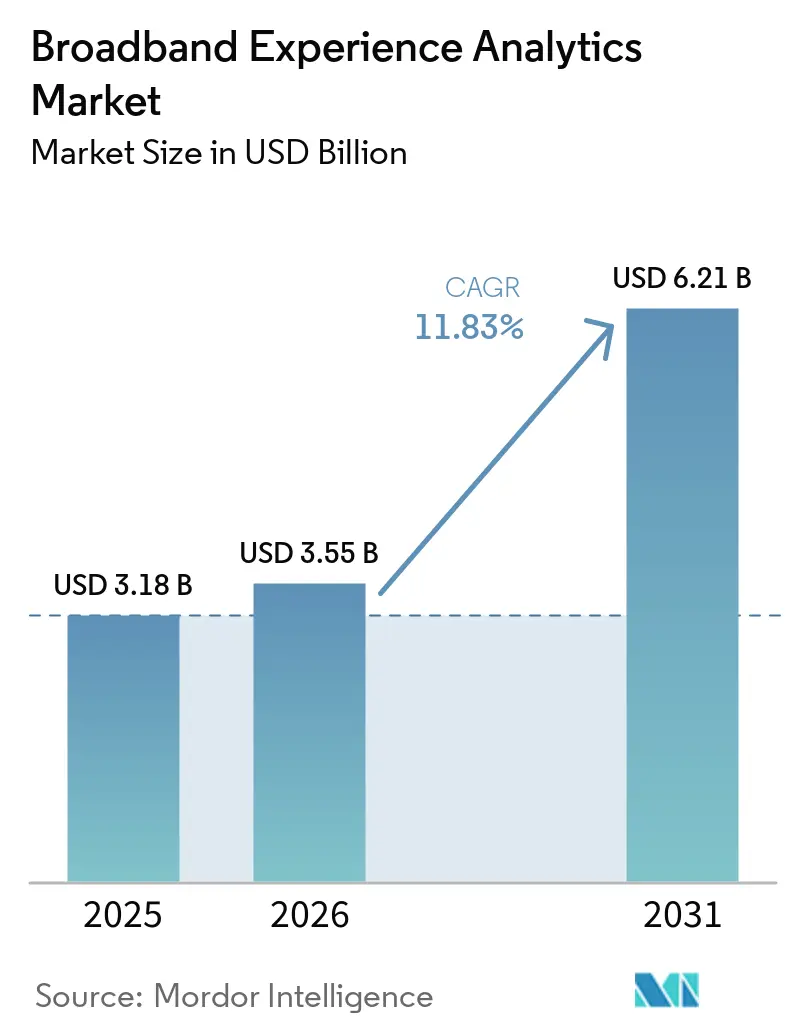
| Market Size (2026) | USD 3.55 Billion |
| Market Size (2031) | USD 6.21 Billion |
| Growth Rate (2026 - 2031) | 11.83 % |
| Fastest Growing Market | Asia-Pacific |
| Largest Market | North America |
| Market Concentration | Medium |
Major Players *Disclaimer: Major Players sorted in no particular order Image © Mordor Intelligence. Reuse requires attribution under CC BY 4.0. | |
Broadband Experience Analytics Market Analysis by Mordor Intelligence
The Broadband Experience Analytics Market size is projected to expand from USD 3.18 billion in 2025 and USD 3.55 billion in 2026 to USD 6.21 billion by 2031, registering a CAGR of 11.83% between 2026 to 2031. The broadband experience analytics market is being shaped by higher subscriber expectations for dependable, real-time connectivity and by the expansion of fiber, fixed wireless access, and multi-gigabit networks. Operators are placing greater value on measured service quality because advertised bandwidth alone does not reflect the actual customer experience. This change moves analytics from a network support function toward a tool for retention, service differentiation, and revenue protection. Gaps between contracted performance and delivered service increase commercial risk for operators that cannot measure and address experience problems at the subscriber level. Vendors are responding with platforms that link network data to customer outcomes and integrate with automated operations workflows.
Key Report Takeaways
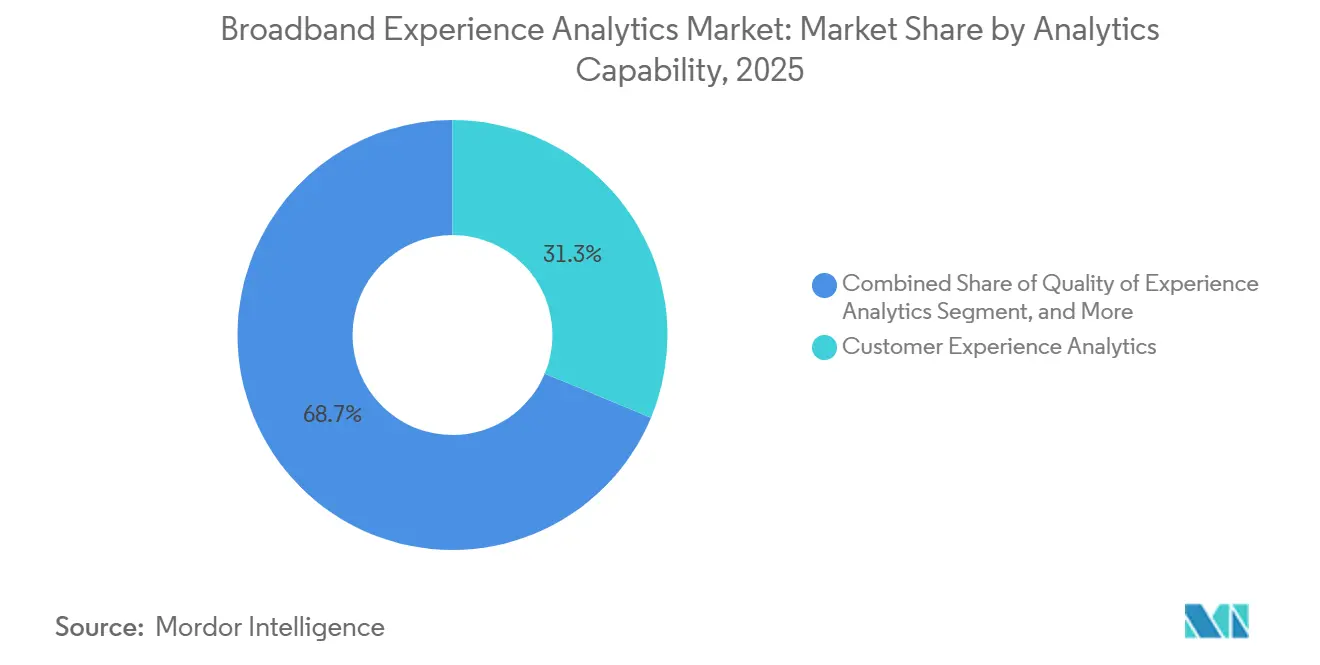
- By analytics capability, Customer Experience Analytics held 31.28% of the broadband experience analytics market share in 2025, while Quality of Experience Analytics is projected to expand at a 12.12% CAGR through 2031.
- By deployment, cloud accounted for 57.77% of the broadband experience analytics market share in 2025 and is projected to expand at a 12.24% CAGR through 2031.
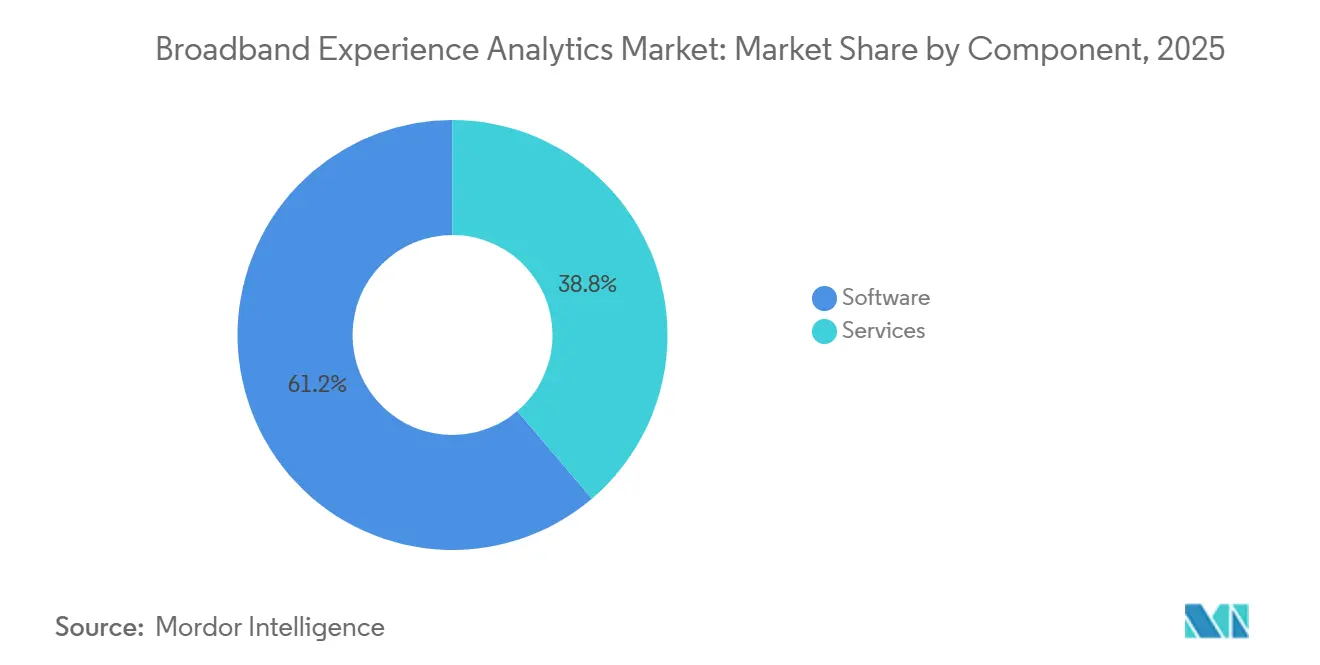
- By component, software held 61.23% share in 2025, while managed services is projected to expand at a 12.66% CAGR through 2031.
- By provider type, Broadband Internet Service Providers held 34.66% share in 2025, while Managed Service Providers are projected to expand at a 12.62% CAGR through 2031.
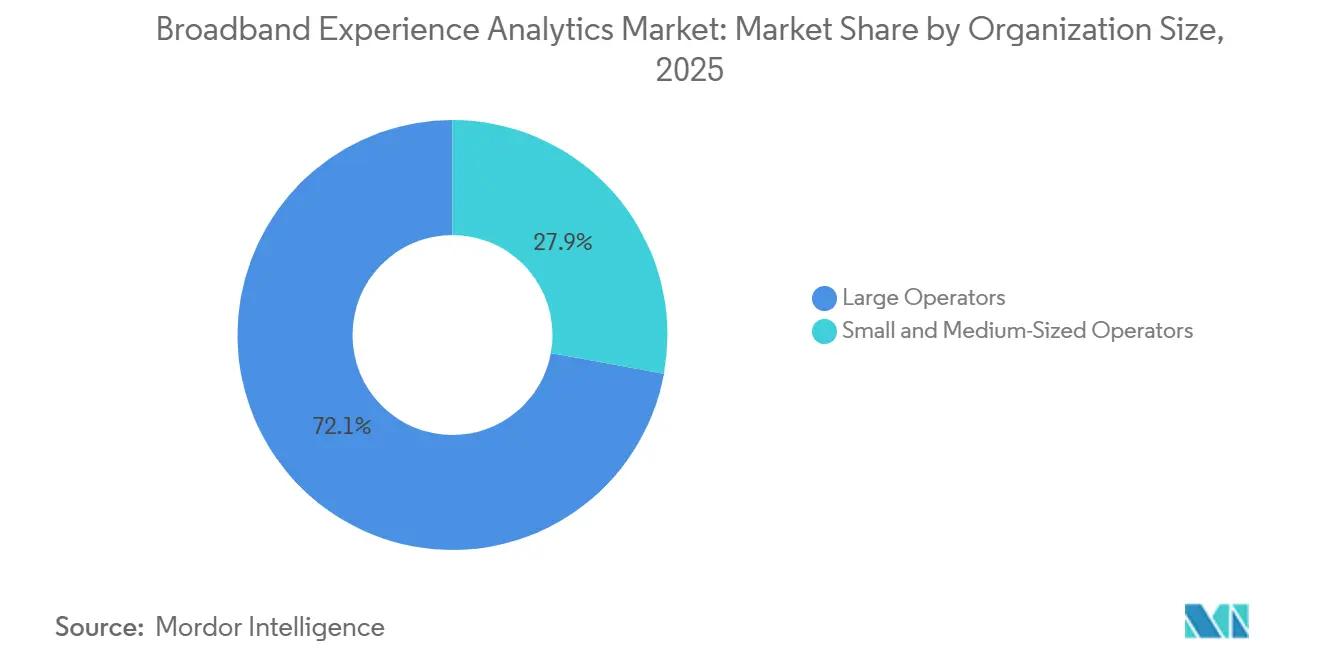
- By organization size, large operators held 72.11% share in 2025, while small and medium-sized operators are projected to expand at a 12.14% CAGR through 2031.
- By application, Network Performance Management held 26.88% share in 2025, while Churn Prediction and Retention Analytics is projected to expand at a 12.72% CAGR through 2031.
- By geography, North America held 30.27% share in 2025, while Asia-Pacific is projected to expand at a 12.58% CAGR through 2031.
Note: Market size and forecast figures in this report are generated using Mordor Intelligence’s proprietary estimation framework, updated with the latest available data and insights as of January 2026.
Market Trends and Insights
Drivers Impact Analysis of Broadband Experience Analytics Market*
| Driver | (~) % Impact on CAGR Forecast | Geographic Relevance | Impact Timeline |
|---|---|---|---|
| Rising Subscriber Expectations for Consistent Broadband Experience | +2.8% | Global, highest intensity in North America, Western Europe, and South Korea | Short term (≤ 2 years) |
| Fiber, Fixed Wireless Access, and Multi-Gigabit Network Expansion | +2.5% | North America, Europe, Asia-Pacific, and emerging adoption in the Middle East | Medium term (2-4 years) |
| AI-Enabled Predictive Network Assurance and Automated Remediation | +2.2% | Global, with advanced deployments in North America, Japan, South Korea, and Germany | Medium term (2-4 years) |
| Broadband Churn Reduction and Customer Lifetime Value Optimization | +1.8% | North America, Europe, and rapid uptake across Asia-Pacific | Short term (≤ 2 years) |
| Real-World Experience Benchmarking for Competitive Differentiation | +1.4% | Global, strongest in regulated markets with mandated quality reporting | Medium term (2-4 years) |
| Home Wi-Fi and In-Home Experience Visibility Gap | +1% | North America and Europe, with expanding use in Asia-Pacific through FTTR adoption | Medium term (2-4 years) |
| Source: Mordor Intelligence | |||
Rising Subscriber Expectations for Consistent Broadband Experience
Service quality has become central to subscriber retention in the broadband experience analytics market. Broadband providers need a clearer view of performance across the access network, applications, home Wi-Fi, and customer support journey. The European ePrivacy framework makes privacy-preserving measurement an important design requirement for deployments that process communications data. The UK Information Commissioner's Office states that traffic data requires suitable processing controls and should not be retained longer than necessary for its purpose.[1] This requirement increases demand in the broadband experience analytics market for platforms that can identify service issues without relying on unnecessary retention of personal data. The broadband experience analytics market, therefore, benefits when operators use subscriber-level evidence to resolve faults before they lead to repeat support interactions or switching decisions.
Fiber, Fixed Wireless Access, and Multi-Gigabit Network Expansion
Fiber, DOCSIS, fixed wireless access, and low-earth-orbit satellite services increasingly compete for the same household connections. This mix makes single-technology monitoring less useful because operators need to compare performance across different access methods. The Fiber Broadband Association reported that fiber reached a broad base of U.S. homes by the end of the year, with a substantial number of households connected and a moderate national take rate.[2] The Global Supplier Association reported continued commercial 5G fixed wireless access launches as of April 2026, with activity spanning Europe, the Middle East, and Africa.[3] These network expansions create greater demand in the broadband experience analytics market for systems that can track latency, jitter, gateway behavior, and Wi-Fi performance as customers move between access technologies. The broadband experience analytics market gains importance when providers need evidence for capacity planning and technology migration decisions.
AI-Enabled Predictive Network Assurance and Automated Remediation
Within the broadband experience analytics market, AI is shortening the time between detecting a network problem and taking corrective action. NTT DOCOMO began commercial operation of an agentic AI system for network maintenance in early 2026 across a large installed base of devices, including base stations and core network equipment. The company reported that the system significantly reduced complex-failure response time compared with previous manual analysis workflows. Nokia and Google Cloud announced in June 2026 that six Gemini-powered agents would be embedded in Nokia Assurance Center, with a SaaS release planned for September 2026. These deployments show why operators are seeking analytics that support fault triage and remediation rather than reporting alone. The broadband experience analytics market is strengthened by platforms that can demonstrate faster detection and restoration of service.
Broadband Churn Reduction and Customer Lifetime Value Optimization
Within the broadband experience analytics market, churn prediction is becoming more important because service quality problems can be identified before the subscriber contacts support. TechSee found in its recent survey that many U.S. households would consider switching if issues were not resolved quickly, while a significant share would switch for better whole-home coverage. Infovista reported that deployments of its Ativa broadband assurance platform resulted in fewer support tickets, improved service-level performance, and faster troubleshooting. These outcomes connect technical visibility with the commercial task of protecting customer lifetime value. Providers can also use accurate experience models to support enhanced Wi-Fi offers and service tiers with defined performance commitments. The broadband experience analytics market is supported by this shift from reactive troubleshooting toward proactive retention and service design.
Restraints Impact Analysis of Broadband Experience Analytics Market*
| Restraint | (~) % Impact on CAGR Forecast | Geographic Relevance | Impact Timeline |
|---|---|---|---|
| High Implementation and Integration Costs | -1.6% | Global, most acute for mid-tier and regional operators in North America, Europe, and Asia-Pacific | Short term (≤ 2 years) |
| Data Privacy, Residency, and Consent Constraints | -1.2% | Europe, with expanding national frameworks in Asia-Pacific and South America | Medium term (2-4 years) |
| Fragmented Telemetry and Limited Broadband Experience Data Standards | -0.9% | Global, especially multi-technology markets where fiber, fixed wireless access, and DOCSIS coexist | Medium term (2-4 years) |
| Difficulty Demonstrating Short-Term Return on Experience Investments | -0.7% | Global, strongest where capital cycles are compressed and analytics budgets receive close scrutiny | Short term (≤ 2 years) |
| Source: Mordor Intelligence | |||
High Implementation and Integration Costs
Deployments in the broadband experience analytics market must connect legacy probes, deep packet inspection systems, cloud collectors, and equipment from several vendors. This work can extend delivery schedules and increase the total cost of ownership, particularly outside the largest operator group. The challenge becomes greater when fiber, DOCSIS, and fixed wireless access layers produce data in different formats and at different levels of detail. Smaller regional operators may not have analytics engineering teams that can manage custom interfaces at scale. Managed services and cloud-based delivery can reduce this burden, but they may carry a higher recurring cost than self-operated systems. The broadband experience analytics market faces a constraint until vendors provide more pre-built connectors, simpler platforms, and pricing tied to operational outcomes.
Data Privacy, Residency, and Consent Constraints
The broadband experience analytics market relies on traffic-level analytics that can involve session records, application usage data, and device information that require careful handling under privacy rules. ITU-T Recommendation D.1141, approved in April 2025, sets out data-protection principles for big data used in international telecommunications and ICT services. These principles include anonymization, purpose limitation, and consent for cross-border analytics deployments. The European Data Protection Board's 2025 work on pseudonymization further informs the controls that operators must consider for subscriber data processing. These requirements can complicate the long-term data histories used in churn models and add cost to pan-regional deployments. Large operators with established privacy engineering resources may have an advantage over smaller providers that cannot build similar controls.
*Our forecasts treat driver/restraint impacts as directional, not additive. The impact forecasts reflect baseline growth, mix effects, and variable interactions.
Broadband Experience Analytics Market Segment Analysis
By Analytics Capability:
Customer Experience Supports Subscriber-Centered DecisionsCustomer Experience Analytics held 31.28% of the share of the market in 2025. Operators use this capability to connect network performance with service interactions, billing clarity, support responsiveness, and retention risk. It helps teams identify dissatisfaction before it becomes a churn event or a public complaint. Quality of Experience Analytics is projected to expand at a 12.12% CAGR through 2031. The Broadband Forum launched the WT-524 project in May 2025 to develop common quality-of-experience parameters and AI-enhanced measurement frameworks for bandwidth, latency, jitter, and packet loss. This work supports a more consistent evaluation of broadband service quality across providers.
China's FTTR deployment is projected to expand significantly through 2025 and continue growing in 2026, increasing the number of rooms, devices, and gateways that providers must monitor. Network Performance Analytics provides inputs for capacity planning, while Service Assurance Analytics supports service-level agreement monitoring for business and public-sector connections. Customer Experience Analytics also assesses the service and support experience. Platforms that integrate both views can distinguish a network fault from a service-process issue and support more targeted remediation.

By Deployment:
Cloud Expands Flexibility Across Operator EnvironmentsCloud deployment accounted for 57.77% of the share of the market in 2025 and is projected to expand at a 12.24% CAGR through 2031. Operators use cloud platforms to support continuous software delivery, scale during traffic peaks, and use AI services without relying on appliance replacement cycles. In June 2026, Nokia and Google Cloud announced a plan to offer Nokia Assurance Center as a SaaS application through Google Cloud Marketplace in September 2026. The offering was also designed for on-premises deployment through Google Distributed Cloud. This choice reflects the need for flexibility in large and regulated operator environments.
On-premises deployment remains relevant where data residency requirements limit the movement of subscriber data outside the national infrastructure. Hybrid architecture places the collection close to the network while moving selected computing workloads to the cloud. This approach can reduce the cost of transferring raw telemetry while preserving subscriber-level detail. RADCOM introduced its High-Capacity User Analytics solution in October 2025, stating that it could capture and analyze up to 400 Gbps on a single commercial server using NVIDIA networking platforms. The broadband experience analytics market benefits when vendors can meet both cloud modernization goals and data-residency requirements.
By Component:
Software Remains Central as Managed Delivery IncreasesSoftware accounted for 61.23% of the market share of the market in 2025. Platform licenses, collection agents, and analytics engines remain the core elements of an operator's analytics stack. Operators increasingly value open interfaces, multi-domain data ingestion, and AI model portability because these features reduce dependence on a single piece of equipment or software environment. Managed Services is projected to expand at a 12.66% CAGR through 2031. This demand is strongest among mid-tier and regional providers that need analytics outcomes but do not have large internal engineering teams. Consulting and integration services, along with support and maintenance services, remain important because platform value depends on successful deployment and ongoing use.
Calix launched Calix One in February 2026 as a unified platform that combines cloud software, Agent Workforce Cloud, and managed services. The platform was designed to help broadband service providers use AI across subscriber-facing and network operations workflows. This model combines the software license and managed service into a single commercial offer rather than treating them as separate purchases. It can reduce procurement barriers for smaller providers and support vendor-managed security controls. The broadband experience analytics industry is moving toward contracts that emphasize outcomes and ongoing service rather than software alone.
By Provider Type:
ISPs Lead While Managed Providers ExpandBroadband Internet Service Providers held 34.66% of the share of the market in 2025. Their position reflects responsibility for the full subscriber journey, from provisioning and last-mile quality assurance to in-home Wi-Fi management. The Fiber Broadband Association reported that markets with multiple fiber providers reached strong combined take rates in its recent North American update. This points to the importance of service experience in locations where coverage alone no longer determines subscriber acquisition. Telecom service providers and cable operators also use analytics to manage converged fixed-mobile bases and hybrid fiber-coaxial network performance. The broadband experience analytics market gives these providers a common view across residential and enterprise services.
Managed Service Providers are projected to expand at a 12.62% CAGR through 2031. Government and regulatory agencies also create demand when they require independent broadband-quality measurement and audit-ready quality-of-experience data. The Broadband Forum's standards work supports this need for consistent reporting frameworks. Enterprise network operators use analytics to assess application performance across campus and branch connections. These demands reduce the former gap in analytics maturity between the largest and smaller service providers.
By Organization Size:
Large Operators Retain Scale AdvantagesLarge operators accounted for 72.11% of the market share of the market in 2025. Their network scale, subscriber volumes, and capital capacity support extensive investment in OSS and BSS modernization. For these organizations, the analytics platform can support automated remediation, commercial prioritization, and executive performance reporting at the same time. This gives their AI models a broader base for identifying performance patterns and predicting experience outcomes. Their data resources can make it harder for smaller competitors to match the same level of diagnostic accuracy.
Small and medium-sized operators are projected to expand at a 12.14% CAGR through 2031. Cloud-based SaaS delivery has lowered the entry cost for deployments that previously needed dedicated appliances and specialized integration teams. Calix launched Calix Market Insights in June 2025 for more than 1,500 broadband service provider customers. The platform provides competitive and subscriber intelligence without requiring an internal data-science team. Smaller providers face the same service expectations as large operators, but may have less data and fewer tools for diagnosing service issues quickly. This makes cloud-native analytics a practical route to narrowing the operating gap.
By Application:
Network Management Leads and Churn Prediction AdvancesNetwork Performance Management held 26.88% of the share of the market in 2025. It provides the baseline view of network health that operators use before adding more subscriber-centered functions. Structured performance records also support regulatory reporting and speed-measurement requirements. Service-Level Agreement Monitoring is similarly important for enterprise and government connectivity agreements. These applications make the broadband experience analytics market relevant to both technical operations and service accountability. They also support quicker, evidence-based responses when service quality changes.
Churn Prediction and Retention Analytics is projected to expand at a 12.72% CAGR through 2031. Parks Associates and TechSee reported that Wi-Fi dead spots significantly reduced Net Promoter Score on average, while a substantial share of at-risk broadband households were close to churn. Home Wi-Fi and Connected Device Analytics help providers identify these issues through telemetry from managed gateway devices. Subscriber Experience Monitoring combines network, fault, and Wi-Fi signals into a customer-level quality score. Operators can use this score for technical triage and for proactive retention.
Geography Analysis
North America Broadband Experience Analytics Market
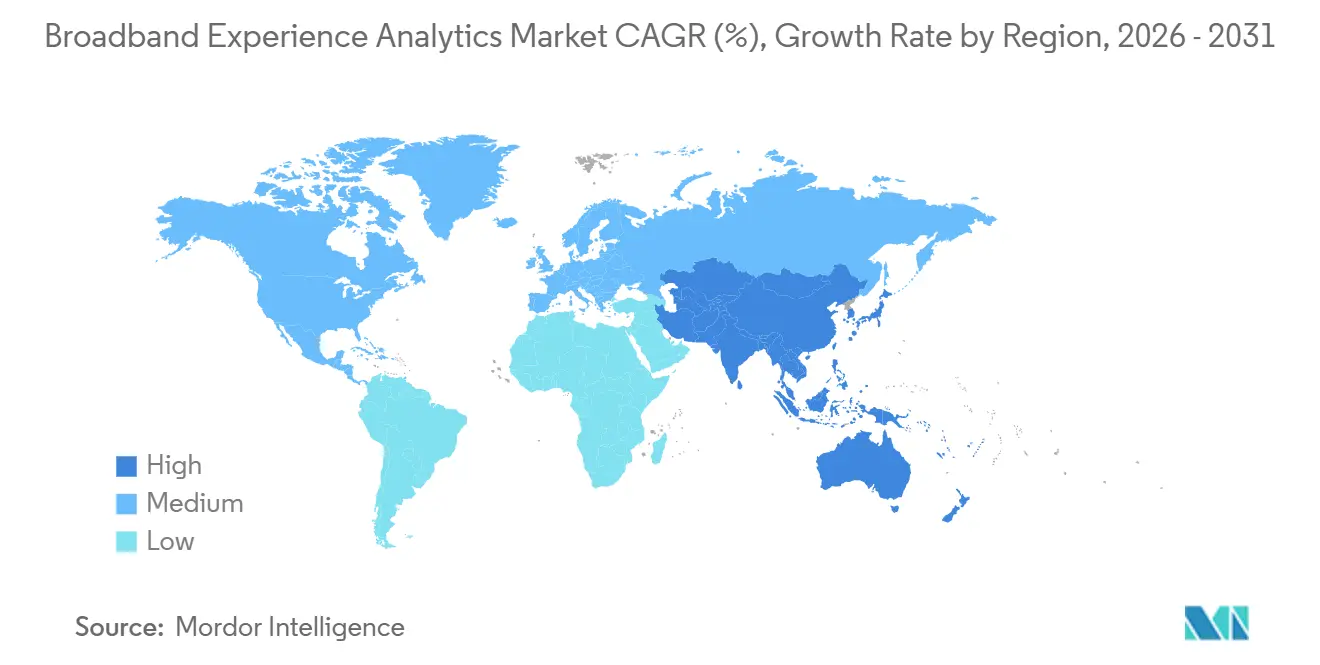
North America held 30.27% of the share of the market in 2025. Fiber overbuilds, intense ISP competition, and mature OSS and BSS modernization programs support demand across the United States and Canada. The Fiber Broadband Association reported that fiber is expected to pass 84.6 million U.S. homes by year-end 2025. These conditions make retention and service differentiation more important for providers operating in competitive areas.
APAC Broadband Experience Analytics Market
Asia-Pacific is projected to expand at a 12.58% CAGR through 2031, making it the fastest-growing region in the broadband experience analytics market. High broadband subscriber numbers, dense FTTH deployment, and quality-of-experience reporting programs in Japan, South Korea, and China support this position. China's fixed broadband base continued to expand in 2025, while FTTR adoption also increased significantly by year-end. SK Broadband deployed its AQUA system to identify and resolve IPTV anomalies using AI, and expected annual customer complaints to decline substantially. The system's chatbot handled most inquiries without human agents.
EMEA Broadband Experience Analytics Market
Europe remains an established region for the broadband experience analytics market because of detailed service-quality rules and network resilience obligations. Germany, the United Kingdom, and France are important markets because large fiber deployment programs and quality-reporting frameworks support analytics adoption. The European Data Protection Board's 2025 work on pseudonymization adds further guidance for compliant subscriber-data processing. The Middle East, especially Saudi Arabia and the United Arab Emirates, is using analytics in digital infrastructure modernization, while African adoption is concentrated among major mobile broadband providers in South Africa, Nigeria, and Egypt.
Competitive Landscape
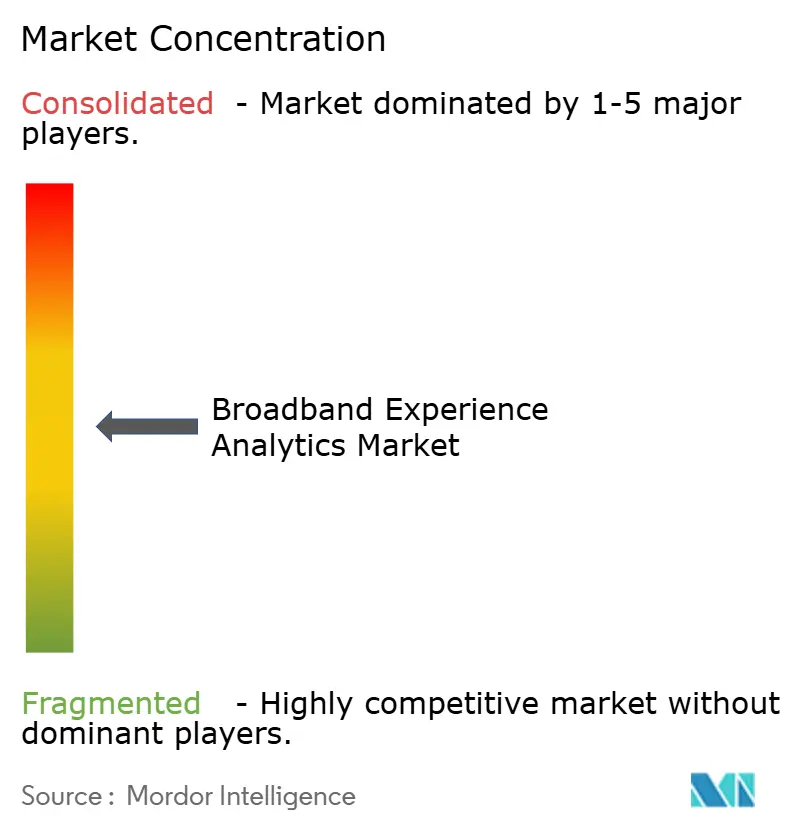
The broadband experience analytics market is moderately concentrated. Nokia, Cisco Systems, Ericsson, and Amdocs benefit from established OSS and BSS relationships that support cross-selling of analytics capabilities. RADCOM, Infovista, and Opensignal compete through measurement depth, service-quality methods, and flexible commercial models. In June 2026, Nokia and Google Cloud expanded their partnership to add 6 Gemini-powered AI agents to Nokia Assurance Center. The companies identified router and event-triage agents as early use cases and planned a SaaS release for September 2026.
Huawei launched AUTINOps at the latest Mobile World Congress as an AI-native intelligent operations solution with agentic models, digital-twin architecture, and high risk-identification accuracy. Infovista introduced VistaOne at the latest Mobile World Congress as an open AI-enabled platform that brings network intelligence and customer-experience intelligence together. RADCOM introduced the Analytics Designer Module for RADCOM ACE in June 2026 so analysts can configure data sets, key performance indicators, and alarms in real time. These moves reflect demand for configurable platforms, subscriber-level detail, and faster delivery cycles. ISO/IEC 27001 and GDPR compliance are also important in procurement because they can become entry requirements for analytics suppliers.
The in-home experience layer remains a competitive opening in the broadband experience analytics market. Opensignal expanded Subscriber Analytics globally in June 2026 to cover operators across Europe, Asia-Pacific, the Middle East, Africa, and the Americas. Vendors that can integrate legacy OSS environments with cloud-native network functions are better placed to address this requirement.
Broadband Experience Analytics Industry Leaders
-
Nokia Corporation
-
Cisco Systems, Inc.
-
Telefonaktiebolaget LM Ericsson
-
Amdocs Limited
-
Plume Design, Inc.
- *Disclaimer: Major Players sorted in no particular order
Broadband Experience Analytics Market Companies Covered in this Report
- Nokia Corporation
- Cisco Systems, Inc.
- Telefonaktiebolaget LM Ericsson
- Amdocs Limited
- Huawei Technologies Co., Ltd.
- Plume Design, Inc.
- Calix, Inc.
- Broadcom Inc.
- RADCOM Ltd.
- Infovista S.A.S.
- Opensignal Limited
- Ookla LLC
- Anritsu Corporation
- Rohde & Schwarz GmbH & Co. KG
- EXFO Inc.
- VIAVI Solutions Inc.
- Sandvine Corporation
- NETSCOUT SYSTEMS, INC.
- Enghouse Systems Limited
- ASSIA, Inc.
- MedUX
- Epitiro Limited
- Accenture plc
Recent Industry Developments in Broadband Experience Analytics Market
- June 2026: Nokia and Google Cloud announced an expanded partnership to embed six Gemini-powered AI agents into the Nokia Assurance Center, with a SaaS launch on Google Cloud Marketplace planned for September 2026. The collaboration targets autonomous fault triage, router event classification, and closed-loop network remediation, extending Nokia's autonomous network capabilities to operators through a hyperscaler delivery model.
- June 2026: RADCOM launched the Analytics Designer Module for its RADCOM ACE platform, enabling network data analysts to configure data sets, key performance indicators, and alarms in real time without vendor engagement. General availability for RADCOM ACE customers is planned for Q3 2026, with the module built on a new in-memory database and microservice architecture.
- June 2026: Opensignal expanded its Subscriber Analytics solution to operators globally across Europe, Asia-Pacific, the Middle East, Africa, and the Americas. The expansion extends competitive subscriber-switching intelligence beyond the United States and Canada and enables local-market churn and share tracking.
- March 2026: VIAVI Solutions launched the FTH-DAS, a fiber-sensing interrogator with an embedded AI and machine-learning engine. It supports real-time multi-event detection and localization across several fiber links at the network edge without external processing.
Global Broadband Experience Analytics Market Report Scope
Broadband Experience Analytics Market refers to software platforms and solutions that measure, analyze, and improve subscribers’ end-to-end experience across fixed broadband, fiber, cable, Wi-Fi, and digital services. These platforms correlate network, device, application, subscriber, and customer-interaction data to assess Quality of Service and perceived Quality of Experience.
The Broadband Experience Analytics Market Report is Segmented by Analytics Capability (Customer Experience Analytics, Network Performance Analytics, Quality of Experience Analytics, and Service Assurance Analytics), Deployment (Cloud, and On-Premises), Component (Software, and Services), Provider Type (Broadband ISPs, Telecom SPs, Cable Operators, Managed SPs, Government and Regulatory Agencies, Enterprise Network Operators), Organization Size (Large Operators, and SMEs), Application (Network Performance Management, Fault Detection and Root-Cause Analysis, Subscriber Experience Monitoring, Home Wi-Fi Analytics, SLA Monitoring, and Churn Prediction), and Geography (North America, South America, Europe, Asia-Pacific, Middle East, and Africa). The Market Forecasts are Provided in Terms of Value (USD).
Segmentation Overview
| Customer Experience Analytics |
| Network Performance Analytics |
| Quality of Experience Analytics |
| Service Assurance Analytics |
| Others Analytics Capability |
| Cloud |
| On-Premises |
| Software | |
| Services | Consulting and Integration Services |
| Managed Services | |
| Support and Maintenance Services |
| Broadband Internet Service Providers |
| Telecom Service Providers |
| Cable Operators |
| Managed Service Providers |
| Government and Regulatory Agencies |
| Enterprise Network Operators |
| Large Operators |
| Small and Medium-Sized Operators |
| Network Performance Management |
| Fault Detection and Root-Cause Analysis |
| Subscriber Experience Monitoring |
| Home Wi-Fi and Connected Device Analytics |
| Service-Level Agreement Monitoring |
| Churn Prediction and Retention |
| Other Applications |
| North America | United States |
| Canada | |
| Mexico | |
| South America | Brazil |
| Argentina | |
| Chile | |
| Rest of South America | |
| Europe | Germany |
| United Kingdom | |
| France | |
| Italy | |
| Spain | |
| Russia | |
| Rest of Europe | |
| Asia-Pacific | China |
| India | |
| Japan | |
| South Korea | |
| Australia | |
| Indonesia | |
| Rest of Asia-Pacific | |
| Middle East | Saudi Arabia |
| United Arab Emirates | |
| Israel | |
| Turkey | |
| Rest of Middle East | |
| Africa | South Africa |
| Nigeria | |
| Egypt | |
| Kenya | |
| Rest of Africa |
| By Analytics Capability | Customer Experience Analytics | |
| Network Performance Analytics | ||
| Quality of Experience Analytics | ||
| Service Assurance Analytics | ||
| Others Analytics Capability | ||
| By Deployment | Cloud | |
| On-Premises | ||
| By Component | Software | |
| Services | Consulting and Integration Services | |
| Managed Services | ||
| Support and Maintenance Services | ||
| By Provider Type | Broadband Internet Service Providers | |
| Telecom Service Providers | ||
| Cable Operators | ||
| Managed Service Providers | ||
| Government and Regulatory Agencies | ||
| Enterprise Network Operators | ||
| By Organization Size | Large Operators | |
| Small and Medium-Sized Operators | ||
| By Application | Network Performance Management | |
| Fault Detection and Root-Cause Analysis | ||
| Subscriber Experience Monitoring | ||
| Home Wi-Fi and Connected Device Analytics | ||
| Service-Level Agreement Monitoring | ||
| Churn Prediction and Retention | ||
| Other Applications | ||
| By Geography | North America | United States |
| Canada | ||
| Mexico | ||
| South America | Brazil | |
| Argentina | ||
| Chile | ||
| Rest of South America | ||
| Europe | Germany | |
| United Kingdom | ||
| France | ||
| Italy | ||
| Spain | ||
| Russia | ||
| Rest of Europe | ||
| Asia-Pacific | China | |
| India | ||
| Japan | ||
| South Korea | ||
| Australia | ||
| Indonesia | ||
| Rest of Asia-Pacific | ||
| Middle East | Saudi Arabia | |
| United Arab Emirates | ||
| Israel | ||
| Turkey | ||
| Rest of Middle East | ||
| Africa | South Africa | |
| Nigeria | ||
| Egypt | ||
| Kenya | ||
| Rest of Africa | ||
Key Questions Answered in the Report
What is the size of the broadband experience analytics market?
The market size is projected to expand from USD 3.55 billion in 2026 to USD 6.21 billion by 2031, at an 11.83% CAGR.
What is driving adoption of broadband experience analytics platforms?
Providers need to manage service quality across fiber, fixed wireless access, DOCSIS, home Wi-Fi, and customer support while reducing churn.
Which analytics capability held the largest share in 2025?
Customer Experience Analytics held 31.28% share in 2025 because providers are linking network performance with subscriber outcomes.
Which deployment model is expanding fastest?
Cloud deployment is projected to expand at a 12.24% CAGR through 2031, supported by modernization programs and flexible delivery options.
Why are managed services becoming more important for broadband providers?
Managed Services is projected to expand at a 12.66% CAGR as smaller providers seek analytics outcomes without building large internal engineering teams.
Which region is projected to expand fastest through 2031?
Asia-Pacific is projected to expand at a 12.58% CAGR, supported by FTTH density, high subscriber volumes, and quality-measurement programs.