
Bio-Based Carbon Fillers Market Size and Share
Market Overview
| Study Period | 2021 - 2031 |
|---|---|
| Market Size (2026) | USD 310.06 Million |
| Market Size (2031) | USD 594.12 Million |
| Growth Rate (2026 - 2031) | 13.89 % |
| Fastest Growing Market | Asia-Pacific |
| Largest Market | North America |
| Market Concentration | Low |
Major Players *Disclaimer: Major Players sorted in no particular order Image © Mordor Intelligence. Reuse requires attribution under CC BY 4.0. | |
Bio-Based Carbon Fillers Market Analysis by Mordor Intelligence
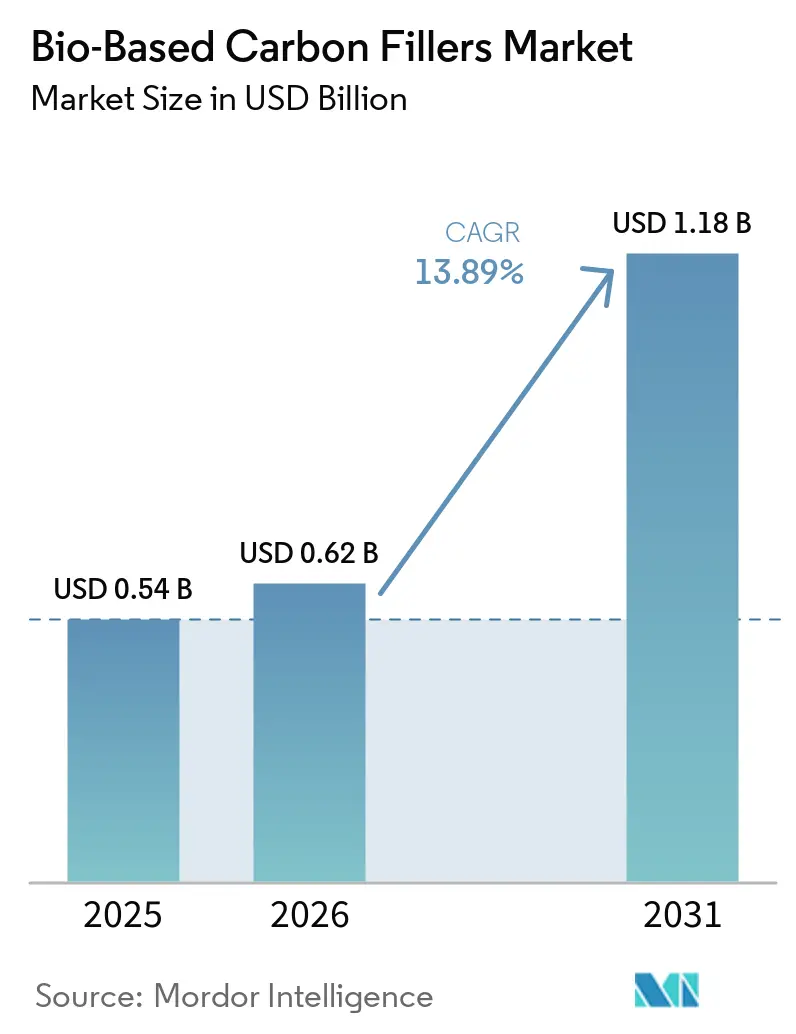
The Bio-Based Carbon Fillers Market size is projected to be USD 274.33 million in 2025, USD 310.06 million in 2026, and reach USD 594.12 million by 2031, at a CAGR of 13.89% from 2026 to 2031. Mandatory Scope 3 greenhouse gas disclosure requirements in the European Union and California are making verified low-carbon materials more relevant to purchasing decisions. Corporate buyers are seeking certified materials that can reduce product carbon footprints and support supply-chain reporting. Bio-based carbon fillers also offer formulators an alternative to fossil-derived carbon black in rubber, plastics, coatings, and inks. Carbon-removal offtake agreements are tightening the availability of premium biochar, which encourages investment in pyrolysis capacity and new feedstock routes. These conditions create opportunities for producers that can offer consistent material quality, credible certification, and supply arrangements for both filler and carbon-credit buyers.
Key Report Takeaways
- By product type, biochar held 48.56% of the bio-based carbon fillers market share in 2025, while bio-based carbon black is projected to advance at a 16.68% CAGR through 2031.
- By feedstock, wood biomass held 43.12% of the bio-based carbon fillers market share in 2025, while lignin and pulp residues are projected to advance at a 15.72% CAGR through 2031.
- By application, polymer compounds held 35.28% of the bio-based carbon fillers market share in 2025, while coatings and inks are projected to advance at a 15.94% CAGR through 2031.
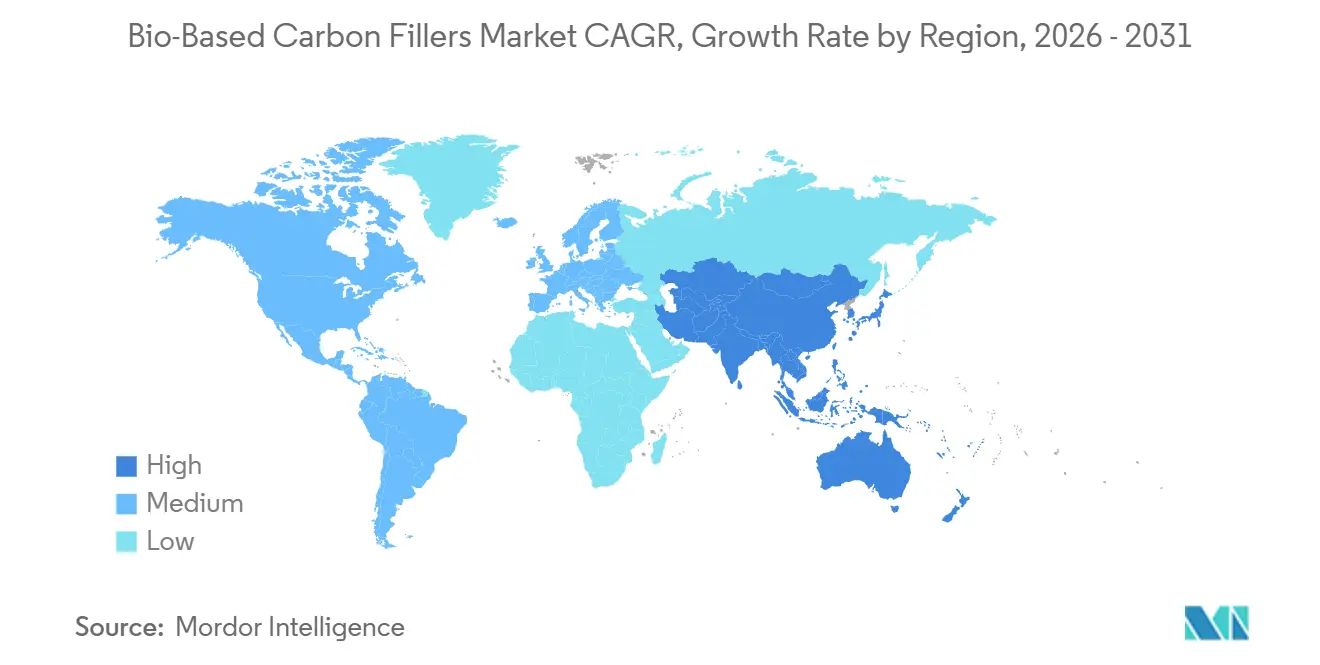
- By geography, North America held 36.40% of the bio-based carbon fillers market share in 2025, while Asia-Pacific is projected to advance at a 16.11% CAGR through 2031.
Note: Market size and forecast figures in this report are generated using Mordor Intelligence’s proprietary estimation framework, updated with the latest available data and insights as of January 2026.
Market Trends and Insights
Drivers Impact Analysis of Bio-Based Carbon Fillers Market*
| Driver | (~) % Impact on CAGR Forecast | Geographic Relevance | Impact Timeline |
|---|---|---|---|
| Corporate Scope 3 and Product Carbon Footprint Requirements | +3.5% | Global; regulatory influence strongest in EU and North America | Short term (≤ 2 years) |
| Carbon Removal Offtake Demand for Durable Biochar Storage | +3.0% | Global, with leading activity in North America, Europe, and South Asia | Medium term (2–4 years) |
| Substitution of Fossil Carbon Black and Silica in Rubber and Plastics | +2.6% | Global; APAC core, spill-over to North America and EU | Medium term (2–4 years) |
| Waste Biomass Valorization and Integrated Energy Recovery | +2.0% | North America, Europe; emerging in APAC | Medium term (2–4 years) |
| Engineered Particle and Surface Properties for Drop-In Processing | +1.5% | North America, Europe | Long term (≥ 4 years) |
| Biochar-Enabled Lightweighting and Functional Performance | +1.0% | North America, Europe, APAC core | Long term (≥ 4 years) |
| Source: Mordor Intelligence | |||
Corporate Scope 3 and Product Carbon Footprint Requirements
Mandatory Scope 3 emissions disclosure has become an active factor in materials sourcing across several industries. Directive (EU) 2026/470 preserved Scope 3 greenhouse gas disclosure requirements for in-scope companies while reducing the total number of mandatory data points by 61%. Wave 1 companies that were previously subject to the Non-Financial Reporting Directive are reporting on 2026 data[1]. California Senate Bill 253 requires Scope 3 reporting from 2027, which adds reporting pressure for large companies with activities in the state. Verified bio-based carbon fillers can reduce a buyer’s Category 1 purchased goods and services inventory when the material replaces a higher-emission input. This shift makes certification under the European Biochar Certificate (EBC), the International Biochar Initiative, and ASTM D6866 a purchasing requirement rather than only a marketing claim.
Carbon Removal Offtake Demand for Durable Biochar Storage
Long-term carbon-removal agreements are securing biochar volumes that might otherwise be available to industrial filler buyers. In January 2025, Microsoft signed a 10-year agreement with Exomad Green for at least 1.24 million metric tons of carbon dioxide removal. In April 2026, Exomad Green and Supercritical signed a 3-year agreement for up to 500,000 metric tons of durable carbon removal, securing Exomad Green’s entire 2026 inventory. The agreement reinforced competition between carbon-credit demand and filler-grade demand for certified biochar. It also provides producers with contracted revenue that can support new pyrolysis projects and feedstock development. Bio-based carbon fillers market participants with sufficient scale can serve both end uses and reduce their exposure to a single revenue stream.
Substitution of Fossil Carbon Black and Silica in Rubber and Plastics
Conventional carbon black production exceeds 15 million metric tons annually, while biochar output represents less than 3% of that volume. This difference leaves substantial room for partial substitution in rubber and plastics. A 2025 peer-reviewed review found that activation, co-milling with nanosilica, and surface treatment enabled biochar to replace 30%-50% of carbon black in styrene-butadiene rubber and natural rubber composites with minimal tensile loss. The review also reported that a lignin black liquor and silica dual-phase carbon-silica nanohybrid achieved tensile strength of 17.92 MPa and elongation at break of 708% in laboratory testing. These results support the use of tailored bio-based fillers in applications where partial replacement is technically acceptable. The bio-based carbon fillers market can expand as compounders identify product grades that meet specific reinforcement, color, conductivity, or processing needs.
Waste Biomass Valorization and Integrated Energy Recovery
Pyrolysis projects can improve their economics when renewable heat and other process outputs offset operating costs. A 2024 techno-economic assessment published through the U.S. Department of Energy’s Office of Scientific and Technical Information found that slow-pyrolysis biochar from woody biomass could reach cost parity with market values when carbon-credit revenue was included. The assessment also found that fast-pyrolysis routes could produce higher-recalcitrance biochar suited to durable applications. Integrated projects can use biomass more completely and create more than one source of revenue. This supports financing for equipment, feedstock handling, and processing infrastructure. The bio-based carbon fillers market gains from projects that can sell heat while producing a material suitable for compounders.
Restraints Impact Analysis of Bio-Based Carbon Fillers Market*
| Restraint | (~) % Impact on CAGR Forecast | Geographic Relevance | Impact Timeline |
|---|---|---|---|
| Feedstock Variability and Contaminant-Control Burden | -2.5% | Global | Short term (≤ 2 years) |
| Qualification Cycles Against Carbon Black Performance Specifications | -2.0% | Global; most acute in North America and EU | Medium term (2–4 years) |
| Limited Industrial-Scale Supply and Batch-to-Batch Consistency | -1.5% | Global | Medium term (2–4 years) |
| Certification Fragmentation and Unclear End-Use Claims | -1.0% | Global; most pronounced in EU | Short term (≤ 2 years) |
| Source: Mordor Intelligence | |||
Feedstock Variability and Contaminant-Control Burden
The broad range of usable biomass inputs improves supply options but creates differences in composition and contaminant profiles between batches. European Biochar Certificate Standard Version 10.5E limits plastic and rubber contamination to 1% by mass for agronomic-grade biochar. The limit can rise to 10% for EBC-Material applications with written approval from Carbon Standards International. The standard also requires pyrolysis at a minimum of 500 °C for at least 10 minutes to degrade organic micropollutants, including pharmaceuticals and mycotoxins. Heavy-metal content, including cadmium, lead, and arsenic, can vary with feedstock source and prior agricultural chemical use. International Biochar Initiative Version 2.0 protocols require retesting when feedstock composition changes beyond a 20% mixing-ratio change[2]. These measures add operational complexity and can slow adoption in the bio-based carbon fillers market.
Qualification Cycles Against Carbon Black Performance Specifications
ASTM D1765 specifications for surface area, oil absorption, and structure index define industrial carbon black grades. Bio-based alternatives do not have an equivalent harmonized test standard for every filler application. Buyers and suppliers must therefore agree on product-specific benchmarks and conduct independent qualification programs. For tire and technical-rubber applications, qualification against ASTM D412 tensile testing, D624 tear-strength testing, and accelerated-aging procedures can take 18-24 months. The long process delays revenue for producers during a period when they are also financing capacity expansion. This restraint favors established suppliers that can support extended customer trials and quality documentation.
*Our forecasts treat driver/restraint impacts as directional, not additive. The impact forecasts reflect baseline growth, mix effects, and variable interactions.
Bio-Based Carbon Fillers Market Segment Analysis
By Product Type:
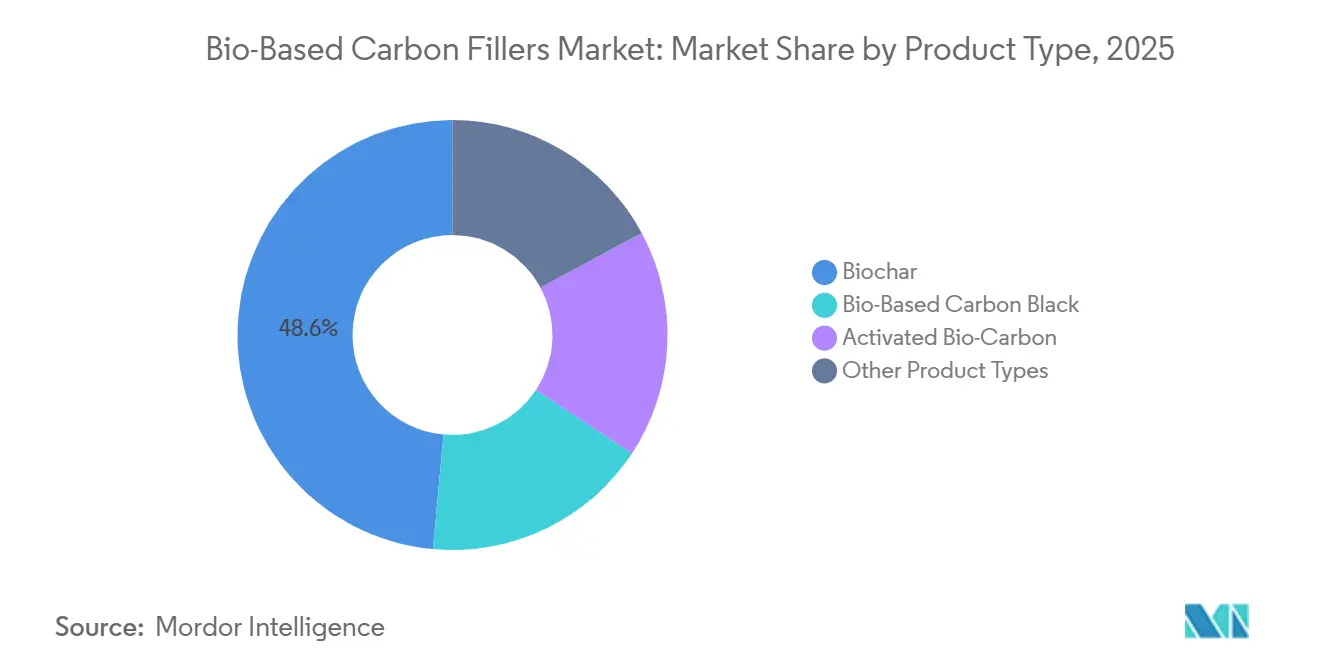
Biochar Leads on Scale, Bio-Based Carbon Black Accelerates on DemandBiochar held 48.56% of the product type revenue in 2025, while bio-based carbon black is projected to advance at a 16.68% CAGR through 2031. Biochar’s position reflected established operations that can use wood residues, agricultural byproducts, and mixed organic streams. Its broad feedstock base supported commercial-scale production before other specialized bio-based carbon grades reached wider use. Bio-based carbon black is gaining demand in packaging, coatings, and inks because it can serve as a pigment replacement. In December 2025, UPM launched Circular Renewable Black, a bio-based, near-infrared detectable, carbon-negative black pigment made from renewable lignin. The product was certified under International Sustainability and Carbon Certification Plus, Forest Stewardship Council, and Programme for the Endorsement of Forest Certification standards.
The bio-based carbon fillers market size for biochar retained an advantage because existing systems can make it from several biomass sources. Conventional carbon black can make black plastic packaging difficult for near-infrared sorting systems to detect at recycling facilities. UPM’s material addresses this issue for packaging systems that need near-infrared sorting performance. Activated bio-carbon serves energy-storage electrodes and filtration media where high surface area and adsorption properties can support higher prices. Specialty graphitic bio-carbon remains at an early commercial stage for conductive polymers and specialty composites. Biochar surface area typically ranges from 50 to 300 m²/g, compared with 150 to 1,500 m²/g for furnace carbon black. This difference limits full substitution in high-performance rubber but allows partial replacement when activation and surface modification are used.

By Feedstock:
Wood Biomass Anchors Revenue, Lignin and Pulp Residues AccelerateWood biomass held 43.12% of feedstock revenue in 2025, while lignin and pulp residues are projected to advance at a 15.72% CAGR through 2031. Wood residues have established certification systems that support chain-of-custody traceability for buyers reporting Scope 3 emissions. Airex Energy’s Carbonity plant in Quebec was built next to a sawmill, giving the operation direct access to woody residues. This location reduces feedstock transport needs and supports a consistent supply. Wood biomass also fits the operating model of many existing pyrolysis facilities. Its established supply chain gives it a strong role in the bio-based carbon fillers market.
Lignin and pulp residues are supported by existing pulp and biorefinery infrastructure. UPM’s Leuna biorefinery processes 500,000 metric tons of sustainably sourced hardwood each year into Renewable Functional Fillers, glycols, and industrial sugars. The facility offers a direct commercial route for lignin-based materials that can replace carbon black and precipitated silica. Only 2% of the 70 million metric tons of industrial lignin produced annually was used in high-value applications, while most of the remainder was combusted for energy recovery. Research reported a specific surface area of 83.41 m²/g for lignin-derived nano-biochar, comparable with commercial N550 carbon black. This performance profile gives lignin residues potential in more demanding rubber applications.
By Application:
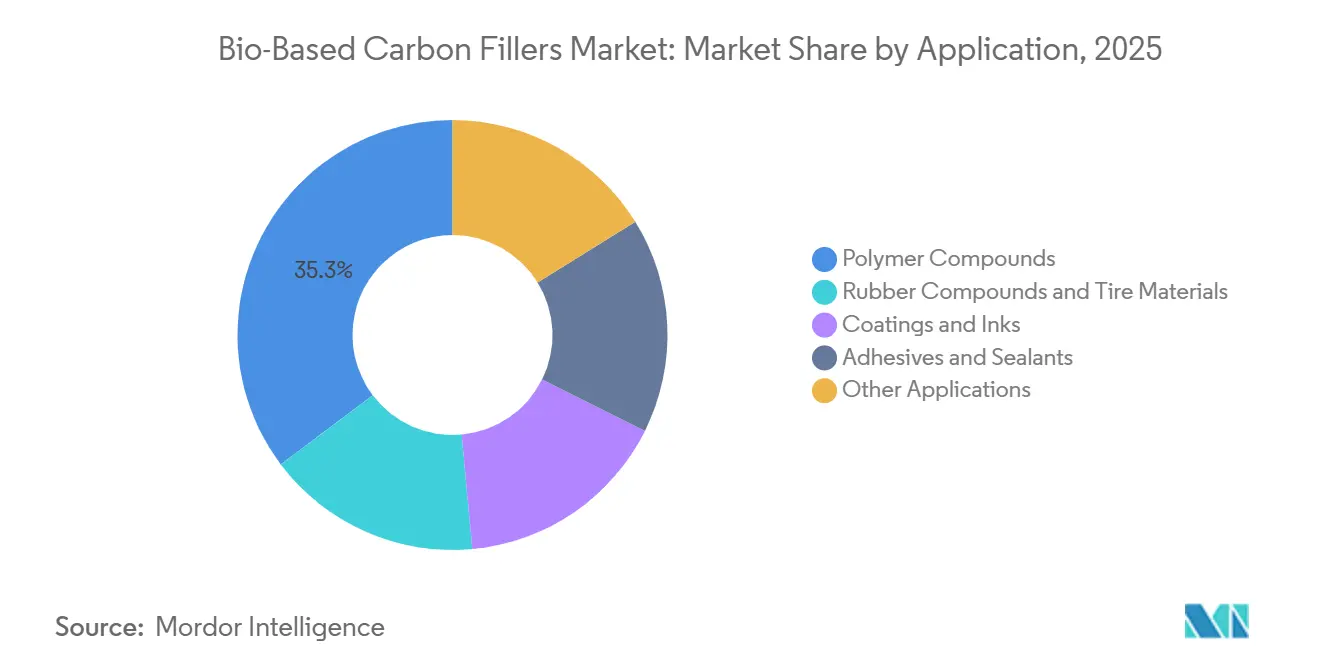
Polymer Compounds Dominate, Coatings and Inks Sprint AheadPolymer compounds held 35.28% of application revenue in 2025, while coatings and inks are projected to advance at a 15.94% CAGR through 2031. Polymer demand centers on bio-composite masterbatch and functional filler systems. Made of Air GmbH filed U.S. Patent Application 20260049199 in 2026 for charcoal-polyfurfuryl alcohol composite materials containing 25-90 wt% charcoal. The application shows how high charcoal loadings can be used in the built environment and mobility materials. A 2025 life-cycle assessment of biochar-reinforced polyamide 12 reported a 66% reduction in climate-change potential at 20 wt% biochar loading compared with the neat polymer.
The study also reported that the tensile modulus increased from 1.4 GPa to 3.2 GPa at 10 wt% loading. These findings support use in applications where stiffness and lower material emissions are both relevant. Coatings and inks are expanding as formulators seek renewable pigment options that can meet food-contact, packaging, and protective-coating requirements. In July 2025, Nature Coatings launched BioBlack Blends for solventborne flexible packaging inks, vegetable-oil protective coatings, and waterborne food-contact barrier coatings. In October 2025, Orion Engineered Carbons S.A. introduced ECOLAR 50 POWDER, a bio-circular carbon black for coatings made from bio-circular feedstocks that do not compete with the food chain. Rubber compounds and tire materials remain important because performance depends on the interaction between each biochar grade and the rubber matrix.
Geography Analysis
North America Bio-Based Carbon Fillers Market
North America held 36.40% of the bio-based carbon fillers market share in 2025. The region combines industrial-scale pyrolysis infrastructure, corporate buyers that are responding to supply-chain emissions targets, and proximity to polymer and rubber compounders in the U.S. Midwest and Ontario. Carbonity in Port-Cartier, Quebec, began operations in May 2025 as Canada’s first industrial-scale biochar plant and North America’s largest. The plant began with 10,000 metric tons per year of capacity and targets 30,000 metric tons per year by the end of 2026. Its use of Forest Stewardship Council-certified woody residues gives the project a traceable feedstock model that can be replicated in forestry regions. California’s Scope 3 reporting requirements from 2027 are expected to strengthen documented emissions-reduction purchasing across the region.
APAC Bio-Based Carbon Fillers Market
Asia-Pacific is projected to advance at a 16.11% CAGR through 2031. The region’s tire and rubber manufacturing base gives even small levels of renewable filler substitution material demand potential. China and India are key regional sources of carbon black consumption for tire and industrial rubber production. In January 2026, Microsoft signed an agreement with Varaha to purchase more than 100,000 metric tons of carbon dioxide removal credits over 3 years through 2029. The agreement supports industrial pyrolysis scale-up in Maharashtra and improves production-finance certainty for biochar projects. Japan’s Ministry of Economy, Trade, and Industry certification requirements for consumer-goods contact applications and South Korea’s specialty polymer compounding base support demand for certified, low-polycyclic aromatic hydrocarbon filler grades.
EMEA and South America Bio-Based Carbon Fillers Market
Europe has a demand profile shaped by embodied-carbon reporting, restrictions on polycyclic aromatic hydrocarbons, and extended producer responsibility rules for packaging. Germany, France, and Scandinavia support demand from industrial buyers that seek short supply chains, documented certification, and verified carbon attributes. UPM’s Leuna biorefinery provides a regional supply base for European compounders. South America remains primarily a feedstock origin, while domestic filler demand is expected to develop as polymer compounding capacity grows. The Middle East and Africa remain at an early stage, although South Africa’s automotive component sector and wider interest in waste-biomass use could support demand later in the forecast period. The bio-based carbon fillers market is likely to develop at different speeds across these regions because feedstock supply, carbon-credit demand, technical standards, and local processing capacity vary.
Competitive Landscape
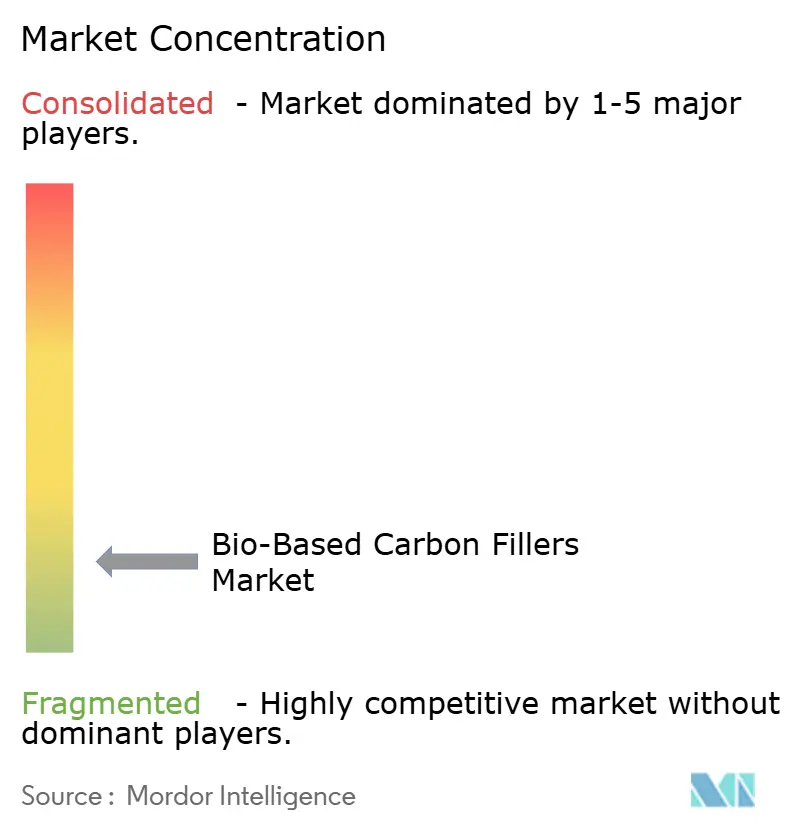
The bio-based carbon fillers market is highly fragmented, with the top five players including UPM, Origin Materials, Wakefield Biochar, Biocarbon Compounds, and Made of Air. Competition centers on feedstock access, certification credibility, surface-engineering capability, and the ability to use carbon-credit revenue alongside filler sales. UPM has a differentiated position through its Leuna biorefinery, which produces functional fillers as well as glycols and industrial sugars. This integrated operating model gives UPM a broader cost base than dedicated biochar producers. Made of Air GmbH has focused on specialized charcoal-polymer composites for high-value applications. Its 2026 patent application covered composites with 25-90 wt% charcoal loading.
Nature Coatings has focused on the coatings and inks value chain through its BioBlack products. The company states that its product has certifications under EU Cosmetics Regulation 1223/2009, U.S. Food and Drug Administration 21 CFR, EU 10/2011, and OEKO-TEX Global Organic Textile Standard requirements. This compliance coverage can reduce formulation-switching risk for customers in regulated end uses. In July 2025, the company launched BioBlack Blends to supply solventborne, vegetable-oil, and waterborne dispersions. Novocarbo has taken a different route by combining renewable heat sales with biochar production at its Carbon Removal Parks. Its work on biochar-asphalt composites also extends its activity beyond soil applications and conventional filler sales.
European Biochar Certificate and International Biochar Initiative testing requirements create an entry barrier for suppliers without established quality systems. The standards require accredited laboratory testing and can require requalification when feedstock composition changes. This requirement favors producers that can fund repeated batch analysis and sustain material consistency. Producers that combine consistent feedstock, technical support, and end-use certification are better placed to win long qualification cycles.
Bio-Based Carbon Fillers Industry Leaders
-
UPM
-
Origin Materials
-
Wakefield Biochar
-
Biocarbon Compounds
-
Made of Air
- *Disclaimer: Major Players sorted in no particular order
Bio-Based Carbon Fillers Market Companies Covered in this Report
- Airex Energy Inc.
- ArSta Eco Private Limited
- Biocarbon Compounds
- Biochar Now
- Biochar Supreme, LLC
- BLACK DONUTS INC.
- Carbofex Oy
- Carboganic
- Carbon Gold Ltd
- CHAR Technologies Ltd.
- Made of Air
- Nature Coatings
- Novocarbo GmbH
- Origin Materials
- UPM
- Wakefield BioChar
Recent Industry Developments in Bio-Based Carbon Fillers Market
- April 2026: Exomad Green and Supercritical signed a 3-year agreement covering up to 500,000 metric tons of biochar carbon removal under the Puro.earth methodology. The agreement extended an existing partnership through which Supercritical had already facilitated more than 100,000 metric tons of biochar removals, indicating continued supply tightness at the premium end of the biochar market, with direct implications for industrial filler-grade allocation.
- February 2026: SUEZ and PYREG announced the deployment of Pyrolis S2B, an integrated solution for pyrocarbonization. The technology converts sewage sludge into biochar, providing a carbon sequestration solution while supporting the circular economy.
Global Bio-Based Carbon Fillers Market Report Scope
Bio-based carbon fillers are carbon-rich materials derived from renewable biomass sources and processed for use as functional fillers in industrial formulations. They can improve mechanical, electrical, thermal, and reinforcement properties while providing a renewable alternative to conventional carbon fillers.
The Bio-Based Carbon Fillers Market is segmented by product type, feedstock, application, and geography. By product type, the market is segmented into biochar, bio-based carbon black, activated bio-carbon, and other product types (including graphitic bio-carbon and specialty bio-based carbon fillers). By feedstock, the market is segmented into wood biomass, agricultural residues, lignin and pulp residues, and other feedstocks (including bamboo, coconut shells, organic waste, and other biomass feedstocks). By application, the market is segmented into polymer compounds, rubber compounds and tire materials, coatings and inks, adhesives and sealants, and other applications (including composites, energy storage, filtration, and environmental remediation). The report also covers the market size and forecasts for bio-based carbon fillers in 15 countries across major regions. For each segment, the market sizing and forecasts have been done on the basis of value (USD).
Segmentation Overview
| Biochar |
| Bio-Based Carbon Black |
| Activated Bio-Carbon |
| Other Product Types (Graphitic Bio-Carbon, Specialty Bio-Based Carbon Fillers) |
| Wood Biomass |
| Agricultural Residues |
| Lignin and Pulp Residues |
| Other Feedstocks (Bamboo, Coconut Shells, Organic Waste, Other Biomass Feedstocks) |
| Polymer Compounds |
| Rubber Compounds and Tire Materials |
| Coatings and Inks |
| Adhesives and Sealants |
| Other Applications (Composites, Energy Storage, Filtration and Environmental Remediation) |
| Asia-Pacific | China |
| India | |
| Japan | |
| South Korea | |
| Rest of Asia-Pacific | |
| North America | United States |
| Canada | |
| Mexico | |
| Europe | Germany |
| United Kingdom | |
| France | |
| Italy | |
| Rest of Europe | |
| South America | Brazil |
| Argentina | |
| Rest of South America | |
| Middle East and Africa | Saudi Arabia |
| South Africa | |
| Rest of Middle East and Africa |
| By Product Type | Biochar | |
| Bio-Based Carbon Black | ||
| Activated Bio-Carbon | ||
| Other Product Types (Graphitic Bio-Carbon, Specialty Bio-Based Carbon Fillers) | ||
| By Feedstock | Wood Biomass | |
| Agricultural Residues | ||
| Lignin and Pulp Residues | ||
| Other Feedstocks (Bamboo, Coconut Shells, Organic Waste, Other Biomass Feedstocks) | ||
| By Application | Polymer Compounds | |
| Rubber Compounds and Tire Materials | ||
| Coatings and Inks | ||
| Adhesives and Sealants | ||
| Other Applications (Composites, Energy Storage, Filtration and Environmental Remediation) | ||
| By Geography | Asia-Pacific | China |
| India | ||
| Japan | ||
| South Korea | ||
| Rest of Asia-Pacific | ||
| North America | United States | |
| Canada | ||
| Mexico | ||
| Europe | Germany | |
| United Kingdom | ||
| France | ||
| Italy | ||
| Rest of Europe | ||
| South America | Brazil | |
| Argentina | ||
| Rest of South America | ||
| Middle East and Africa | Saudi Arabia | |
| South Africa | ||
| Rest of Middle East and Africa | ||
Key Questions Answered in the Report
What is the size of the bio-based carbon fillers market?
The Bio-Based Carbon Fillers Market size is projected to be USD 274.33 million in 2025, USD 310.06 million in 2026, and reach USD 594.12 million by 2031, at a CAGR of 13.89% from 2026 to 2031.
What is driving demand for bio-based carbon fillers?
Scope 3 reporting needs, replacement of fossil carbon black, and demand for certified low-carbon materials are supporting demand.
Which product type led revenue in 2025?
Biochar led product type revenue with 48.56% in 2025, supported by mature production infrastructure and a broad feedstock base.
Which feedstock is expected to grow the fastest through 2031?
Lignin and pulp residues are projected to advance at a 15.72% CAGR through 2031, supported by pulp and biorefinery infrastructure.