AI Data Labeling Market Size and Share
Market Overview
| Study Period | 2020 - 2031 |
|---|---|
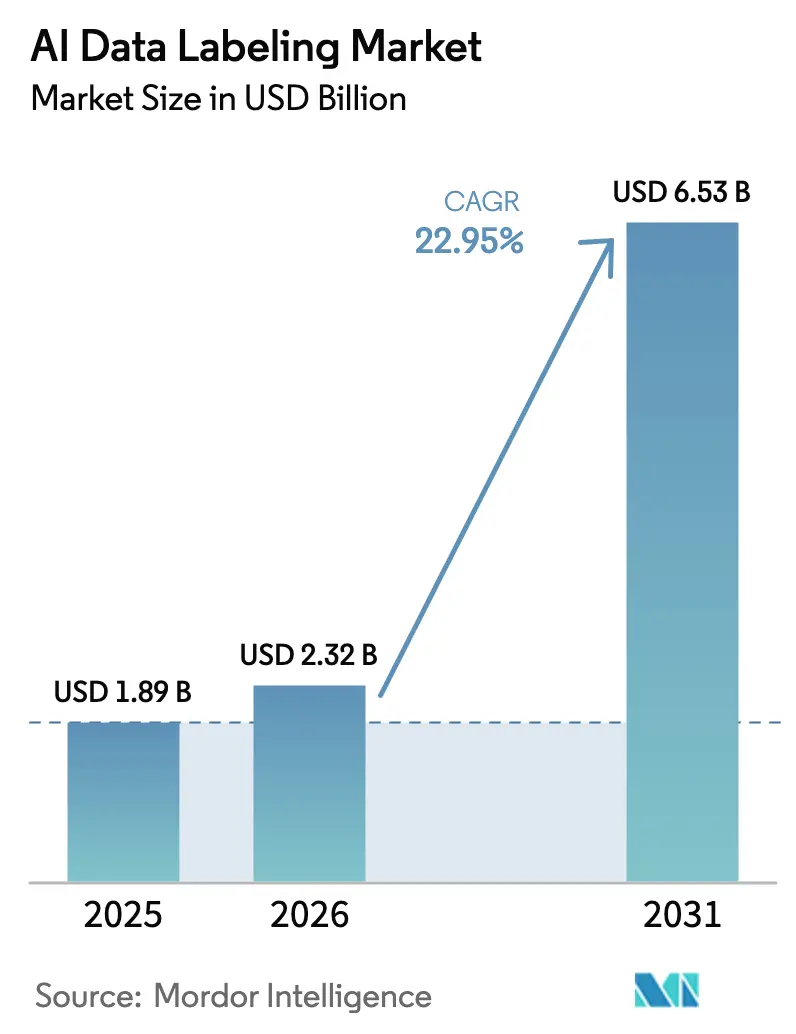
| Market Size (2026) | USD 2.32 Billion |
| Market Size (2031) | USD 6.53 Billion |
| Growth Rate (2026 - 2031) | 22.95% CAGR |
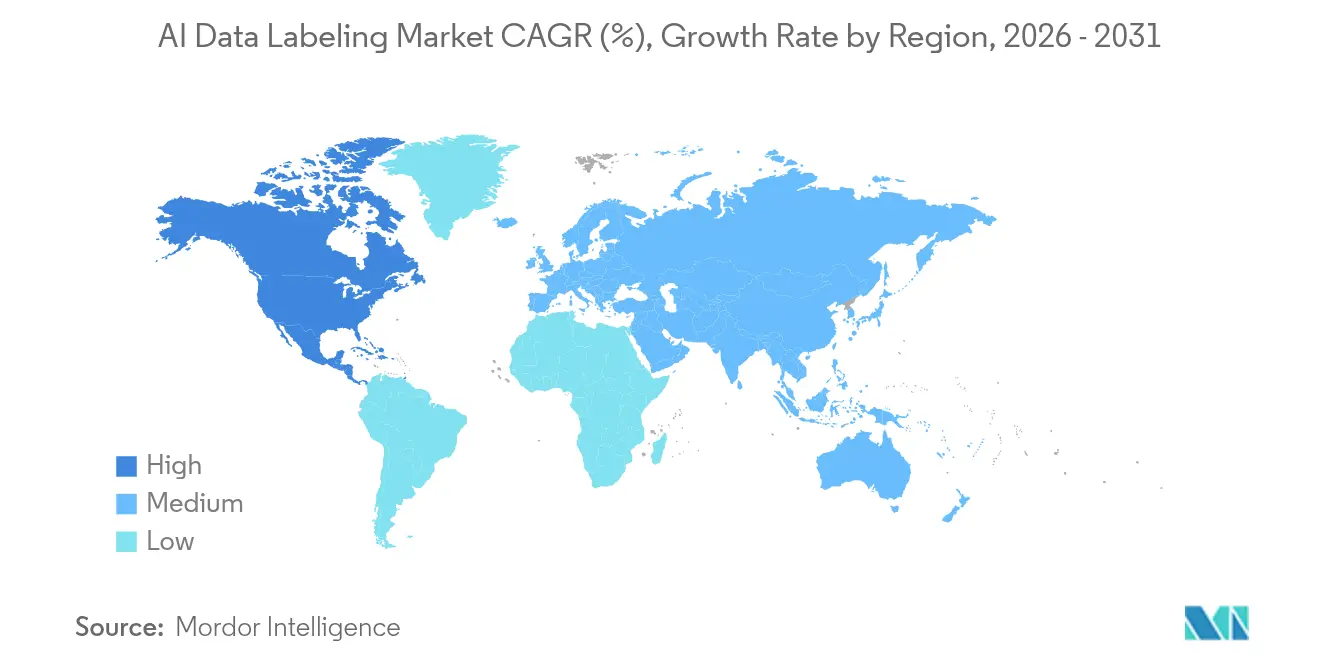
| Fastest Growing Market | Asia Pacific |
| Largest Market | North America |
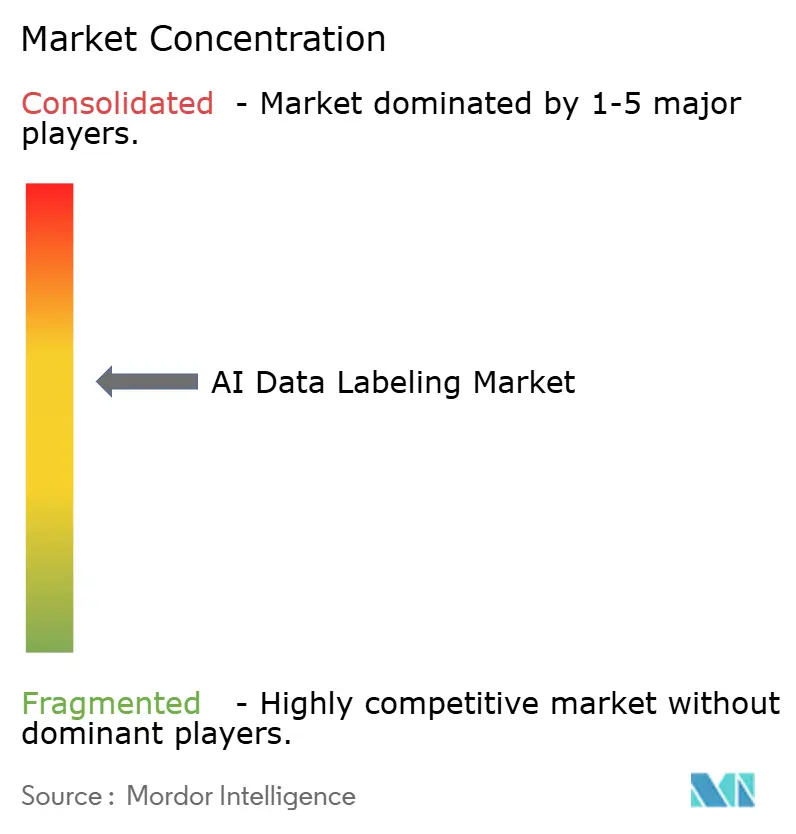
| Market Concentration | Medium |
Major Players *Disclaimer: Major Players sorted in no particular order Image © Mordor Intelligence. Reuse requires attribution under CC BY 4.0. | |
AI Data Labeling Market Analysis by Mordor Intelligence
AI data labelling market size in 2026 is estimated at USD 2.32 billion, growing from 2025 value of USD 1.89 billion with 2031 projections showing USD 6.53 billion, growing at 22.95% CAGR over 2026-2031. The rapid scale-up reflects how data annotation has moved from a cost center to a strategic capability that underpins regulatory compliance, model alignment and enterprise differentiation. Intensifying autonomous-vehicle development, rising corporate investment in generative AI and the roll-out of legally binding audit requirements for training data are the largest tailwinds. Outsourced platforms that blend workforce scalability with automated quality assurance continue to capture share, while hybrid human-in-the-loop workflows advance labeling productivity across image, video and text assets. Geographic expansion is shaped by diverging privacy regimes and talent availability: North America maintains the largest demand base, Asia-Pacific posts the steepest growth, and Europe emphasizes auditable provenance.
Key Report Takeaways
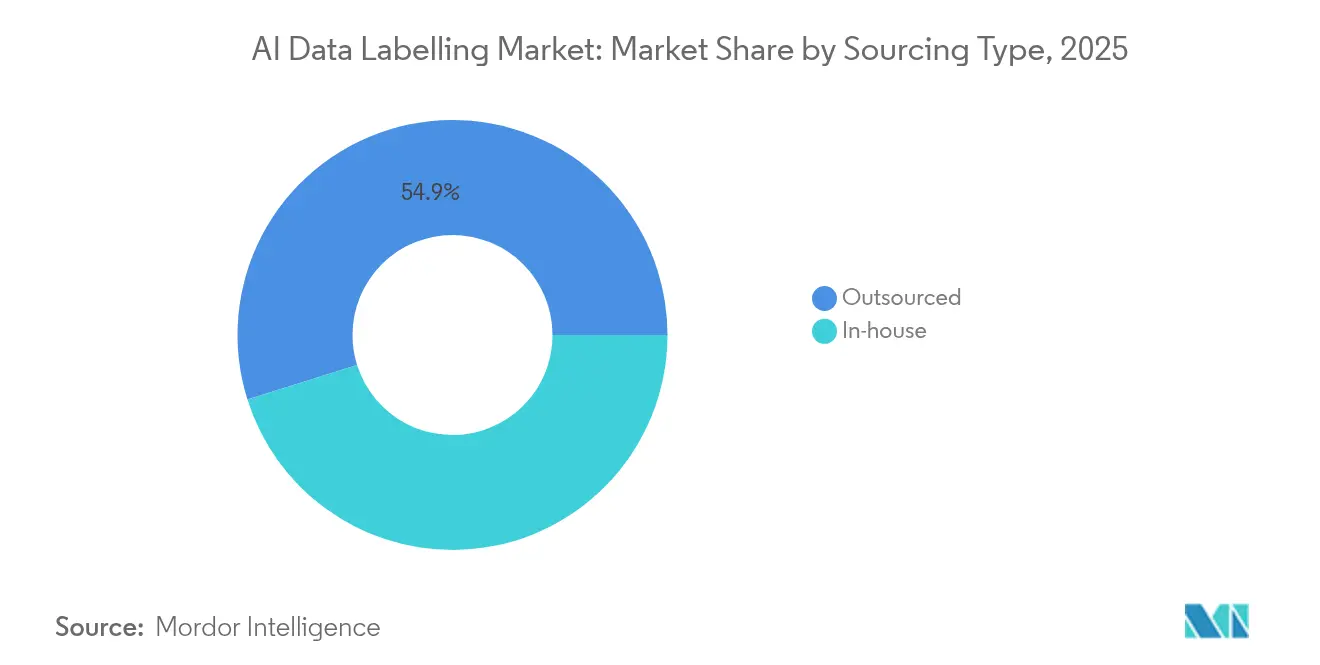
- By sourcing type, outsourcing captured 54.85% of AI data labelling market share in 2025; in-house operations lag growth as outsourced services expand at a 28.37% CAGR through 2031.
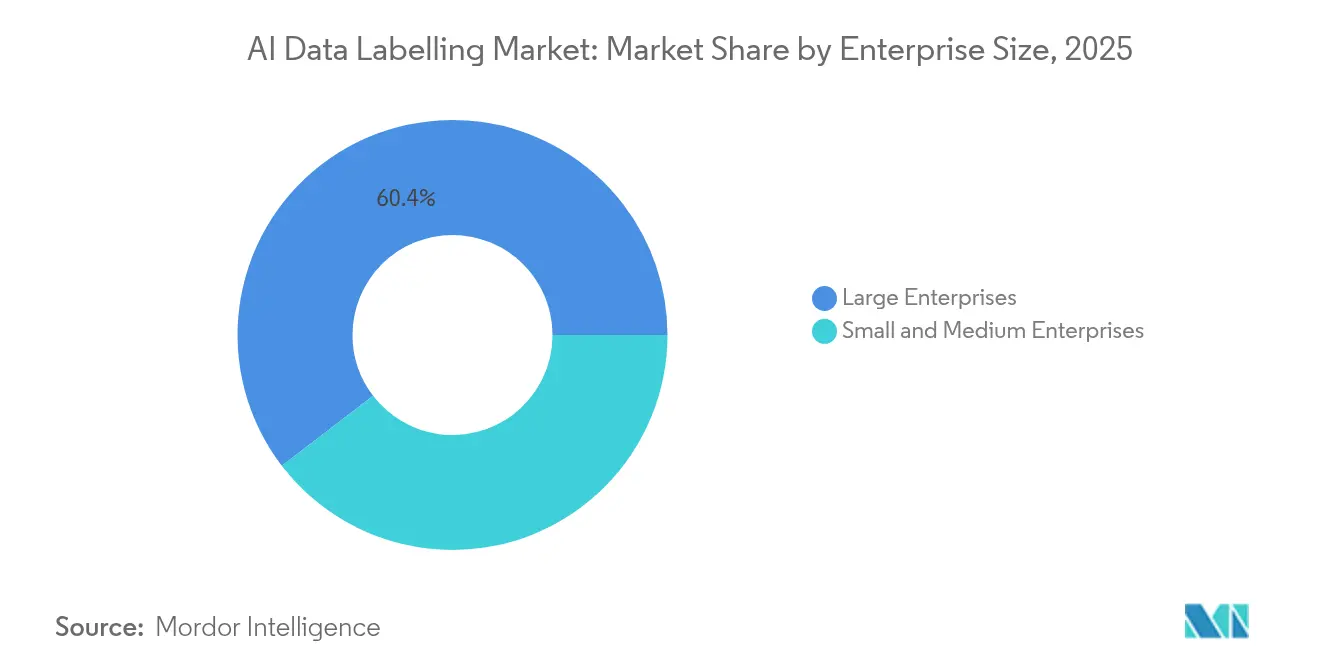
- By enterprise size, large enterprises held 60.40% of the AI data labelling market size in 2025, while SMEs post the fastest 26.42% CAGR to 2031.
- By data type, text annotation led with 27.30% of 2025 revenue; video is projected to rise at a 31.18% CAGR to 2031.
- By labeling method, manual workflows retained 78.10% share in 2025; semi-supervised and human-i-the-loop methods accelerate at a 33.15% CAGR.
- By end-user industry, automotive and mobility held 23.10% market share in 2025; healthcare advances at a 24.63% CAGR on policy support for medical-imaging marketplaces.
- By region, North America commanded 34.70% share in 2025, while Asia-Pacific is the fastest-growing region with a 23.35% CAGR through 2031.
Note: Market size and forecast figures in this report are generated using Mordor Intelligence’s proprietary estimation framework, updated with the latest available data and insights as of 2026.
Global AI Data Labeling Market Trends and Insights
Drivers Impact Analysis*
| Driver | (~) % Impact on CAGR Forecast | Geographic Relevance | Impact Timeline |
|---|---|---|---|
| Connected & autonomous vehicle penetration | +6.2% | North America, China, EU | Medium term (2-4 years) |
| Enterprise AI & big-data initiatives | +5.8% | North America, Asia-Pacific | Short term (≤ 2 years) |
| Generative-AI RLHF data pipelines | +4.1% | North America, EU, expanding to Asia-Pacific | Medium term (2-4 years) |
| Tightening AI-governance laws | +3.7% | EU, North America, spillover to Asia-Pacific | Long term (≥ 4 years) |
| Edge-AI silicon for continual learning | +2.9% | Global early adoption in North America, Asia-Pacific | Long term (≥ 4 years) |
| Synthetic datasets needing micro ground-truth | +2.3% | Global technology hubs | Medium term (2-4 years) |
| Source: Mordor Intelligence | |||
Rising penetration of connected and autonomous vehicles
Level-4 and Level-5 programs demand high-density LiDAR point-cloud, 3D cuboid and temporal video labels that capture regional driving idiosyncrasies. Automotive OEMs emphasize inference efficiency, so annotation guidelines now incorporate object-size priors and occlusion metadata that compress model parameters without eroding perception accuracy. Safety regulators in China and the EU require provenance evidence, turning compliant labeling pipelines into competitive shields that favor vendors with integrated documentation workflows[2]Source: BasicAI, “Advanced 3D LiDAR Annotation Techniques for Autonomous Driving,” basic.ai.
Proliferation of enterprise AI and big-data initiatives
Financial-services, retail and telecom operators are expanding proprietary document and interaction datasets that need domain-specific tagging to unlock predictive risk analytics, next-best-action engines and hyper-personalized marketing. Reinforcement learning from human feedback (RLHF) multiplies demand for skilled reviewers who rate model helpfulness, reshaping service-level agreements around subject-matter depth rather than annotation volume.
Emergence of generative-AI RLHF data pipelines
RLHF tasks—including open-ended comparative ranking, safety trigger identification and contradiction spotting—command premium rates and longer workforce ramps. Providers scaling to meet demand invest in evaluator training programs and statistical error-prediction models that catch inconsistencies before customer review. Apple researchers showed predictive algorithms can flag 65-75% of likely mistakes, anchoring new quality benchmarks.
Tightening AI-governance laws demanding auditable ground-truth
The EU AI Act and the French CNIL guideline package require clear disclosure of data sources, consent status and annotation protocols throughout model life cycles. Comparable rules from the Monetary Authority of Singapore create sector-specific obligations for financial institutions. Providers equipped with granular audit trails, role-based access controls and encrypted labeling environments gain preferred-vendor status for cross-border deployments.
Restraints Impact Analysis*
| Restraint | (~)% Impact on CAGR Forecast | Geographic Relevance | Impact Timeline |
|---|---|---|---|
| Data-privacy and IP-security concerns | −2.8% | EU, North America | Short term (≤ 2 years) |
| Shortage of expert annotators | −2.1% | Global high-skill domains | Medium term (2-4 years) |
| Rising labor cost inflation | −1.7% | North America, Western Europe | Short term (≤ 2 years) |
| Commoditization pressure from synthetic data | −1.4% | Global technology hubs | Medium term (2-4 years) |
| Source: Mordor Intelligence | |||
Data-privacy and IP-security concerns
Mandatory data-localization statutes and zero-trust vendor audits increase overhead for distributed workforces. Enterprises handling medical scans or financial transactions limit remote access, pushing providers to spin up sovereign clouds and on-premise workbenches that comply with encryption, key-management and audit-log mandates. The extra investment raises costs and slows onboarding.
Shortage of expert annotators
Medical imaging, legal contract parsing and autonomous-driving edge cases require annotators with advanced credentials and longer training cycles. Average tenure of mid-level reviewers in major hubs such as India is 12-18 months, driving up churn and retraining expense. Hybrid AI-assisted tooling offsets volume gaps, but human validation remains essential for bias detection and performance guarantees[1]Source: NIST, “Human-in-the-Loop Evaluation Approaches for AI Systems,” nist.gov.
*Our forecasts treat driver/restraint impacts as directional, not additive. The impact forecasts reflect baseline growth, mix effects, and variable interactions.
Segment Analysis
By Sourcing Type: Outsourcing dominance accelerates
Outsourced providers generated 54.85% of AI data labelling market share in 2025 as enterprises prioritized speed and regulatory assurance. The segment’s 28.37% CAGR through 2031 positions it as the principal contributor to incremental revenue within the AI data labelling market. Hybrid contracts now pair offshore workforces with on-shore audit nodes to satisfy sovereignty clauses, creating a two-tier cost structure that entrenches platform vendors.
Internal teams persist for proprietary or highly sensitive projects but struggle to match the tooling breadth and compliance certifications achieved by specialized vendors. As synthetic data workflows mature, enterprises integrate external partners for micro-ground-truth verification rather than full-scale labeling, sustaining demand even when overall annotation volumes drop.


By Data Type: Video labelling emerges as growth leader
Video annotation’s 31.18% CAGR makes it the fastest-expanding slice of the AI data labelling market. Autonomous-vehicle stacks require 4K multi-camera feeds stitched with LiDAR meshes, elevating average project value relative to traditional image sets. Text assets still deliver 27.30% revenue share, driven by conversational AI tuning and document intelligence programs, but pricing compression is sharper because automated pattern matching can pre-label large fractions of data.
3D point-cloud tasks involving LiDAR and radar bring high entry barriers owing to specialist tooling and advanced geometric knowledge. Audio projects gain momentum from voice biometrics and call-center automation, yet remain a single-digit revenue segment. Multi-modal mandates that synchronize text, image, video and sensor streams underpin new bundled offerings that reward providers with full-stack orchestration capabilities.
By Labeling Method: Semi-supervised revolution accelerates
Manual annotation maintained 78.10% share in 2025 in the overall AI data labelling market size, underscoring the continued need for human judgment in safety-critical contexts. Nonetheless, semi-supervised and human-in-the-loop methods deliver a 33.15% CAGR and set a new productivity baseline across the AI data labelling market. Active-learning query strategies now trim redundant samples by 30-40%, cutting cycle times without eroding recall.
Automated labeling engines handle simple bounding-box or sentiment-classification tasks but hand off ambiguous instances to expert reviewers. Large language models increasingly generate first-pass labels for niche taxonomies, which humans refine. Providers differentiate using statistical quality controls—such as inter-annotator agreement scoring and sampling audits—that sustain trust while scaling throughput.
By Enterprise Size: SME adoption accelerates digital transformation
Large enterprises market share command 60.40% of AI data labelling market size in 2025 on the back of complex autonomous-driving, medical-imaging and defense projects. Yet SMEs advance at a 26.42% CAGR as pay-as-you-go cloud tooling lowers entry barriers. Industry-specific templates enable smaller retailers, insurers and manufacturers to stand up models with limited internal machine-learning staff, widening the demand base for standardized annotation pipelines.
Hybrid subscription packages bundle labeling credits with model evaluation dashboards, reducing procurement friction for finance and compliance stakeholders. High-growth midsize firms embrace outsourced micro-task models that flex with seasonal volumes, while retaining core test datasets in-house for governance. Upskilling grants from regional governments further catalyze SME participation across the AI data labelling market.
By End-User Industry: Healthcare leads growth transformation
Healthcare and life sciences market share post a 24.63% CAGR through 2031, outpacing all other verticals within the AI data labelling industry. FDA-backed imaging repositories accelerate algorithm validation, prompting demand for pixel-level organ segmentation, lesion delineation and multimodal omics fusion. Automotive and mobility retains the largest revenue slice at 23.10% in 2025, but regulatory crash-safety audits drive continuous dataset refreshes that sustain spend.
Financial institutions ramp anti-fraud and KYC workflows requiring document labeling and transaction-graph annotation. Industrial robotics uses vision-based defect detection that hinges on balanced class distribution, while telecom carriers annotate network-event logs to feed self-optimizing RAN controllers. Each vertical’s distinct compliance code prompts tailored service-level agreements that reinforce specialization and pricing power across the AI data labelling market.
Geography Analysis
North America generated 34.70% of 2025 revenue and remains the single-largest buyer cohort of the AI data labelling market. Scale AI’s multiyear Thunderforge defense award underscores federal demand for high-assurance annotation pipelines. United States healthcare and autonomous-driving ecosystems reinforce volume, while Canada’s cross-border automotive supply chain fuels bilingual image and text projects. Mexico’s near-shore hubs win overflow work that balances cost and proximity, though CCPA and sector-specific privacy mandates push providers to deploy secure domestic infrastructure. Rising compensation costs trigger near-shore expansion, but U.S. buyers still value domestic sovereign clouds for top-secret workloads.
Asia-Pacific delivers the fastest regional CAGR of 23.35% through 2031, elevating its contribution to the AI data labelling market each year. China invests USD 45 billion in AI infrastructure and mandates content-labeling standards that stimulate domestic provider scale. India’s annotation workforce climbs past 450,000 reviewers, serving global contracts while anchoring indigenous model development. Japan focuses on surgical-robot vision and radiology annotation, generating high-margin demand for medically certified professionals. South Korea’s nascent AI Basic Act positions telecom and automotive conglomerates to externalize vast multi-sensor datasets. ASEAN financial hubs embrace AI risk-management frameworks, and Australia targets precision-agriculture vision datasets that support drought prediction.
Europe sustains stable mid-teens growth as GDPR, the EU AI Act and CNIL guidelines institutionalize provenance audits. Local providers deploy privacy-preserving annotation sandboxes with on-premise compute to satisfy strict personal-data rules. Germany pioneers industrial robotics labeling, while the United Kingdom’s financial-services sector commissions conversational AI alignment datasets despite data-transfer complexities after Brexit. Nordic governments fund sustainable-energy AI programs that necessitate satellite-imagery annotation, and Southern Europe rides tourism-analytics projects. Across all member states, bias-mitigation deliverables and explainability reports influence vendor shortlists, reinforcing the region’s compliance-driven premium.

Competitive Landscape
The AI data labelling market features moderate fragmentation: no single vendor controls more than one-fifth of global spend, yet scale players such as Scale AI, Appen and iMerit wield purchasing leverage across tooling ecosystems. Scale AI’s USD 14 billion valuation rests on integrated platform breadth, from RLHF workflows to secure enclave deployment, underpinned by federal contracts that demand continuous penetration-testing certification. Appen broadens automated-quality-check capabilities to protect margins as labor costs rise, while iMerit leverages domain mentorship programs to secure healthcare and geospatial projects.
Platform entrants differentiate by fusing annotation and evaluation dashboards, letting clients orchestrate data pre-processing, labeling, test-set curation and ongoing model health monitoring from a single interface. Quality-assurance engines that use statistical sampling and auto-triaging of edge cases reduce revision cycles by 15-25%. Established technology giants embed labeling modules in their cloud AI suites, tightening integration but raising neutrality concerns among multi-cloud users.
Programmatic-labeling pioneers such as Snorkel AI champion weak-supervision frameworks that allow data scientists to codify heuristics rather than hand-label millions of examples. Synthetic-data vendors partner with labeling specialists for spot-check verification, illustrating that human oversight remains indispensable where safety and bias are on the line. Regulation mandates immutable audit trails, encryption at rest and role-based access that smaller rivals struggle to fund, pushing the market toward a barbell structure of large full-stack platforms and niche domain experts.
AI Data Labeling Industry Leaders
Appen Limited
Scale AI Inc.
Amazon Web Services
Google LLC
CloudFactory Ltd.
- *Disclaimer: Major Players sorted in no particular order

Recent Industry Developments
- March 2025: Scale AI secured a multi-million-USD Defense Department contract under the Thunderforge program to support AI-assisted operational planning in partnership with Anduril and Microsoft.
- February 2025: The French CNIL published detailed AI compliance recommendations that require explicit disclosure of training-data sources and annotation standards, elevating demand for auditable labeling pipelines.
- December 2024: iSoftStone appeared on the China Academy of Information and Communications Technology’s “Artificial Intelligence Data Annotation Industry Map,” validating the firm’s multi-city platform rollout.
- April 2024: Bayer and Google Cloud launched a collaboration to build generative-AI radiology tools using curated medical-image labels on Google’s Vertex AI environment.


Research Methodology Framework and Report Scope
Market Definitions and Key Coverage
Mordor Intelligence defines the AI data labeling market as the revenue earned from services that tag, classify, or enrich raw digital assets, including images, video, text, audio, and 3-D point clouds, so the resulting labeled datasets can train or validate machine-learning models. Sales of pure software platforms are tracked only when they are bundled with per-asset labeling services; standalone licensing fees, synthetic-data engines, and raw data collection activities are excluded.
Scope exclusion: Stand-alone annotation tool licenses, synthetic data generation, and data brokerage revenues lie outside our market boundary.
Segmentation Overview
- By Sourcing Type
- In-house
- Outsourced
- By Data Type
- Text
- Image
- Audio
- Video
- 3-D Point-Cloud
- By Labeling Method
- Manual
- Automatic
- Semi-supervised / Human-in-loop
- By Enterprise Size
- Small and Medium Enterprises
- Large Enterprises
- By End-user Industry
- Automotive and Mobility
- Healthcare and Life-Sciences
- Retail and E-commerce
- BFSI
- IT and Telecom
- Industrial and Robotics
- Others (Agriculture, Media, etc.)
- By Geography
- North America
- United States
- Canada
- Mexico
- South America
- Brazil
- Argentina
- Rest of South America
- Europe
- United Kingdom
- Germany
- France
- Italy
- Spain
- Nordics
- Rest of Europe
- Middle East and Africa
- GCC
- Israel
- South Africa
- Rest of Middle East and Africa
- Asia-Pacific
- China
- India
- Japan
- South Korea
- ASEAN
- Australia
- New Zealand
- Rest of Asia-Pacific
- North America
Detailed Research Methodology and Data Validation
Primary Research
We interview data-science leads at autonomous-vehicle developers, chief compliance officers in healthcare AI, and Asia-Pacific annotation service providers to test price points, asset-level throughput, and rejection rates gleaned from desk work. Regional buyer surveys further anchor emerging spend patterns among SMEs versus large enterprises.
Desk Research
Our analysts start by compiling trade statistics and regulatory filings from sources such as the U.S. Census Service Annual Survey, Eurostat ICT statistics, the Japan Electronics and Information Technology Industries Association, and patent analytics accessed through Questel. Supplementary inputs flow from SEC 10-Ks, vendor investor decks, and specialist portals like WSTS (chip volumes driving dataset demand) and Dow Jones Factiva news archives. These sources clarify project pipelines, unit costs, and outsourcing intensity across end-user sectors. The list is indicative; numerous other publications inform the evidence base.
Market-Sizing & Forecasting
A top-down demand pool build, linking global AI project counts, average labeled-asset volumes, and prevailing price per asset, is cross-checked through selective bottom-up supplier roll-ups. Key variables include million-image equivalents per model iteration, outsourced project share, EU AI Act documentation cost uplift, generative-AI dataset refresh frequency, and average annotation wage in major hubs. Multivariate regression, supported by expert-validated assumptions, projects each driver to 2030; results adjust where bottom-up tallies deviate beyond an internal variance band.
Data Validation & Update Cycle
Outputs pass anomaly checks, peer review, and management sign-off. We refresh the model annually, issuing interim revisions when material events, such as funding spikes, regulatory rulings, or major contract awards, shift the baseline. A fresh analyst pass precedes every client delivery to ensure timeliness.
Why Mordor's AI Data Labeling Baseline Is Dependable
Estimates published across the industry often diverge because firms pick different revenue buckets, price assumptions, and update rhythms. Our disciplined scope, refreshed variables, and transparent recalibration make the difference.
Key gap drivers include whether data-collection fees are bundled with labeling, how synthetic data is treated, and the cadence at which average selling prices are rebased for currency or wage inflation.
Benchmark comparison
| Market Size | Anonymized source | Primary gap driver |
|---|---|---|
| USD 1.89 B | Mordor Intelligence | - |
| USD 4.89 B | Global Consultancy A | Combines collection and labeling plus tool licensing; limited sourcing-type splits |
| USD 4.87 B | Trade Journal B | Adds crowdsourcing platform revenue and AI training dataset sales; geographic scope unclear |
These contrasts show that Mordor Intelligence delivers a balanced, clearly scoped baseline that decision-makers can trace back to explicit variables and repeatable steps, giving clients greater situational confidence.


Key Questions Answered in the Report
What is the current size of the AI data labelling market?
The AI data labelling market size is USD 2.32 billion in 2026 with a forecast to reach USD 6.53 billion by 2031.
Which region leads the AI data labelling market?
North America holds the largest 34.70% share due to early enterprise adoption, though Asia-Pacific records the fastest growth at a 23.35% CAGR.
Why is video annotation growing faster than other data types?
Autonomous-vehicle development and surveillance AI require high-resolution, multi-frame labeling, driving a 31.18% CAGR for video projects.
How are tightening regulations affecting data-labeling demand?
Regimes such as the EU AI Act mandate auditable training-data provenance, prompting enterprises to contract providers with certified quality and privacy controls.
What is RLHF and why does it matter for labeling?
Reinforcement Learning from Human Feedback aligns large language models with user intent; it relies on skilled annotators to review and score model outputs, creating premium service demand.
Are SMEs adopting AI data labeling services?
Yes, SMEs exhibit a 26.42% CAGR as cloud-based platforms and pre-built templates reduce the technical and cost barriers to launching AI projects.
Page last updated on:


