
Africa Telecom Infrastructure Asset Monetization Market Size and Share
Market Overview
| Study Period | 2020 - 2031 |
|---|---|
| Forecast Data Period | 2026 - 2031 |
| Base Year Market Size (2025) | USD 4.85 Billion |
| Market Size (2026) | USD 5.18 Billion |
| Market Size (2031) | USD 7.21 Billion |
| Growth Rate (2026 - 2031) | 6.84 % |
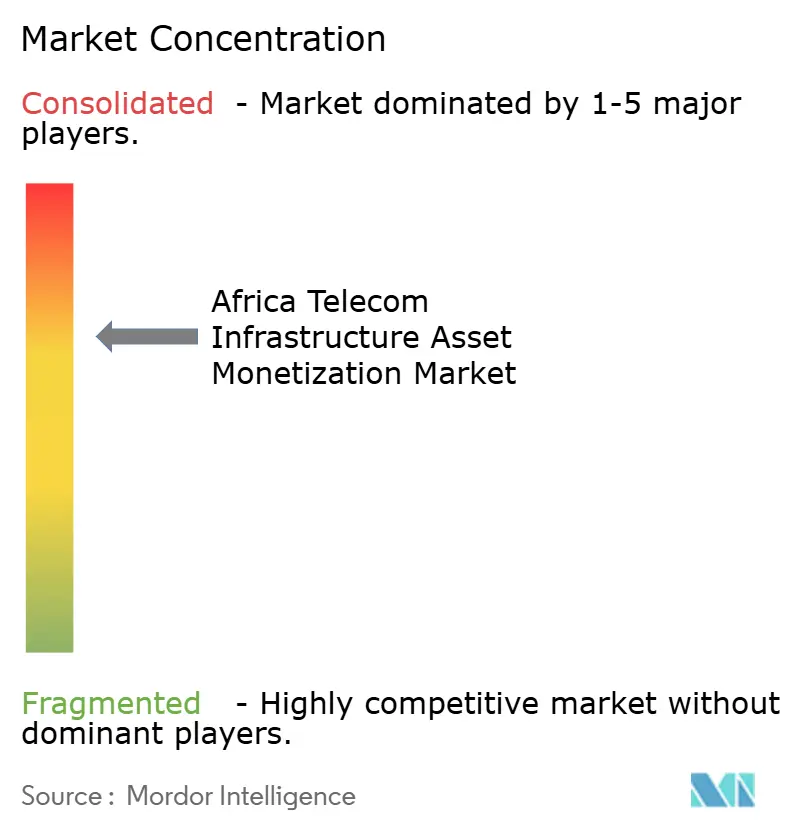
| Market Concentration | Medium |
Major Players *Disclaimer: Major Players sorted in no particular order Image © Mordor Intelligence. Reuse requires attribution under CC BY 4.0. | |
Africa Telecom Infrastructure Asset Monetization Market Analysis by Mordor Intelligence
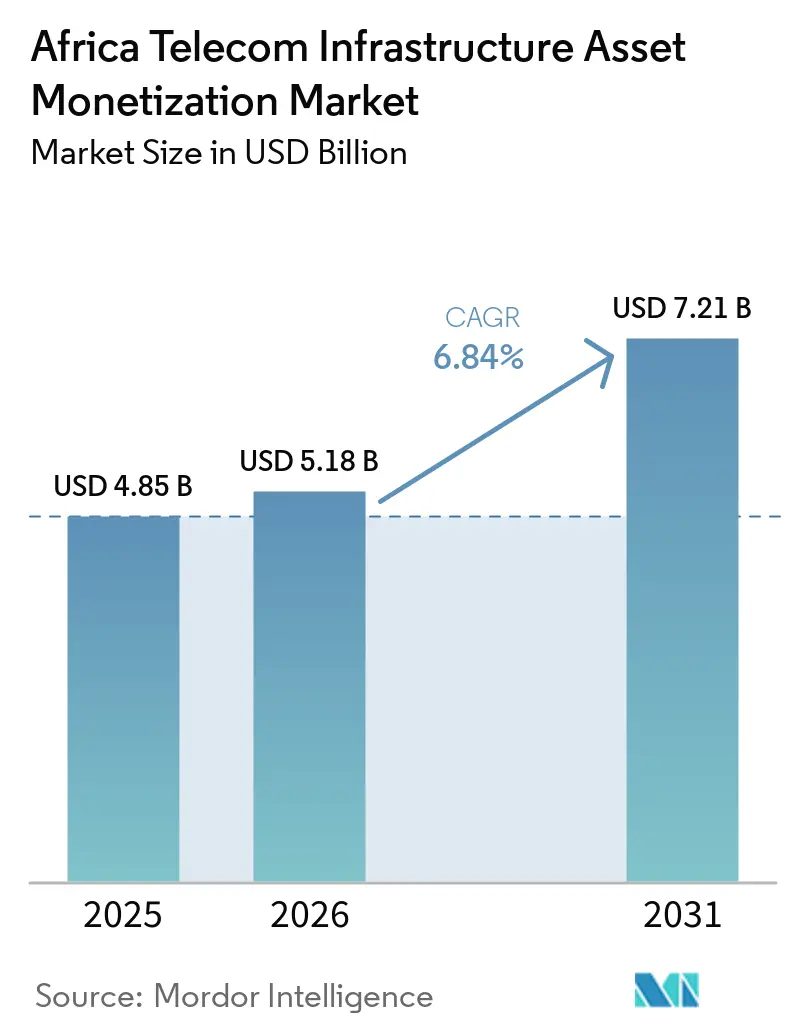
The Africa telecom infrastructure asset monetization market size is expected to grow from USD 4.85 billion in 2025 to USD 5.18 billion in 2026 and is forecast to reach USD 7.21 billion by 2031 at 6.84% CAGR over 2026-2031. The Africa telecom infrastructure asset monetization market is shaped by the continuing transfer of passive network assets from mobile operators to specialist owners. This separation gives operators capital for network investment while creating recurring lease income for tower companies and infrastructure investors. Demand is also reinforced by denser 4G and 5G networks, which require more capacity at existing sites and additional coverage locations. The Africa telecom infrastructure asset monetization market faces a contrasting strategic development because MTN Group’s proposed acquisition of IHS Holding could return a major independent portfolio to operator control. Currency pressure, sovereign risk, and high financing costs remain material constraints on transaction values and new construction.
Key Report Takeaways
- By asset class, macro towers led with a 46.22% revenue share in 2025, while small cells and distributed antenna systems are projected to expand at a 7.11% CAGR through 2031 in the Africa telecom infrastructure asset monetization market.
- By ownership and provider type, independent TowerCos held 48.46% revenue share in 2025, while infrastructure funds and private equity platforms are expected to expand at a 7.26% CAGR through 2031.
- By revenue model, colocation lease revenue accounted for 55.28% of the Africa telecom infrastructure asset monetization market in 2025, while power-pass-through and energy services revenue is projected to expand at a 7.17% CAGR through 2031.
- By geography, Nigeria accounted for 25.28% of revenue in 2025, while Egypt is projected to expand at a 7.33% CAGR through 2031.
Note: Market size and forecast figures in this report are generated using Mordor Intelligence’s proprietary estimation framework, updated with the latest available data and insights as of January 2026.
Market Trends and Insights
Drivers Impact Analysis of Africa Telecom Infrastructure Asset Monetization Market*
| Driver | (~) % Impact on CAGR Forecast | Geographic Relevance | Impact Timeline |
|---|---|---|---|
| MNO Balance-Sheet Optimization Through Sale-Leasebacks | +1.5% | Nigeria, South Africa, Pan-Africa | Medium term (2-4 years) |
| 4G and 5G Coverage Expansion | +1.4% | Pan-Africa, Nigeria and Egypt most prominent | Long term (≥ 4 years) |
| Rising Mobile Data Consumption and Smartphone Penetration | +1.2% | Pan-Africa, strongest in Nigeria and South Africa | Medium term (2-4 years) |
| Rural Coverage Mandates and Universal-Service Funding | +0.9% | Nigeria, Rest of Africa, southern African markets | Long term (≥ 4 years) |
| Renewable-Power Retrofits Creating New Infrastructure Cash Flows | +0.6% | Nigeria, Ethiopia, Pan-Africa off-grid markets | Medium term (2-4 years) |
| Active-Sharing and Neutral-Host Adoption | +0.4% | Nigeria, Uganda, DRC, Tanzania | Long term (≥ 4 years) |
| Source: Mordor Intelligence | |||
MNO Balance-Sheet Optimization Through Sale-Leasebacks
Sale-leasebacks remain the primary route through which operators release capital held in tower portfolios across the Africa telecom infrastructure asset monetization market. Operators earn largely local-currency revenue while servicing debt that is often denominated in foreign currencies, making portfolio sales an important cash-flow tool. An Actis-led consortium recently completed its acquisition of Swiftnet from Telkom South Africa in a transaction valued at several hundred million dollars.[1] The transaction created an independent platform with more than 4,000 sites and showed that mature operators still see value in separating passive assets. IHS Towers completed the sale of its Rwanda operations to Paradigm Tower Ventures and a consortium that included British International Investment and PROPARCO. Such secondary transactions provide clearer valuation evidence for future sellers, buyers, and financing partners in the Africa telecom infrastructure asset monetization market.[2]
4G and 5G Coverage Expansion
The 4G and 5G rollout is changing site economics because network capacity requires both new locations and more equipment at existing locations. Monthly mobile data traffic in Sub-Saharan Africa is forecast to rise from 2.8 exabytes in 2025 to 9.7 exabytes by 2031.[3] This traffic increase requires denser networks and supports demand for shared towers, rooftop sites, and fiber-connected locations. Nigeria expanded its next-generation mobile network footprint across multiple states as operators increased infrastructure spending. The rollout strengthens the case for the Africa telecom infrastructure asset monetization market because each technology layer can add lease revenue without requiring a new tower structure. It also increases the value of sites that can accommodate several operators and radio technologies at the same location.
Rising Mobile Data Consumption and Smartphone Penetration
Rising smartphone use increases the commercial value of occupied sites even when an operator does not add a new tenant. Average monthly data use per active smartphone in Sub-Saharan Africa is expected to rise significantly over the forecast period. In Kenya, 5G users consume substantially more data each month than 4G users. These usage patterns require stronger backhaul and greater capacity at tower sites that carry mobile traffic. Mobile technologies make a significant economic contribution across Africa, and their role is expected to expand further over the forecast period. The deeper economic role of connectivity supports continued infrastructure spending across the Africa telecom infrastructure asset monetization market.
Rural Coverage Mandates and Universal-Service Funding
Public connectivity programs can make rural sites investable where private returns alone would not support construction. Universal service funds in Africa provide support for coverage in locations that operators would otherwise consider commercially marginal. Nigeria’s USPF, Kenya’s Communications Authority USF, and South Africa’s USAF have each used funding mechanisms to address underserved areas. South Africa’s February 2026 USAF framework supported technology-neutral incentives for rural tower construction and the use of existing mobile infrastructure. Mozambique’s regulator, INCM, opened a tender in August 2025 for a rural connectivity project covering at least 30 locations. These programs enlarge the possible site pipeline for the Africa telecom infrastructure asset monetization market and reduce the risk of building in remote corridors.
Restraints Impact Analysis of Africa Telecom Infrastructure Asset Monetization Market*
| Restraint | (~) % Impact on CAGR Forecast | Geographic Relevance | Impact Timeline |
|---|---|---|---|
| Foreign-Exchange Mismatch and Sovereign Risk | -1.2% | Nigeria, Egypt, Pan-Africa | Short term (≤ 2 years) |
| High Cost of Capital and Debt Refinancing | -0.9% | Pan-Africa | Medium term (2-4 years) |
| Permitting, Land Access, and Right-of-Way Delays | -0.6% | Nigeria, Rest of Africa | Short term (≤ 2 years) |
| Diesel Logistics, Theft, and Weak-Grid Dependence | -0.4% | Nigeria, Rest of Africa, off-grid markets | Medium term (2-4 years) |
| Source: Mordor Intelligence | |||
Foreign-Exchange Mismatch and Sovereign Risk
Currency mismatch is a persistent constraint for the Africa telecom infrastructure asset monetization market. Tower leases are commonly denominated in USD, while mobile operators collect revenue in local currencies. Currency weakness can reduce the real value of rent and place pressure on the financial position of anchor tenants. The Bank for International Settlements reported in 2025 that higher energy and fertilizer prices intensified fiscal pressure across African economies with already elevated public debt burdens. These conditions can weaken sovereign credit quality and raise risk around government-linked tenants and payments. Standard hedging tools only partly address these pressures because the underlying mismatch is embedded in operating cash flows.
High Cost of Capital and Debt Refinancing
Affordable long-duration capital remains difficult to obtain for African infrastructure platforms. Afreximbank found that many African countries faced debt-service burdens above a critical revenue threshold, while its analysis projected that more countries would fall below the International Monetary Fund’s recommended import-cover benchmark. IHS Towers recently issued a major bond offering, but the transaction illustrated the difficulty of placing African tower debt in challenging market conditions. Larger platforms can generally refinance on more workable terms than smaller individual-country businesses. The gap restricts acquisitions and build-to-suit activity in the Africa telecom infrastructure asset monetization market, particularly for private-equity-backed platforms.
*Our forecasts treat driver/restraint impacts as directional, not additive. The impact forecasts reflect baseline growth, mix effects, and variable interactions.
Africa Telecom Infrastructure Asset Monetization Market Segment Analysis
By Asset Class:
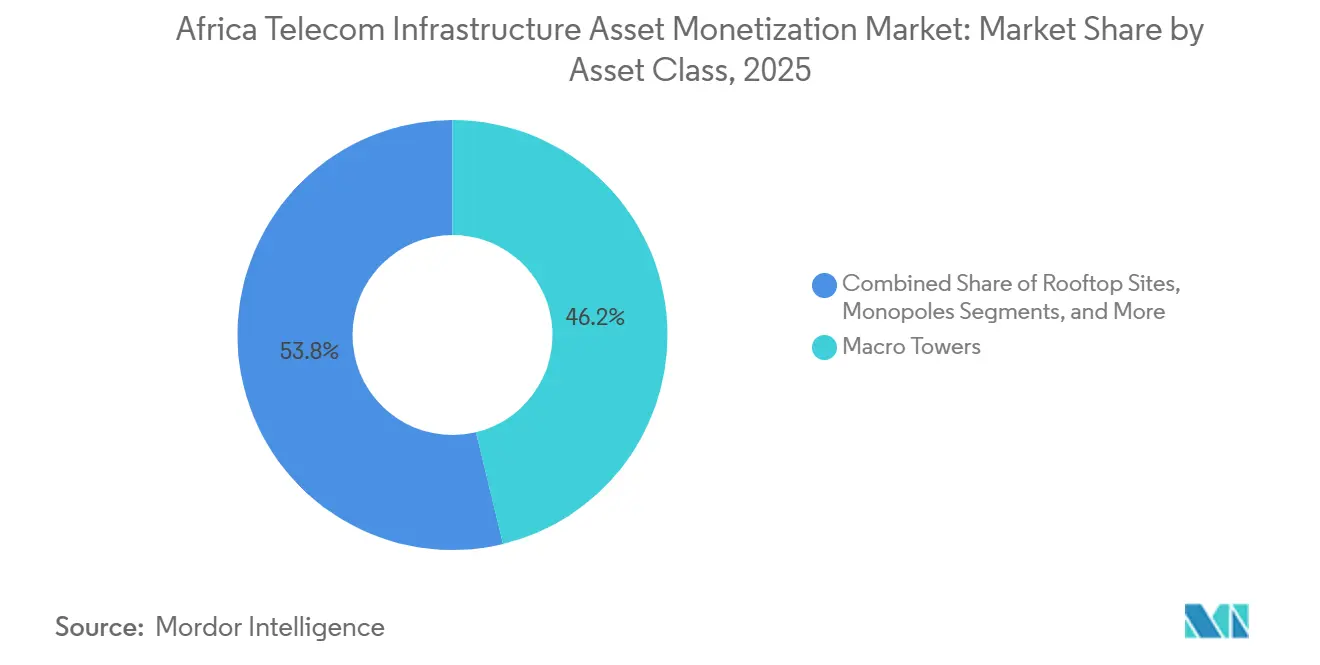
Macro Towers Lead as Dense Networks RiseMacro towers accounted for 46.22% of the Africa telecom infrastructure asset monetization market size in 2025, supported by the installed base and continuing coverage needs in semi-rural areas. These structures remain suitable for communities that are too large for small-cell networks but lack sufficient urban rooftop coverage. Their commercial position is strengthened when operators place 3G, 4G, and 5G equipment on the same structure. Each added technology layer can produce lease income without the civil cost of a new site. Macro sites also support the anchor layers needed for wider 4G coverage and early 5G deployment. Their multi-tenant format allows operators to share a location while keeping separate radio equipment. This operating model makes macro towers central to the Africa telecom infrastructure asset monetization market. The assets also remain important for backhaul connections and coverage beyond major city centers. Site owners, therefore, retain an incentive to improve power availability and access arrangements at established macro locations. The installed base gives established tower companies a practical advantage in meeting near-term coverage needs.
Small cells and distributed antenna systems are projected to expand at a 7.11% CAGR from 2026 to 2031. They address dense urban traffic where macro networks alone cannot supply adequate capacity. Multi-operator small cells can host signals from several carriers at one location, reducing duplication of equipment. Published telecom analysis indicated that shared small-cell sites could account for 25% of new urban deployments in markets such as Nigeria and Kenya. This model creates a neutral-host income stream for infrastructure owners. Small cells can also be placed closer to users in commercial districts, transport hubs, and other high-demand locations. Distributed antenna systems provide an alternative where multiple indoor or localized antennas are needed. SBA Communications has identified distributed antenna systems and small cells as an expansion category alongside traditional tower products. The expansion of these assets depends on access to fiber, reliable power, and agreements with municipalities and property owners. Their role will become more important as operators handle higher data volumes in dense cities.

By Ownership and Provider Type:
TowerCos Dominate as Private Equity Drives Faster GrowthIndependent TowerCos held 48.46% of the Africa telecom infrastructure asset monetization market share in 2025. Their position reflects the sale-leaseback transactions completed by major operators between 2012 and 2022. These platforms combine site management, multi-tenant operations, and access to capital across several countries. Scale can lower procurement and operating costs across a wider site portfolio. Independent owners can also attract tenants beyond the operator that first sold the asset. This helps convert a single-tenant site into a higher-yield shared location. Mobile network operator-owned platforms retain a meaningful role where portfolio sales remain early, or site inventories are too small for external buyers. Some operators also retain assets when they consider direct control essential to their network strategy. The ownership mix, therefore, varies significantly by country and operator. The Africa telecom infrastructure asset monetization industry continues to depend on whether operators see site ownership or capital release as the more valuable option.
Infrastructure funds and private equity platforms are projected to expand at a 7.26% CAGR through 2031. Institutional investors view tower portfolios as infrastructure assets with recurring contract-based revenue and potential tenancy growth. The March 2025 Swiftnet transaction shows how private capital can target assets that have already passed through one monetization cycle. Such assets may have clearer operating records and more visible opportunities for additional tenants. The approach can support both acquisitions and new construction. It can also bring capital to markets that global tower companies consider too small or complex. However, higher financing costs can narrow the return available from these investments. Investors must also assess currency exposure, local regulation, land rights, and power costs before committing capital. The Africa telecom infrastructure asset monetization industry benefits when platforms can apply operating standards across multiple countries. Secondary transactions may give private owners a route to future institutional exits once portfolios reach greater scale.
By Revenue Model:
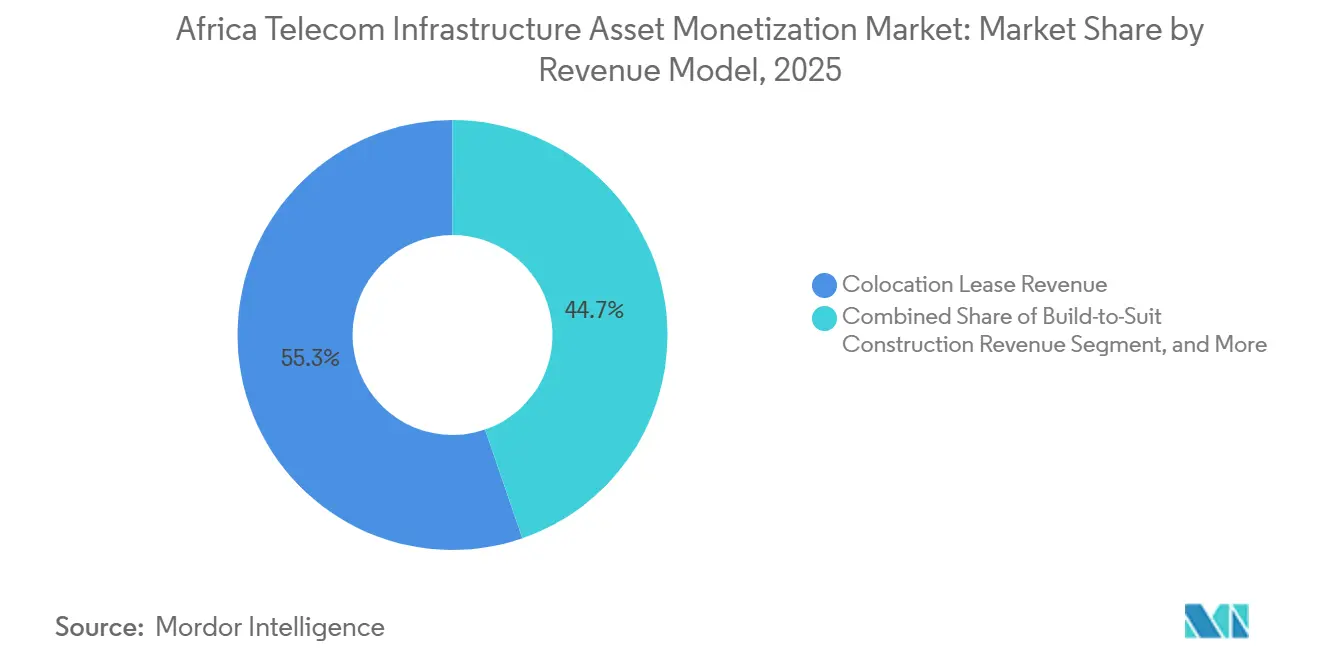
Colocation Leases Lead as Energy Revenue GrowsColocation lease revenue represented 55.28% of the Africa telecom infrastructure asset monetization market share in 2025. This share reflects master-lease agreements from earlier site sales and the continued addition of tenants. Colocation spreads the fixed cost of a tower across more than 1 operator. An added tenant can therefore improve earnings without a comparable increase in civil infrastructure costs. This model remains the central financial logic of the TowerCo business. Helios Towers expects substantial new tenancy additions and robust adjusted EBITDA performance. These targets demonstrate the importance of tenancy additions to the listed tower company's performance. Colocation revenue is also supported when operators add radio layers to existing locations. The Africa telecom infrastructure asset monetization market continues to reward assets that can safely accommodate multiple tenants. Long-term contracts provide greater revenue visibility than one-time construction work.
Power-pass-through and energy services revenue is projected to expand at a 7.17% CAGR through 2031. Energy can account for up to 60% of operating costs at off-grid tower locations in Africa. Solar hybrid systems can reduce diesel use and allow site owners to charge for an energy service rather than absorb the full cost. Ethio Telecom and Huawei deployed a Solar-on-Tower solution in Ethiopia that significantly reduced diesel generator use per site. IFC provided financing to support the modernization of thousands of tower sites across Ethiopia, Liberia, and Sierra Leone. The project is expected to deliver substantial power-cost reductions in Ethiopia. Fiber backhaul and neutral-host revenue remain smaller today but are becoming separate commercial offerings. These services strengthen the Africa telecom infrastructure asset monetization industry when tower owners can provide connectivity and energy solutions together. Their development depends on reliable contracts that clearly allocate fuel, power, and maintenance responsibilities. The model is particularly relevant in markets with weak grid access and high diesel logistics costs.
Geography Analysis
Nigeria Telecom Infrastructure Asset Monetization Market
Nigeria held 25.28% of the Africa telecom infrastructure asset monetization market size in 2025, reflecting its large mobile subscriber base, extensive tower portfolio, and ongoing 4G and 5G expansion. Nigerian operators made substantial investments in network infrastructure, including significant contributions from mobile network operators and tower companies. The sector is also committed to adding or upgrading a substantial number of telecom sites, with progress already underway. Nigeria’s 4G penetration increased markedly, adding technology layers that support colocation at existing macro locations. These conditions maintain Nigeria’s central role in the Africa telecom infrastructure asset monetization market.
Egypt and South Africa Telecom Infrastructure Asset Monetization Market
Egypt is projected to expand at a 7.33% CAGR through 2031, supported by a state-directed buildout, with plans for extensive site additions in the near term and further tower expansion over the following years. The government has also made substantial spectrum allocations to mobile operators and invested significantly in telecommunications infrastructure in recent years. South Africa remains a strategically important capital destination, with MTN South Africa committing substantial investment to network infrastructure through the medium term. South Africa has achieved broad 5G population coverage, while Helios Towers operates an established site portfolio with a strong tenancy ratio. These markets show distinct opportunities, with Egypt focused on planned expansion and South Africa supported by mature network investment.
Sub-Saharan Africa Telecom Infrastructure Asset Monetization Market
The Rest of Africa includes DRC, Tanzania, Ghana, Kenya, Ethiopia, and Côte d’Ivoire, where lower tower density relative to subscriber growth creates a substantial potential site pipeline. Helios Towers has committed significant investment to DRC and identified a large population without mobile coverage in the country. Mobile subscriptions across Sub-Saharan Africa are expected to grow steadily, while 4G connections continue to expand and 5G subscriptions increase rapidly. This pipeline places the Rest of Africa at the center of the Africa telecom infrastructure asset monetization market’s future opportunity.
Competitive Landscape
The Africa telecom infrastructure asset monetization market is moderately consolidated among leading independent TowerCos, including IHS Holding, American Tower Africa, and Helios Towers. MTN Group agreed in February 2026 to acquire the IHS Holding stake it did not already own for USD 2.2 billion in cash. The proposal valued IHS at USD 6.2 billion and covered nearly 29,000 towers in Nigeria, South Africa, Cameroon, Côte d’Ivoire, and Zambia. It could move a substantial independent portfolio under operator control and affect the supply available for third-party monetization. It also raises questions about access conditions for competing operators at sites controlled by their largest competitor.
American Tower Africa remains a large regional TowerCo operating across African markets, while Helios Towers raised its 2026 guidance to 3,500 to 4,000 tenancy additions. Helios also committed more than USD 500 million in discretionary capital expenditure between 2026 and 2030 through its IMPACT 2030 strategy. IHS Towers’ 2025 sale of its Rwanda business to Paradigm Tower Ventures showed that leading companies also use selective disposals to reshape country portfolios. These moves combine organic tenancy expansion with selective portfolio recycling. They also show how leading firms are adapting their portfolios as network traffic and capital conditions change.
Competitive openings are concentrated in smaller and frontier markets where global TowerCos see limited scale or higher operating complexity. Paradigm Infrastructure and Eastcastle Infrastructure use renewable-energy-focused site designs and neutral-host models in these corridors. MTN Group and Airtel Africa signed network-sharing agreements in Nigeria and Uganda in March 2025, while Airtel Africa and Vodacom Group signed a fiber-sharing agreement across Mozambique, Tanzania, and DRC in August 2025. Active sharing reduces duplicative greenfield builds but can support neutral-host platforms that serve multiple operators, shaping the Africa telecom infrastructure asset monetization market.
Africa Telecom Infrastructure Asset Monetization Industry Leaders
-
IHS Holding Limited
-
American Tower Corporation
-
Helios Towers Plc
-
SBA Communications Corporation
-
Eaton Corporation plc
- *Disclaimer: Major Players sorted in no particular order
Africa Telecom Infrastructure Asset Monetization Market Companies Covered in this Report
- American Tower Corporation
- IHS Holding Limited
- Helios Towers Plc
- SBA Communications Corporation
- Pan African Towers
- Atlas Tower Group
- Eastcastle Infrastructure
- Paradigm Infrastructure
- TowerCo of Africa
- MAST Services
- Swiftnet SOC Limited
- TASC Towers
- Eaton Towers
- Airtel Africa plc
- MTN Group Limited
- Vodacom Group Limited
- Orange S.A.
- Maroc Telecom S.A.
- Ethio Telecom
- Safaricom Plc
- Axian Telecom
Recent Industry Developments in Africa Telecom Infrastructure Asset Monetization Market
- July 2026: Helios Towers upgraded its full-year 2026 guidance, raising tenancy addition targets to 3,500-4,000, adjusted EBITDA guidance to USD 520 million-USD 535 million, and discretionary capex to USD 215 million-USD 245 million, following record H1 2026 performance in which total tenancies reached 34,455, up 13% year over year, and the tenancy ratio expanded to 2.26 times.
- June 2026: Ericsson reported that total mobile data traffic in Sub-Saharan Africa is forecast to increase from 2.8 exabytes per month in 2025 to 9.7 exabytes per month by 2031, reinforcing the need for denser 4G and 5G infrastructure.
- June 2026: GSMA reported that mobile technologies contributed USD 240 billion to Africa’s economy in 2025 and projected a contribution of USD 290 billion by 2030, supporting sustained investment in mobile network infrastructure.
- April 2026: MTN South Africa announced a 3-year capital commitment of ZAR 22 billion (USD 1.2 billion) for network infrastructure through 2028, following ZAR 6.8 billion (USD 370 million) invested in 2025.
Africa Telecom Infrastructure Asset Monetization Market Report Scope
Africa Telecom Infrastructure Asset Monetization Market refers to transactions and advisory services that unlock financial value from telecom infrastructure assets across African markets. It covers mobile towers, rooftops, fiber networks, ducts, power systems, data centers, small cells, and other passive infrastructure owned by operators, tower companies, utilities, and governments.
The Africa Telecom Infrastructure Asset Monetization Market Report is Segmented by Asset Class (Macro Towers, Rooftop Sites, Monopoles, Small Cells and DAS, Fiber Backhaul, and Power Systems), Ownership (Independent TowerCos, Mobile Network Operator-Owned Platforms, and Infrastructure Funds and Private Equity Platforms), Revenue Model (Colocation Lease Revenue, Build-to-Suit Construction Revenue, Managed Services and Operations Revenue, Power-Pass-Through and Energy Services Revenue, and Fiber Backhaul and Neutral-Host Revenue), and Geography (South Africa, Egypt, Nigeria, Rest of Africa). The Market Forecasts are Provided in Terms of Value (USD).
Segmentation Overview
| Macro Towers |
| Rooftop Sites |
| Monopoles |
| Small Cells and Distributed Antenna Systems |
| Fiber Routes and Backhaul Assets |
| Power Systems and Energy Infrastructure |
| Independent TowerCos |
| Mobile Network Operator-Owned Platforms |
| Infrastructure Funds and Private Equity Platforms |
| Other Ownership and Provider Types |
| Colocation Lease Revenue |
| Build-to-Suit Construction Revenue |
| Managed Services and Operations Revenue |
| Power-Pass-Through and Energy Services Revenue |
| Fiber Backhaul and Neutral-Host Revenue |
| South Africa |
| Egypt |
| Nigeria |
| Rest of Africa |
| By Asset Class | Macro Towers |
| Rooftop Sites | |
| Monopoles | |
| Small Cells and Distributed Antenna Systems | |
| Fiber Routes and Backhaul Assets | |
| Power Systems and Energy Infrastructure | |
| By Ownership and Provider Type | Independent TowerCos |
| Mobile Network Operator-Owned Platforms | |
| Infrastructure Funds and Private Equity Platforms | |
| Other Ownership and Provider Types | |
| By Revenue Model | Colocation Lease Revenue |
| Build-to-Suit Construction Revenue | |
| Managed Services and Operations Revenue | |
| Power-Pass-Through and Energy Services Revenue | |
| Fiber Backhaul and Neutral-Host Revenue | |
| By Geography | South Africa |
| Egypt | |
| Nigeria | |
| Rest of Africa |
Key Questions Answered in the Report
What is the size of the Africa telecom infrastructure asset monetization market?
The market size is USD 5.18 billion in 2026 and is forecast to reach USD 7.21 billion by 2031, at a 6.84% CAGR.
Which asset class has the largest role in Africa telecom infrastructure monetization?
Macro towers led the asset class segment with 46.22% revenue share in 2025 because they support broad coverage and multi-operator colocation.
Which ownership model is expanding fastest across African telecom infrastructure?
Infrastructure funds and private equity platforms are projected to expand at a 7.26% CAGR through 2031.
Why are energy services becoming more important for African tower operators?
Energy can represent up to 60% of off-grid site operating costs, making solar hybridization and power-pass-through services important revenue opportunities.
Which country leads telecom infrastructure asset monetization in Africa?
Nigeria led with 25.28% revenue share in 2025, supported by nearly 42,000 tower sites and a large mobile subscriber base.
What could limit future tower monetization activity in Africa?
Foreign-exchange mismatch, sovereign risk, costly refinancing, permitting delays, and reliance on diesel-powered sites can limit transaction activity and new builds.