Market Trends of Wind Turbine Shaft Industry
This section covers the major market trends shaping the Wind Turbine Shaft Market according to our research experts:
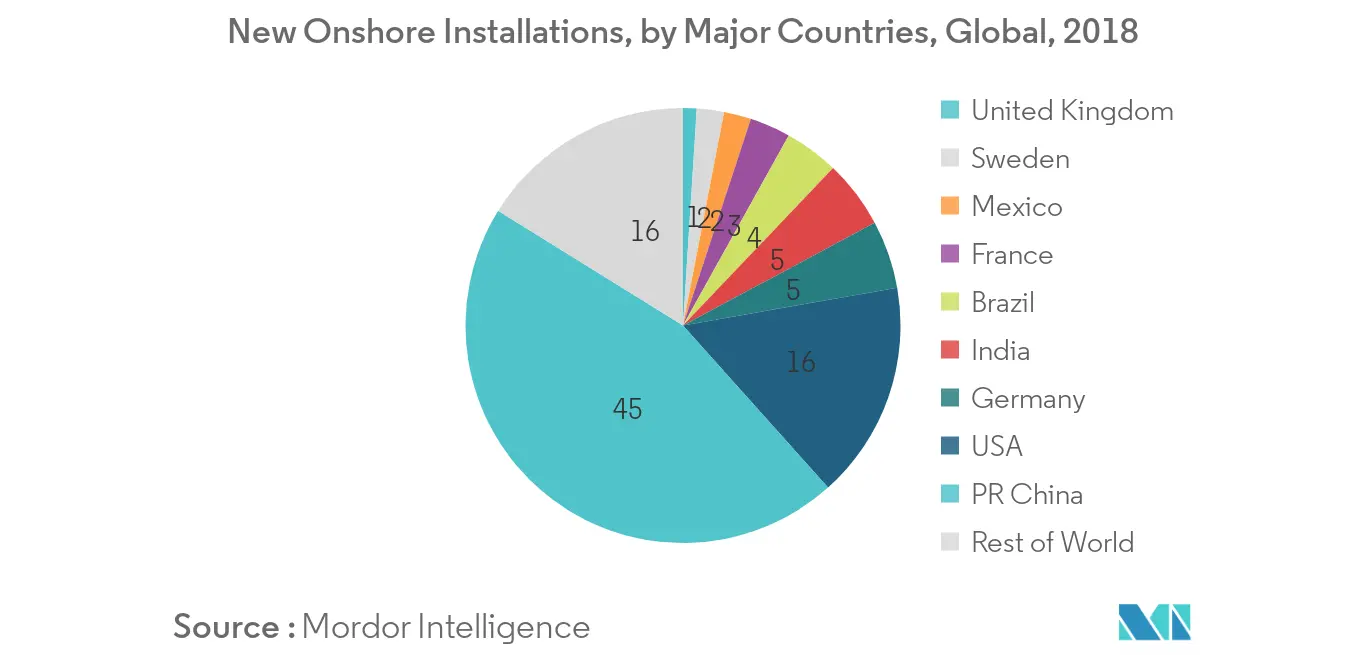
Onshore Wind Turbine Shaft to Dominate the Market
- A wind turbine consists of various components such as blades, controller, brake, gearbox, generator, shafts, and a few others. Shafts in wind turbines are segregated into two types i.e., low-speed shaft and high-speed shaft. A low-speed shaft connects the blades and the gearbox, while the high-speed shaft connects the gearbox and the generator. Both the shaft gets used in onshore and offshore wind turbines.
- During 2018, the cumulative onshore installed wind power capacity reached 568 gigawatts (GW), with the addition of 46.8 GW in 2018. Though the segment had a decrease in installed capacity during the year, but it remains to be the dominating segment across the globe.
- China and the United States remained the largest onshore markets with the highest capacity additions during 2018. China's onshore wind capacity expansion bounced back from 18 GW in 2017 to 21 GW in 2018, after the government's recent change in policy to lift development bans in certain regions, in response to relaxing curtailment levels since 2016. However, in the United States, the onshore additions rebounded slightly from 7 GW in 2017 to 7.5 GW in 2018. The slow growth occurs due to the uncertainties surrounding corporate tax changes.
- The global weighted-average lower cost of electricity (LCOE) of onshore wind projects commissioned in 2018 is at USD 0.056/kWh, and it was 35% lower than in 2010 when it was USD 0.085/kWh. Costs of electricity from onshore wind is reducing every year, and is being driven by continued reductions in total installed costs, as well as by improvements in the average capacity factor. Therefore, the aforementioned factors are expected to drive the wind turbine shaft market in the coming years.
Understand The Key Trends Shaping This Market
Download Sample
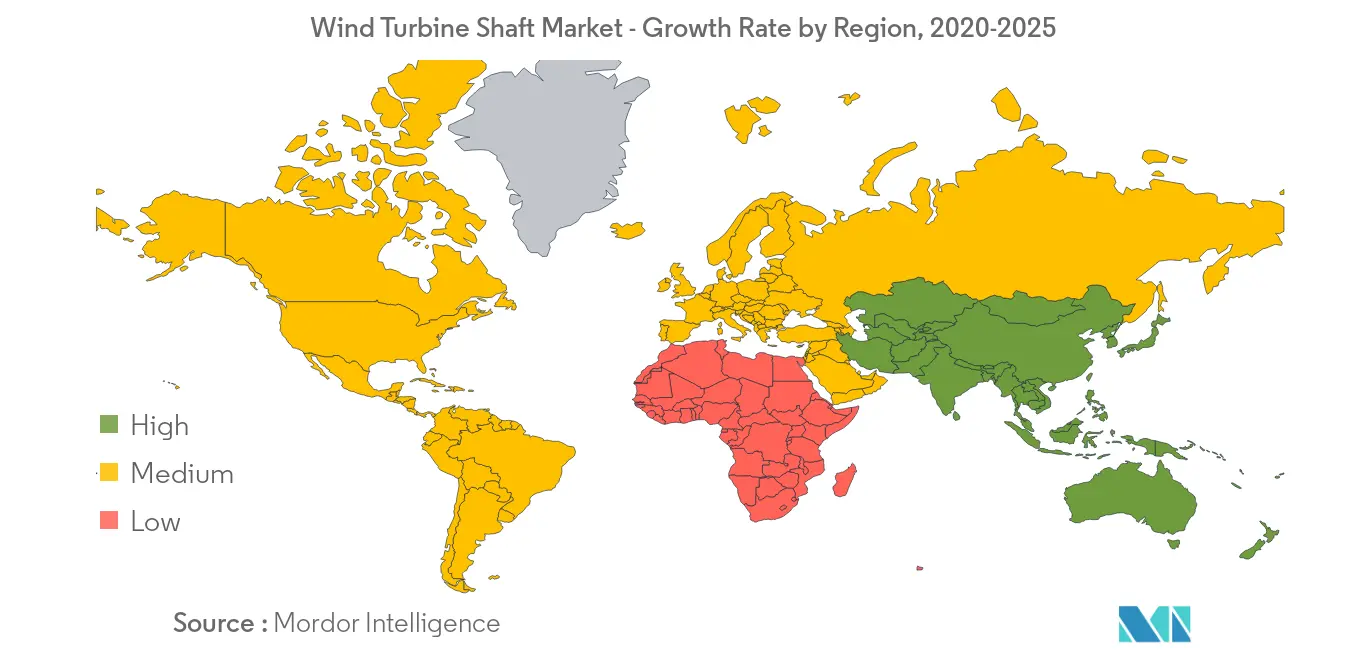
Asia-Pacific to Dominate the Market
- The Asia-Pacific is dominating the wind turbine market with the highest total installed capacity during 2018. The region shares nearly 44% of the total installed capacity of the world.
- China shares the maximum installed capacity in the region, with nearly 23 GW wind energy addition in 2018, and has been the leading country in the region since 2009, with the significant presence of both onshore and offshore wind energy market.
- China onshore market installed 21.2 GW in 2018. The 206 GW total installations at the end of 2018 became the first market to surpass 200 GW of total installed capacity, reaching its target of 200 GW two years earlier (based on the Five Year-Plan 2016-2020).
- As of end of 2018, China held the largest wind power generation capacity in the world. Wind energy accounted for 366 TWh of electricity in 2018 increasing by 24.1% compared to that in 2017. The trend is likely to remain the same, owing to the increasing number of wind power projects in the country.
- During the forecast period, the region is expected to have significant growth in the wind turbine shaft market. Though the region is dominated by coal-powered plants, China is expected to reduce the uses of coal-powered plants by nearly 40% in the coming years to meet the climate goal as stipulated in the Paris Agreement. The reduction in coal power plants is expected to help in the expansion of wind energy and, thereby, the wind turbine shaft market.
Get Analysis on Important Geographic Markets
Download Sample
