Market Trends of United States LNG Infrastructure Industry
Liquefaction Plants Segment to Dominate the Market
- The United States accounted for over half of all new global liquefaction capacity added in 2021, is now the world's third-largest LNG seller, and is expected to become the biggest global LNG exporter in the latter part of the forecast period, overtaking Australia and Qatar.
- By the end of 2022, global liquefaction capacity reached 478.4 MTPA. New liquefaction capacity in the United States market accounted for 75% of the capacity increase in 2022. Sabine Pass LNG T6 (5.0 MTPA) and Calcasieu Pass LNG T1-T18 (10 MTPA) in the United States became operational in February and May 2022 respectively, giving the United States the largest operational liquefaction capacity worldwide in 2022 with total of 88.1 MTPA.
- The United States is one of the world's largest producers of natural gas. Natural gas supplies about one-third of the country's primary energy consumption, with its primary uses being heating and generating electricity. While the majority of natural gas is delivered in its gaseous form through the pipeline in the United States.
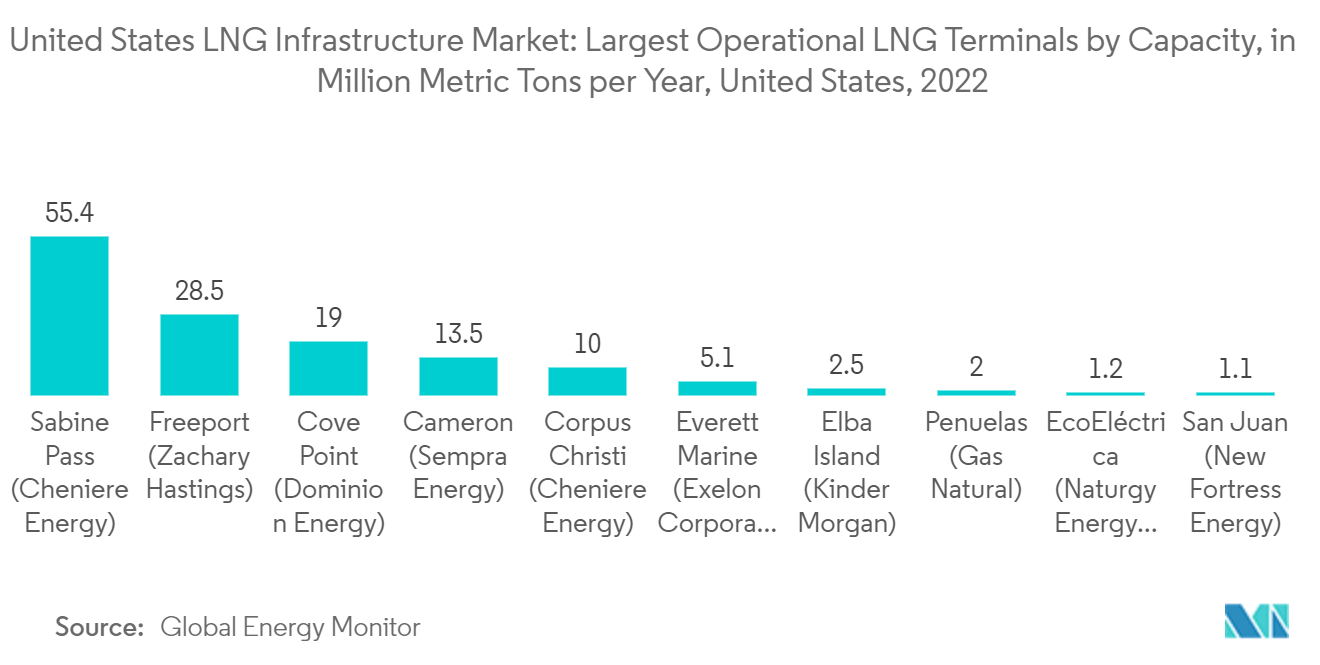
- The Sabine Pass terminal was the largest operational liquefied natural gas terminal in the United States as of 2022, with a capacity of 55.4 million metric tons per year. It is located in Louisiana and is the largest operational LNG terminal worldwide by capacity.
- Following Sabine Pass, the Freeport LNG terminal ranked second in the United States and seventh globally. This terminal is located in Texas and has a capacity of 28.5 million metric tons per annum. By 2026, Freeport will expand by 5.1 million metric tons, thus increasing its capacity by 5 million metric tons.
- In July 2022, The Fluor Corporation was awarded a full notice-to-proceed (FNTP) contract for the engineering, procurement, and fabrication management of the NFE Fast LNG 2 project by New Fortress Energy Inc. This project is a 1.4 million ton per annum LNG treatment and liquefaction plant that will be installed on fixed offshore platforms. It was planned to build the new LNG terminal in US federal waters, approximately 16 miles (26 kilometers) off the southeast coast of Grand Isle, Louisiana, using existing infrastructure.
- Therefore, with major exporting facilities and increasing liquefaction capacity plans in the country, the liquefaction plants segment is expected to be the largest market during the forecast period.
Understand The Key Trends Shaping This Market
Download Sample
Increasing LNG Exports to Drive the Market
- Although most of the natural gas consumed in the United States is produced in the country, some natural gas is imported to help meet domestic demand. In addition to exporting natural gas, the United States imports and exports natural gas by pipeline as gas and by ship as liquefied natural gas (LNG). Trucks also transport LNG and compressed natural gas (CNG) in small quantities.
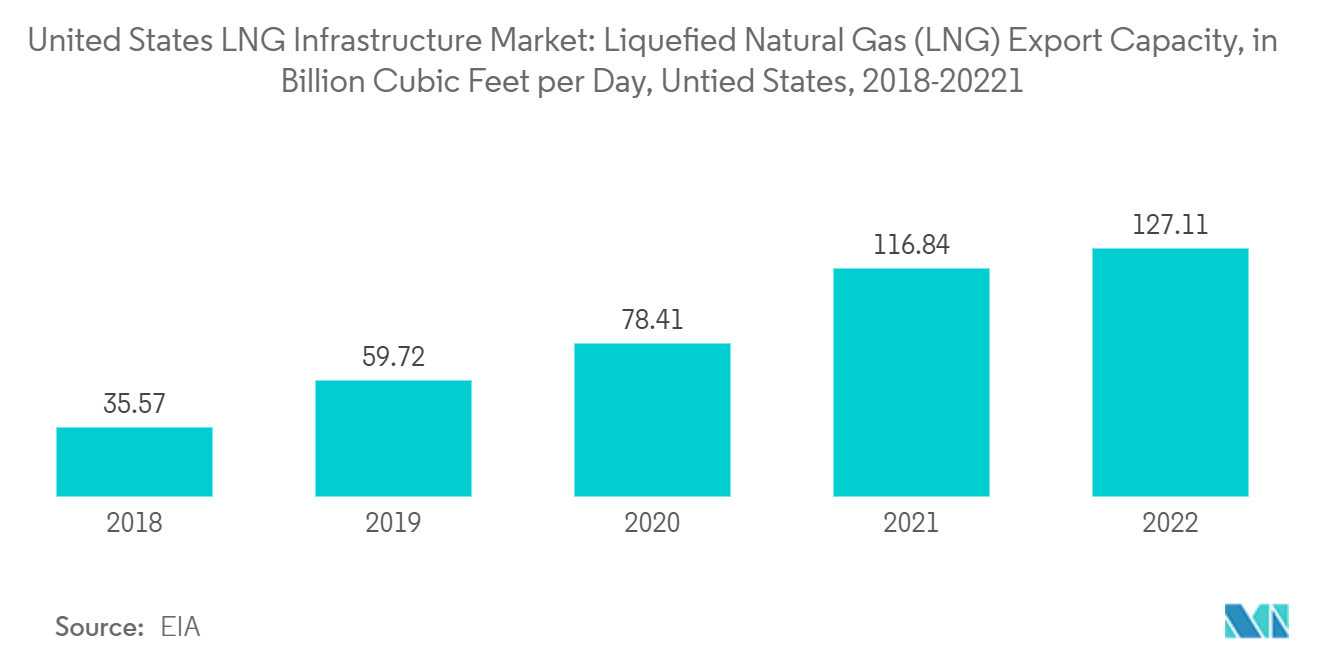
- According to the U.S. Energy Information Administration, the United States remained one of the largest exporter of LNG in 2022, exporting 127.11 billion cubic feet per day. According to IGU, the export capacity of liquefied natural gas was continuously increasing during the period under consideration. As the second-largest LNG exporter in the world, the U.S. ranks behind Australia.
- According to Internationa Gas Union (IGU), global LNG trade increased by 6.8% between 2021 and 2022 to about 401.5 million tonnes (MT). The pipeline gas supply shock following the onset of the Russia-Ukraine conflict led to a surge in LNG demand in Europe, where high prices pulled marginal cargoes away from Asia. The growth in exports from 2021 to 2022 was mainly driven by the United States (+10.5 MT, +15%), following the start-up of the Sabine Pass Train 6 and Calcasieu Pass projects.
- Therefore, supported by abundant supplies of shale gas and growing liquefaction capacity, the country's LNG export witnessed a significant rise, which started with the first commercial LNG cargo shipped from Cheniere's Sabine Pass in Louisiana in 2016 and is expected to increase during the forecast period.