Smart Port Market Size and Share
Market Overview
| Study Period | 2020 - 2031 |
|---|---|
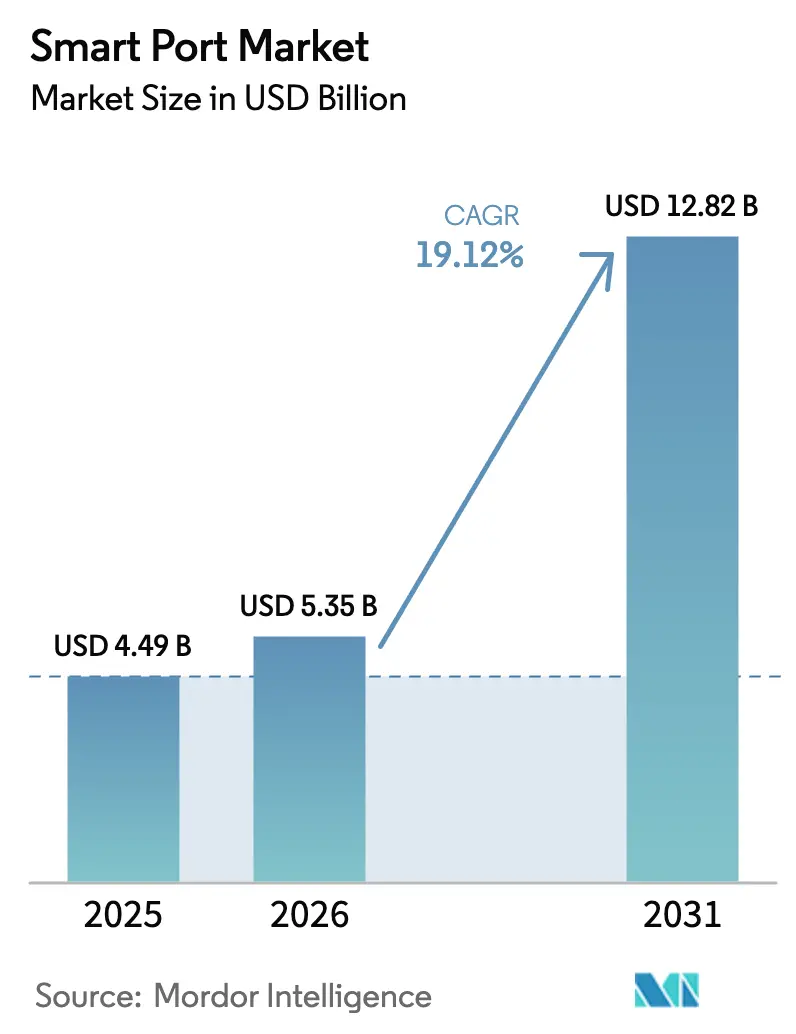
| Market Size (2026) | USD 5.35 Billion |
| Market Size (2031) | USD 12.82 Billion |
| Growth Rate (2026 - 2031) | 19.12% CAGR |
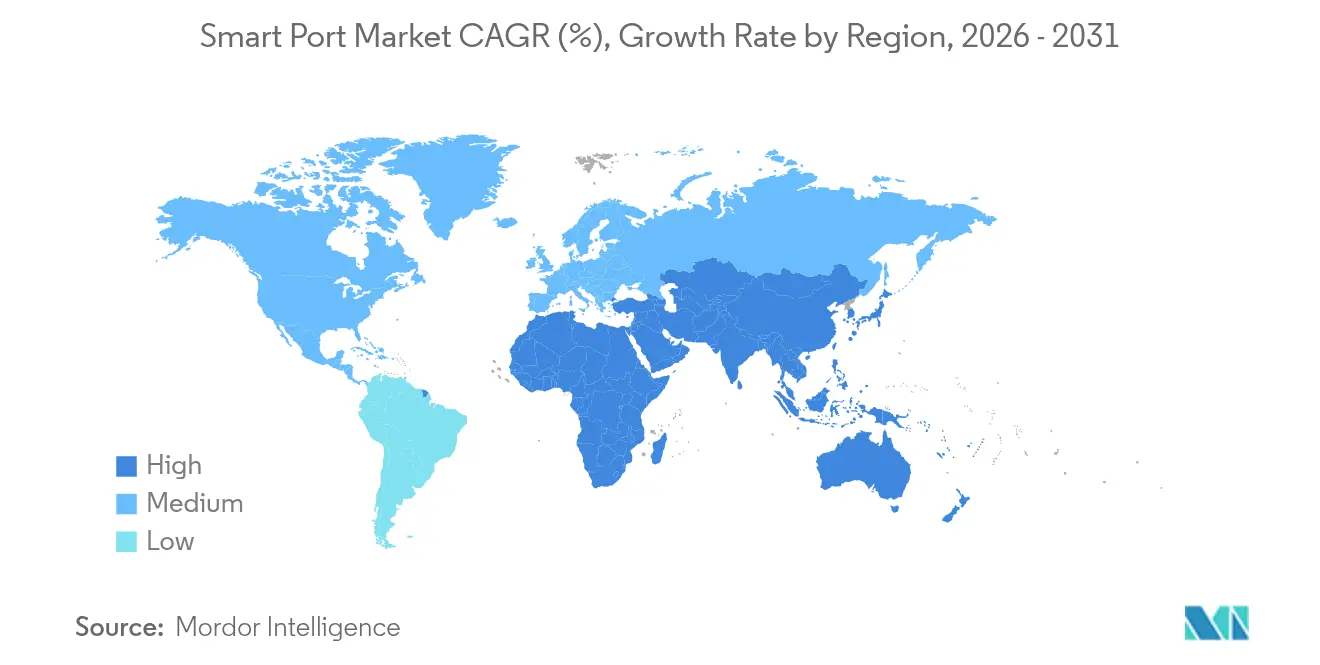
| Fastest Growing Market | Middle East and Africa |
| Largest Market | Asia Pacific |
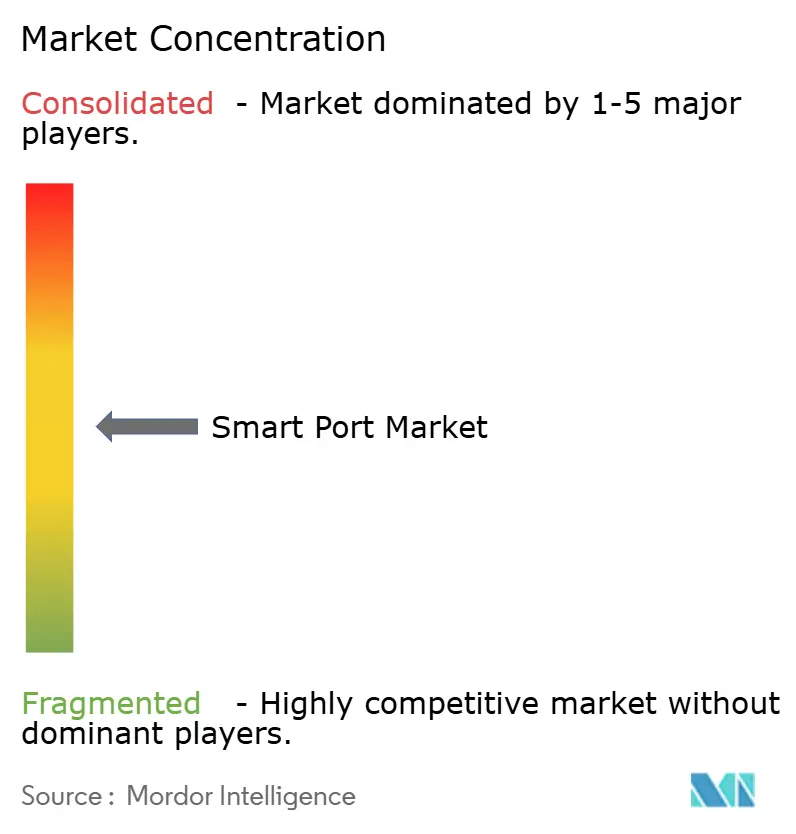
| Market Concentration | Medium |
Major Players *Disclaimer: Major Players sorted in no particular order Image © Mordor Intelligence. Reuse requires attribution under CC BY 4.0. | |
Smart Port Market Analysis by Mordor Intelligence
The smart port market size is expected to grow from USD 4.49 billion in 2025 to USD 5.35 billion in 2026 and is forecast to reach USD 12.82 billion by 2031 at 19.12% CAGR over 2026-2031. The expansion rests on ports’ urgent need to move cargo faster, cut emissions, and control costs through digitalization. Early adopters gain throughput and cost advantages by pairing IoT sensors, AI analytics, and automation with existing terminal hardware. Heightened regulatory pressure to decarbonize vessel calls is accelerating shore-power rollouts, while the surge in maritime cyber-risk directs new spending toward secure-by-design platforms. Growing collaboration between equipment manufacturers and software firms is shrinking innovation cycles and enabling ports of all sizes to experiment with modular smart-technology pilots.
Key Report Takeaways
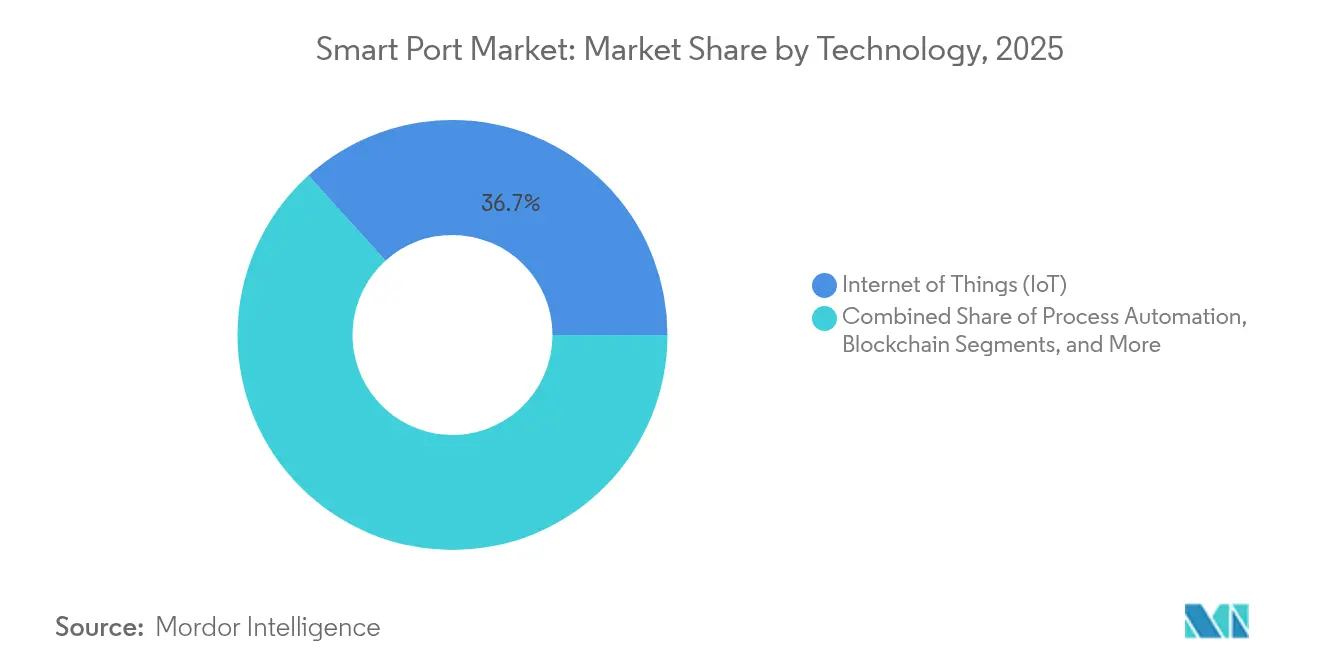
- By technology, IoT held 36.70% of the smart port market share in 2025, whereas digital-twin platforms are projected to advance at 26.1% CAGR to 2031.
- By application, smart terminal automation accounted for 43.65% share of the smart port market size in 2025; smart energy and environment solutions are forecast to grow at 23.05% CAGR through 2031.
- By capacity, high-throughput ports (>10 M TEU) led with 54.55% revenue share in 2025, while low-throughput ports (<1 M TEU) are set to expand at 23.4% CAGR over 2026-2031.
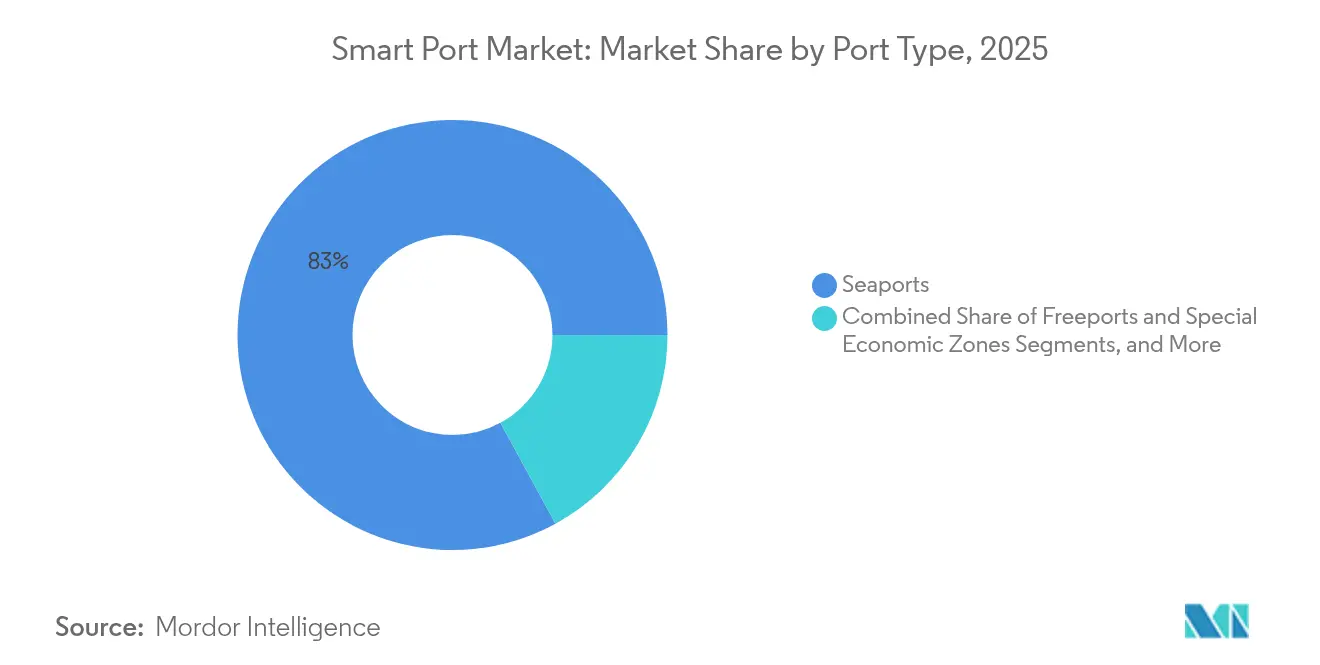
- By port type, seaports dominated with 82.95% revenue share in 2025; inland ports are expected to post a 22.4% CAGR to 2031.
- By region, Asia-Pacific commanded a 34.20% share in 2025; Africa represents the fastest-growing smart port market at 21.4% CAGR to 2031.
Note: Market size and forecast figures in this report are generated using Mordor Intelligence’s proprietary estimation framework, updated with the latest available data and insights as of 2026.
Global Smart Port Market Trends and Insights
Drivers Impact Analysis*
| Driver | (~) % Impact on CAGR Forecast | Geographic Relevance | Impact Timeline |
|---|---|---|---|
| Rising maritime trade volume and congestion | +5.4% | Global, with acute impact in Asia-Pacific | Medium term (2-4 years) |
| Regulatory decarbonisation push (IMO 2030/2050) | +4.2% | Global, with early adoption in Europe | Long term (≥ 4 years) |
| Rapid IoT-, AI- and 5G-led port automation | +3.8% | Asia-Pacific, North America, Europe | Medium term (2-4 years) |
| Surge in cyber-insurance premiums steering ports to "secure-by-design" platforms | +3.2% | North America, Europe | Short term (≤ 2 years) |
| Digital-twin-enabled CAPEX optimisation | +2.5% | Global, with early adoption in high-throughput ports | Medium term (2-4 years) |
| EU "Fit-for-55" subsidies for on-shore power supply | +1.8% | Europe, with spillover effects in Asia-Pacific | Short term (≤ 2 years) |
| Source: Mordor Intelligence | |||
Rising Maritime Trade Volume and Congestion
Escalating global trade has pushed many terminals beyond design limits, creating congestion that jeopardizes schedule reliability. Ports now turn to digital twins, dynamic berth-planning tools, and truck-appointment systems to gain “virtual capacity” without enlarging berths. The Port of Rotterdam increased container-handling efficiency by 30% after embedding smart logistics platforms.[1]International Association of Ports and Harbors, “Study on Digitization and Disruptive Technologies in Port Operation,” iaphworldports.org In Asia-Pacific, where demand growth outstrips infrastructure, even conservative operators are fast-tracking sensor networks and yard-automation pilots to avoid bottlenecks. Rising dwell-time fees further motivate carriers and terminal operators to share real-time data that trims idle time. The smart port market, therefore, sees throughput optimization software overtaking gantry-crane purchases in technology budgets.
Regulatory Decarbonization Push
IMO targets to cut greenhouse-gas emissions by half by 2050, along with regional mandates such as the EU’s Fit-for-55, compel ports to invest in onshore power, energy-management dashboards, and emissions-monitoring systems. The Port of Los Angeles secured USD 411 million under the U.S. EPA Clean Ports Program to deploy 250 zero-emission trucks and charging infrastructure. Environmental-performance metrics have become a key criterion in shipping line tenders, positioning eco-efficient terminals to capture new services. European ports lead early adoption, yet Asia-Pacific hubs follow closely, thanks to government green-port grants. These policies lift demand for renewable integration software, electric yard equipment, and energy-optimizing digital twins, underpinning long-term smart port market growth.
Rapid IoT-, AI- and 5G-Led Port Automation
Low-cost sensors, edge AI, and private 5G now let quay cranes, AGVs, and gates coordinate autonomously. The Port of Qingdao’s fully automated terminal recorded a 30% gain in productivity and a 70% cut in labor expense. Standardized container-handling processes suit robotics, while 5G reduces motion latency, enabling remote crane operation. As integration middleware matures, pilots are scaling to yard-wide deployments, shifting spending toward software licenses and machine-learning services. Successful reference projects spur neighboring ports to replicate similar capabilities, expanding the smart port market across regional clusters.
Surge in Cyber-Insurance Premiums Steering Secure-by-Design Platforms
A sharp rise in ransomware incidents, highlighted by the U.S. Coast Guard’s 80% year-on-year spike in 2023, drives ports to embed cybersecurity from the ground up. Insurers now require robust network segmentation, continuous threat monitoring, and ISO-certified processes before underwriting operational-technology risks. Terminal operators, therefore, prioritize next-generation firewalls, zero-trust architectures, and AI-based anomaly detection when selecting new digital tools. Vendors offering maritime-specific security stacks enjoy accelerated contract cycles, and ports with proven cyber-resilience win shipper confidence, feeding positive reinforcement into the smart port market.
Restraints Impact Analysis*
| Restraint | (~) % Impact on CAGR Forecast | Geographic Relevance | Impact Timeline |
|---|---|---|---|
| High upfront CAPEX and long payback | -2.8% | Global, with a higher impact in developing regions | Medium term (2-4 years) |
| Legacy system interoperability gaps | -2.1% | Global, with higher impact in established ports | Short term (≤ 2 years) |
| Lengthy ICT procurement and cybersecurity clearances | -1.5% | North America, Europe | Short term (≤ 2 years) |
| Scarcity of the OT cybersecurity talent pool | -0.9% | Global | Medium term (2-4 years) |
| Source: Mordor Intelligence | |||
High Upfront CAPEX and Long Payback
Comprehensive smart-port rollouts often exceed USD 200 million, stretching payback periods to 8-10 years despite operating-cost reductions of up to 45%. Smaller ports struggle to secure financing, prompting phased investments that target quick-return modules such as gate-automation or energy-monitoring. Public-private partnerships and green-bond issuances are emerging to bridge funding gaps, yet project delays remain common when macroeconomic conditions tighten. The capital hurdle risks widening a technology divide between tier-1 hubs and regional feeders, potentially limiting the adoption pace of the smart port market.
Legacy System Interoperability Gaps
Decades of siloed procurement have left many ports with fragmented terminal-operating systems, proprietary crane controls, and stand-alone customs platforms. Integration projects often run 40% over schedule and 35% over budget, as discovered in a cross-port digitalization study. Upgrading or replacing legacy code forces downtime that busy terminals can ill afford. Middleware standards such as IPCSA’s Network of Trusted Networks are easing data exchange, yet the lack of common APIs remains a drag on the smart port market’s near-term momentum.
*Our forecasts treat driver/restraint impacts as directional, not additive. The impact forecasts reflect baseline growth, mix effects, and variable interactions.
Segment Analysis
By Technology: Digital Twins Redefine Port Planning
Digital-twin platforms, projected to deliver a 26.1% CAGR from 2026 to 2031, are reshaping infrastructure planning by letting operators simulate yard layouts, energy loads, and traffic flows before committing funds. The Port of Hamburg cut vessel waiting time by 20% and emissions by 15% after rolling out a harbour-scale twin. This capability makes data-driven expansion the new norm, encouraging financiers to back projects demonstrating robust what-if analysis. As a result, the smart port market sees digital-twin vendors partnering with cloud hyperscalers to handle the computing loads of large-scale simulations.
IoT remains the foundational layer, anchoring 36.70% of 2025 revenue as low-power sensors transmit asset status, weather, and berth conditions. Combined with edge computing, IoT conquers latency constraints that once hampered real-time decisions. Blockchain adoption, still niche, is gaining traction for document exchange and cargo visibility at gateways such as Antwerp, while cybersecurity solutions enjoy fast uptake amid rising threat awareness. Together, these tools knit a data fabric that sustains wider automation use cases, keeping the smart port market on a steady growth trajectory.


By Capacity: Small Ports Embrace Digital Transformation
Low-throughput facilities handling under 1 M TEU a year are projected to grow at a 23.4% CAGR, the fastest pace among capacity tiers, as cloud-hosted SaaS platforms eliminate heavy on-premises spending and level the playing field. Portsmouth International Port’s shore-power roll-out illustrates how focused projects cut local emissions and attract green-shipping services. High-throughput hubs still lead spending, holding 54.55% of 2025 revenue, and finance full-scale automation; Shanghai Yangshan’s driverless AGVs and automated stacking cranes have trimmed manual tasks by 70%. Medium-throughput ports choose modular upgrades such as truck-gate digitalization or crane OCR add-ons, letting solution providers tailor packages to each throughput bracket and keeping the overall smart port market diversified.
By Port Type: Inland Ports Emerge as Innovation Hubs
Inland and dry ports are forecast to expand at a 22.4% CAGR, propelled by the need to decongest seaports and support just-in-time manufacturing. Smart rail-shuttle coordination platforms trim total land-side transit cost by as much as 25%, according to recent network studies. Governments encourage inland-hub investments to spread economic activity beyond coastal regions, thereby widening digital-infrastructure coverage. Such momentum brings fresh entrants—rail operators, FTZ managers, and logistics parks—into the smart port market ecosystem.
Seaports, while controlling 82.95% of 2025 revenue, increasingly prioritize end-to-end data integration that links tug scheduling, bunker supply, and customs clearance. Singapore’s TUAS megahub exemplifies the all-digital approach, blending vessel traffic, yard management, and automated conveyor systems under one command center. Special-economic-zone ports deploy unified trade portals that fuse customs, banking, and logistics data to accelerate cargo throughput and attract value-added tenants. These developments reinforce the smart port market as a pillar of modern trade facilitation.
By Application: Environmental Solutions Lead Growth
Smart energy and environment solutions, notably shore power, microgrid control, and emissions dashboards, are projected to grow 23.05% annually through 2031 as regulators tighten carbon ceilings. Busan’s shore-power deployment cuts berth-side CO₂ by 98% and improves urban air quality, helping win community support for port expansion. Funding mechanisms—from EU Fit-for-55 grants to green bonds—lower the barrier for similar projects globally, enlarging the smart port market size dedicated to environmental compliance.
Smart terminal automation owns 43.65% of 2025 revenue, driven by autonomous vehicles, automated stacking cranes, and AI yard optimization. Productivity gains of 30% and cost savings of 25% attract investors even amid CAPEX concerns. Safety and security platforms gain momentum after cyber incidents, blending video analytics, access control, and network monitoring. Predictive maintenance secures quick payback by slashing unplanned equipment downtime by 35% in Hamburg. Increasingly, operators demand unified suites that converge these functions on a single data backbone, reinforcing platform consolidation within the smart port market.
Geography Analysis
Asia-Pacific retained 34.20% of global smart port revenue in 2025, powered by China’s automation push and Singapore’s TUAS program that nurtures start-ups through the Smart Port Challenge. Chinese shipyards’ dominance in newbuilds positions them as natural testbeds for autonomous tug pilots and digital-pilotage tools, while South Korea’s private 5G in Busan and Incheon enables sub-millisecond crane control.
Middle East and Africa, though smaller in absolute terms, is the fastest-growing region at 21.4% CAGR. Nigeria’s plan to digitalize every port process by 2025 relies on cloud-native SaaS to bypass legacy lock-in. Morocco’s Tangier Med applies AI traffic forecasting to orchestrate truck arrivals. Gabon and Djibouti fold smart-port frameworks into national digital-economy blueprints, accelerating leapfrog development.
Europe sustains adoption through strict green policy and funding. The EU mandate for shore power on container and passenger berths by 2030 channels billions into grid upgrades. Hamburg plans shore-power coverage at all major berths as part of its 2040 climate-neutral target. North America follows with the USD 2.8 billion EPA Clean Ports Program that funds zero-emission equipment for Los Angeles, Seattle, and Hueneme. Canadian ports use AI to trim truck turnaround, while Mexico pilots blockchain bills of lading—moves that jointly reinforce global demand and widen the smart port market.

Competitive Landscape
The smart port arena remains moderately concentrated: ABB pairs electrical systems with digital twins, Siemens applies machine learning to refine departure-time accuracy, and IBM offers hybrid-cloud integration.[4]INFORMS, “Smart Ports: How Analytics Is Reshaping the Global Shipping Industry,” informs.org Ecosystem alliances now outweigh head-to-head rivalry as customers prefer end-to-end accountability.
White-space opportunity lies in middleware that reconciles legacy OT protocols with modern APIs, while maritime-specific cyber-analytics start-ups gain funding momentum after the U.S. Coast Guard reported an 80% jump in ransomware incidents targeting marine entities in 2023. AI vendors promising berth-on-time KPIs appeal to carriers chasing tighter port-call windows. Over time, orchestrators controlling key data gateways may capture outsized value, nudging niche point-solution players toward partnerships or consolidation. Price rivalry lingers in mature hardware lines such as crane automation, but premium pricing prevails in analytics and predictive modules. Procurement teams now insist on sandbox testing to validate integration claims, raising entry barriers yet driving continuous performance gains across the smart port market.
Smart Port Industry Leaders
ABB Ltd.
Siemens AG
Cargotec Corporation (Kalmar)
Shanghai Zhenhua Heavy Industries (ZPMC)
Konecranes Plc
- *Disclaimer: Major Players sorted in no particular order

Recent Industry Developments
- May 2025: Tangier Med port and Libreville agreed to deploy advanced VTS and AIS across Gabon’s harbors under the “Smart Port 2030” banner.
- April 2025: The European Space Agency opened a Maritime Decarbonization call seeking digital and renewable solutions for ports, with proposals due 15 Feb 2025.
- March 2025: The Port of Montreal’s 9th Smart Port Challenge awarded two student teams USD 2,500 scholarships for optimizing truck gates at Bickerdike Terminal.
- January 2025: The Port of Seattle reported progress on shore-power installation for cruise berths and secured USD 3 million in EPA funding for maritime decarbonization.


Research Methodology Framework and Report Scope
Market Definitions and Key Coverage
Our study defines the smart port market as all hardware, software, and integrated platforms that let a commercial seaport or inland port sense, analyze, decide, and remotely execute operational tasks. This universe covers IoT sensor networks, digital-twin dashboards, port-community systems, yard and quay automation modules, smart-energy assets, and the associated analytics and cybersecurity layers that are commissioned inside the port fence.
Scope Exclusions: Conventional quay wall construction, dredging, and manual handling equipment upgrades without data connectivity are excluded.
Segmentation Overview
- By Technology
- Process Automation
- Blockchain
- Internet of Things (IoT)
- Artificial Intelligence (AI)
- Digital Twin Platforms
- Big-Data and Predictive Analytics
- Cyber-security Solutions
- Edge/5G Connectivity
- By Capacity
- High-throughput Ports (>10 M TEU)
- Medium-throughput Ports (1–10 M TEU)
- Low-throughput Ports (<1 M TEU)
- By Port Type
- Seaports
- Inland / Dry Ports
- Freeports and Special Economic Zones
- By Application
- Smart Terminal Automation
- Smart Safety and Security
- Smart Energy and Environment (OPS, micro-grids)
- Smart Traffic and Trade Flow Management
- Predictive Asset Maintenance
- By Geography
- North America
- United States
- Canada
- Mexico
- South America
- Brazil
- Argentina
- Rest of South America
- Europe
- Germany
- United Kingdom
- France
- Italy
- Spain
- Russia
- Rest of Europe
- Asia-Pacific
- China
- Japan
- India
- South Korea
- South-East Asia
- Rest of Asia-Pacific
- Middle East and Africa
- Middle East
- Saudi Arabia
- United Arab Emirates
- Turkey
- Rest of Middle East
- Africa
- South Africa
- Nigeria
- Rest of Africa
- Middle East
- North America
Detailed Research Methodology and Data Validation
Primary Research
Mordor analysts spoke with port CIOs, terminal engineering heads, automation integrators, and energy management vendors across Asia-Pacific, Europe, and the Gulf to cross-check adoption timelines, average selling prices, and retrofit feasibility.
Desk Research
We began with tier-one statistics such as UNCTAD maritime trade tables, the International Maritime Organization emissions inventory, Eurostat port throughput, and U.S. Department of Transportation port investment trackers. Trade association white papers, sustainability reports from major port authorities, and container line 10-Ks revealed digital capex signals. Subscription inputs from D&B Hoovers and Questel enriched company revenue splits and patent flows. The sources listed here are illustrative; many additional publications were reviewed for data collection, validation, and clarification.
Market-Sizing & Forecasting
A top-down model converts historical container and Ro-Ro throughput into a digital capex pool by applying port-level penetration rates that we refined through interviews. Results are cross-tested with a bottom-up slice of supplier revenues and average project values, then adjusted for multi-terminal complexes. Key drivers, global TEU growth, energy cost trajectories, sensor price erosion, mandated emission targets, and national port modernization budgets, feed a multivariate regression that projects demand through 2030. Where supplier roll-ups were incomplete, variance is backfilled using regional benchmark ratios drawn from comparable port classes.
Data Validation & Update Cycle
Every draft model passes a two-stage peer review, variance checks against external benchmarks, and anomaly flags generated by our internal dashboard. The dataset is refreshed annually, with interim recalculations triggered by material policy shifts or mega project awards before client delivery.
Why Mordor's Smart Port Baseline Inspires Confidence
We observe that published figures often diverge because firms select dissimilar scopes, convert currencies differently, or freeze their models for longer intervals. Key gap drivers include the inclusion of legacy port infrastructure by some providers, optimistic IoT adoption curves, or single region sampling that ignores slower converting corridors.
Benchmark comparison
| Market Size | Anonymized source | Primary gap driver |
|---|---|---|
| USD 4.49 B (2025) | Mordor Intelligence | N/A |
| USD 2.53 B (2025) | Global Consultancy A | Excludes energy optimization modules and inland ports; uses uniform ASPs |
| USD 2.00 B (2022) | Trade Journal B | Older baseline year and linear growth without policy variables |
| USD 96.57 B (2025) | Industry Association C | Bundles conventional marine services and equipment into scope |
Taken together, the comparison shows that Mordor Intelligence's disciplined scope selection, dual validation model, and yearly refresh produce a balanced baseline that clients can trace back to transparent variables and reproducible steps.


Key Questions Answered in the Report
What is the projected growth rate of the smart port market through 2031?
The smart port market is forecast to grow at a 19.12% CAGR from USD 5.35 billion in 2026 to USD 12.82 billion by 2031.
Which technology segment is expanding the fastest?
Digital-twin platforms lead growth with a projected 26.1% CAGR because ports use them to simulate operations and optimize capital spending before building.
Why are environmental applications gaining investment priority?
Regulations such as IMO 2030/2050 and the EU Fit-for-55 package push ports to cut berth-side emissions, driving 23.05% CAGR in smart energy and environment solutions like shore power and microgrid controls.
How are small ports funding digital transformations?
Low-throughput ports adopt cloud-hosted SaaS, pursue public-private partnerships, and tap green-infrastructure grants to overcome CAPEX barriers and still deploy gate-automation or shore-power modules.
Which region shows the fastest smart-port growth?
Middle East and Africa is expected to post a 21.4% CAGR from 2026 to 2031 as countries like Nigeria, Morocco, and Gabon embed digital systems to modernize trade corridors.
What cybersecurity measures are ports prioritizing?
Ports focus on zero-trust architectures, maritime-specific threat detection, and continuous network monitoring to satisfy insurers and mitigate the rising ransomware threat documented by the U.S. Coast Guard.
Page last updated on:


