Market Trends of Oil and Gas Water Treatment Chemicals Industry
This section covers the major market trends shaping the Oil & Gas Water Treatment Chemicals Market according to our research experts:
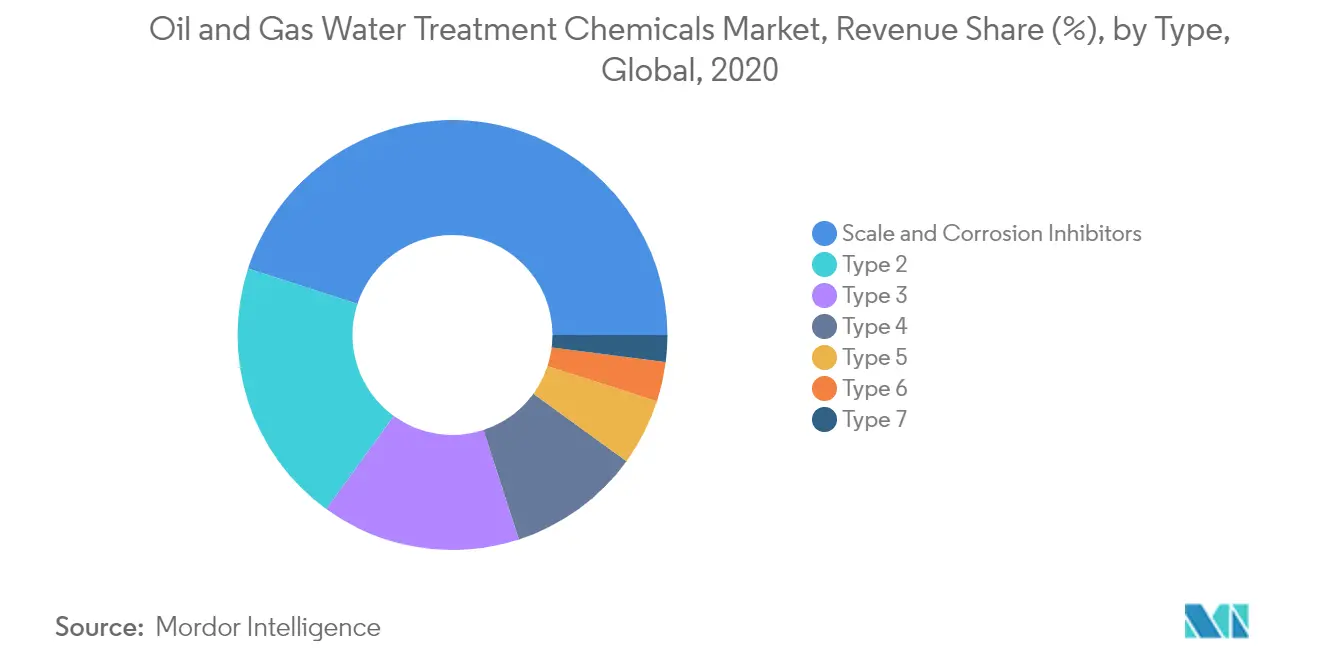
Scale and Corrosion Inhibitors to Dominate the Market
- Corrosion inhibitors, when added in small amounts to the corrosive medium, reduce its corrosiveness in considerable measures. These products are extremely efficient even with a very low dosage and sufficiently inert to avoid altering the physicochemical properties of the oil.
- Additionally, the use of corrosion inhibitors in water systems improves the efficiency of the system, thus facilitating maximum heat transfer, improving process throughput, reducing the downtime for cleaning, which helps the system run for a longer time. They are designed to ensure metal protection and prevent metal loss, which may lead to critical system failures in recirculating water piping, process cooling equipment, and heat exchangers. Corrosion inhibitors are added to the treatment systems to protect the metals by reducing the corrosion potential associated with the cathode and anode of the corrosion cell.
- Hence, in the oil and gas industry, they are used in reinjection wells, gas plants, transportation lines, barges, etc., as their usage reduces costs and extends the working life of capital assets, such as process equipment, pipelines, and storage tanks.
- Scale inhibitors are added during the secondary recovery of oil. These chemicals improve oil and gas flow by preventing scaling without causing any change in the crude oil characteristic.
- The usage of scale inhibitors in the oil and gas industry helps the systems maintain scale-free surfaces in pipe walls, heat exchangers, and valves.
- According to BP Statistical Review of World Energy 2020, the global production volume of natural gas was 3989.3 billion cubic meters in 2019, with a growth rate of 3.4% compared to the previous year, thus leading to an increase in demand for scale and corrosion inhibitors used during the production and distribution of the natural gas, thereby stimulating the demand for the market studied.
- According to EIA, the average crude oil production in the United States accounted for about 11.3 million barrels per day in 2020, down from 12.2 million barrels per day in 2019. The average production is expected to reach 11.1 million barrels per day in 2021 and 12 million barrels per day in 2022. An increase in the production of crude oil and byproduct wastewater is expected to rise in the coming years, which is likely to enhance the market demand for oil and gas water treatment chemicals.
- The oil and gas industry is one of the largest users of scale inhibitors, with the majority of demand coming from Middle East & Africa. According to EIA, the United Arab Emirates (UAE) was among the world's 10 largest oil producers as of 2019. The UAE had produced about 3.1 million barrels per day of crude oil in 2019, and it is planning to produce 5 million barrels per day by 2030. Thus, it is expected that the production volume of wastewater will also increase, which in turn will stimulate the demand for the market studied.
- As long as operations continue in the oil and gas industry, the consumption of scale and corrosion inhibitors will continue to increase through the forecast period.
Understand The Key Trends Shaping This Market
Download Sample
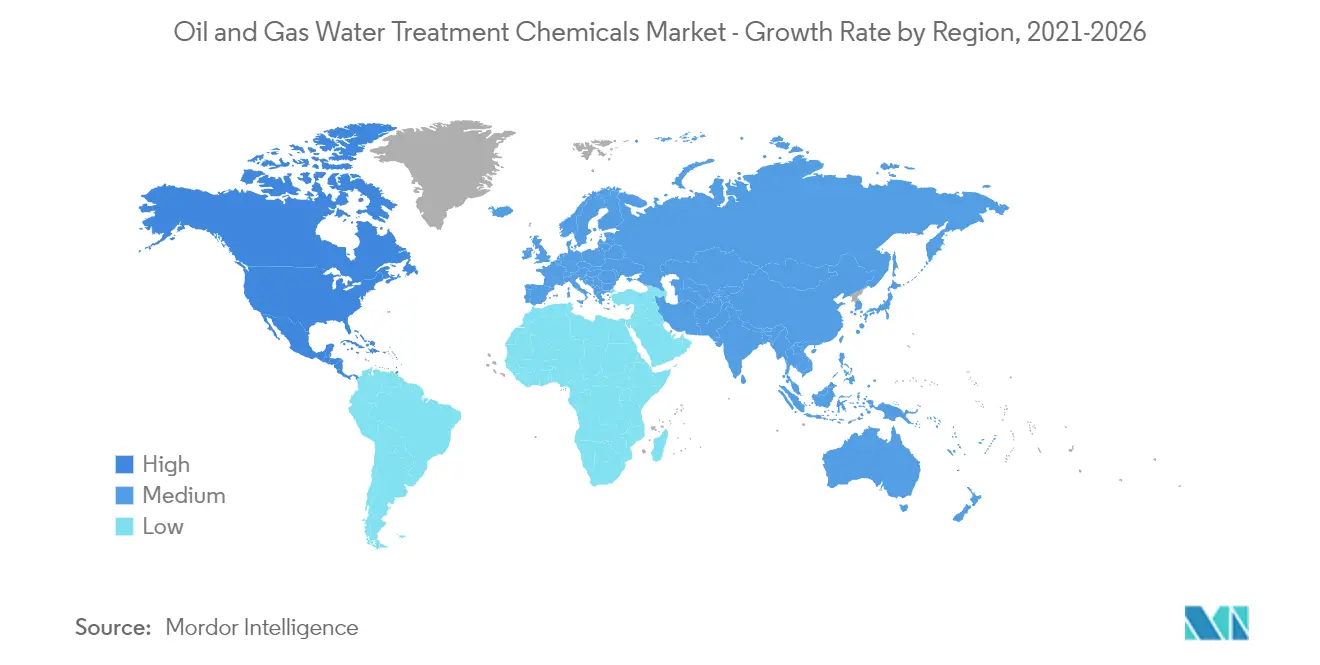
The North American Region to Dominate the Market
- North America dominated the global water treatment chemicals market share. This can be attributed to the presence of a large number of mining, oil and gas, and power generation activities in the United States.
- The United States was the single largest producer and consumer of natural gas, and particularly shale gas, accounting for a large chunk of global capacity.
- According to EIA forecasts, the production of dry natural gas in the United States averaged 87.8 billion cubic feet per day in February 2021, down from 92.4 billion cubic feet per day in December 2020. It is estimated that the overall dry natural gas production will average 91.4 billion cubic feet per day in 2021, which is 0.9 billion cubic feet per day more than the February forecast, thus leading to an increase in the wastewater byproduct production, which in turn stimulates the demand for the oil and gas water treatment chemicals.
- Adopting the new technologies and chemicals, the major producers of shale gas are increasing the production output from their existing fields as well. Some of the newly developed technologies are artificial lift systems and enhanced oil recovery.
- The significant growth in shale gas exploration and production, along with the recovery in the mining outputs, in the country, is expected to support the consumption of industrial water treatment chemicals at a steady rate during the forecast period.
- North America is the second-largest region in terms of oil production after the Middle Eastern region. According to BP Statistical Review of World Energy 2020, the total oil production in the North America region accounted for 24.61 million barrels per day in 2019, with a growth rate of about 7% compared to the previous year, thereby leading to an increase in the production of wastewater.
- Canada has a large reserve of oil sands, and with the steady higher prices of crude oil in the market, the production of crude from oil sands has become viable. This is also expected to drive the market of oil and gas water treatment chemicals in the region.
- Furthermore, there are several wastewater streams coming out of refineries, which typically include desalter water generated from washing raw crude before topping, sour water that comes from steam stripping, and fractionating that comes in contact with crude, process water generating from product washing, regenerating catalyst, and dehydrogenation reactions.
- According to BP Statistical Review of World Energy 2020, in the North American region, the total refinery throughput accounted for about 18.98 million barrels per day in 2019, with a decline rate of about 1.3% compared to the previous year, decreasing the production of wastewater during downstream crude oil processes and negatively impacting the market demand.
- Therefore, the aforementioned factors are expected to significantly impact the market in the coming years.
Get Analysis on Important Geographic Markets
Download Sample
