Market Size of LNG Infrastructure Industry
| Study Period | 2020 - 2029 |
| Base Year For Estimation | 2023 |
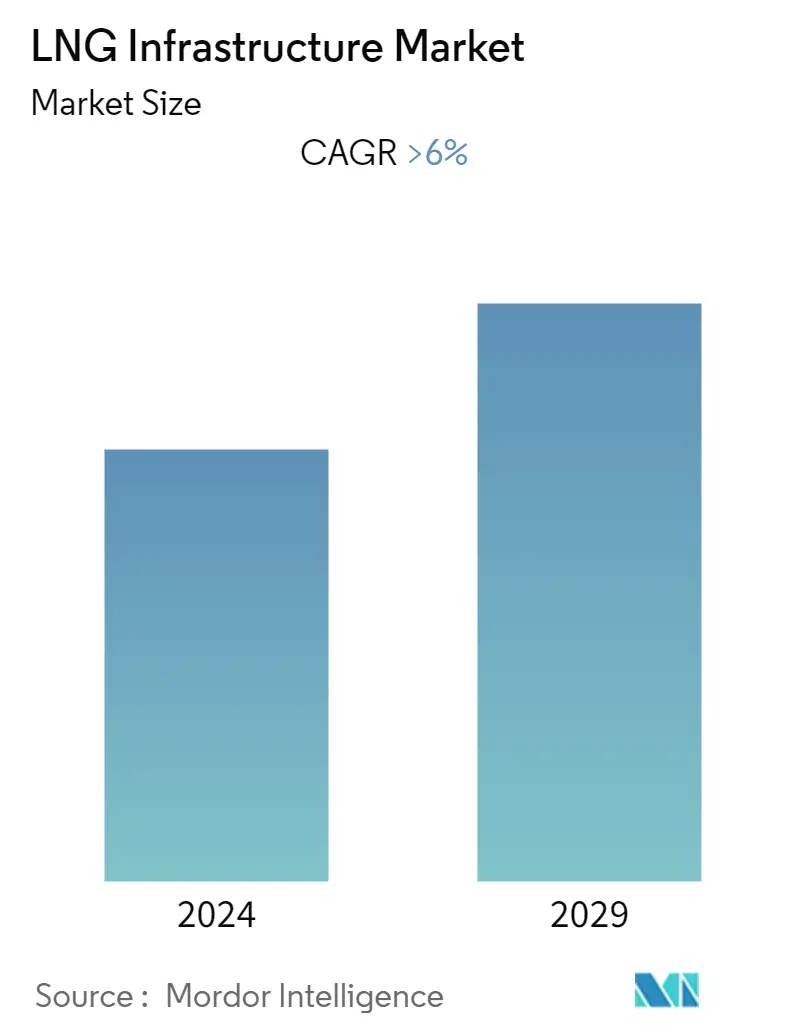
| CAGR | > 6.00 % |
| Fastest Growing Market | Asia Pacific |
| Largest Market | Asia Pacific |
| Market Concentration | Low |
Major Players
*Disclaimer: Major Players sorted in no particular order |
Need a report that reflects how COVID-19 has impacted this market and its growth?
LNG Infrastructure Market Analysis
The LNG infrastructure market is projected to register a CAGR of 6% during the forecast period.
In 2020, COVID-19 had a detrimental effect on the market. Presently, the market has reached pre-pandemic levels.
- Over the medium period, the market drivers for LNG infrastructure include the growing uses of natural gas in various sectors, such as power, to have lower carbon emissions and the investments that nations around the world are making in having a cleaner environment.
- On the other hand, alternative sources of energy, such as nuclear energy production and renewable technology developments in various regions, may act as a restraint for the market's growth during the forecast period.
- Nevertheless, as per the Energy Information Administration (EIA), non-OECD Asian countries like China, India, Bangladesh, Thailand, and Vietnam are expected to consume 120 billion cubic feet per day (bcf/d) of natural gas by 2050, outpacing regional natural gas production by 50 bcf/d. The supply imbalance in the region is likely to result in increasing dependency on other regions, which is expected to create an opportunity for the LNG infrastructure companies to penetrate markets.
- Asia-Pacific is expected to dominate the LNG infrastructure market with the presence of both liquefaction and regasification terminals. Countries such as Australia, Indonesia, and Malaysia have the highest capacity liquefaction terminals, while Japan, South Korea, China, and India have the highest capacity infrastructure for the regasification of LNG.
