Automotive Augmented Reality Market Size and Share
Market Overview
| Study Period | 2020 - 2031 |
|---|---|
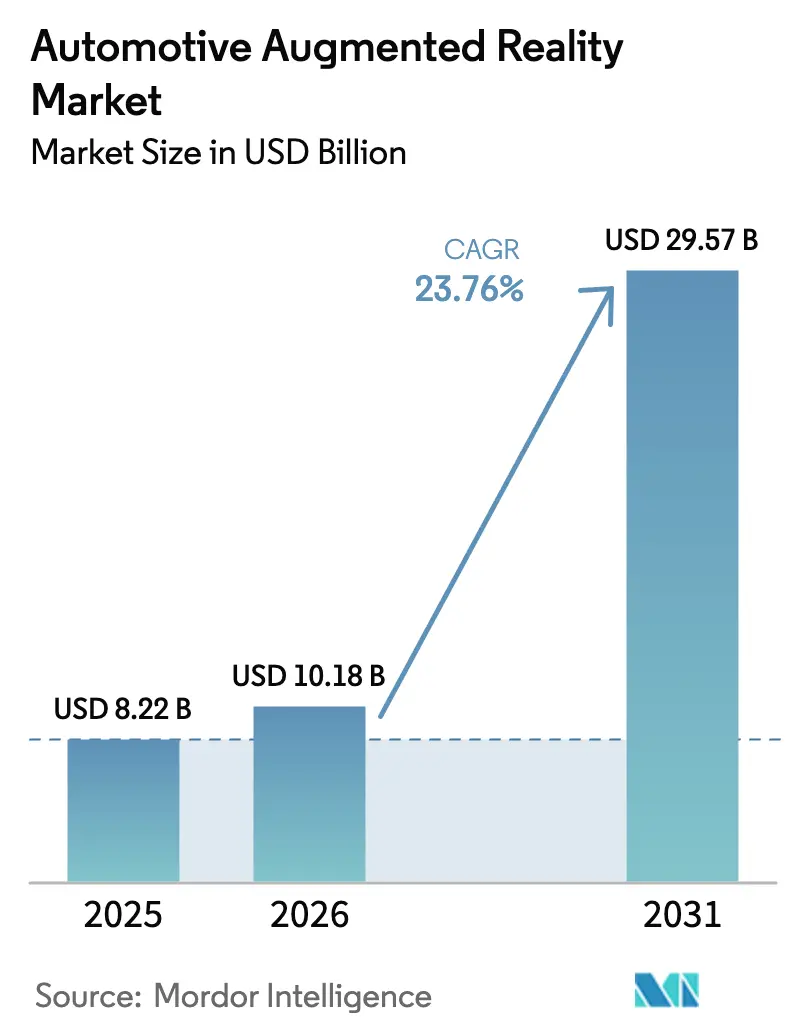
| Market Size (2026) | USD 10.18 Billion |
| Market Size (2031) | USD 29.57 Billion |
| Growth Rate (2026 - 2031) | 23.76% CAGR |
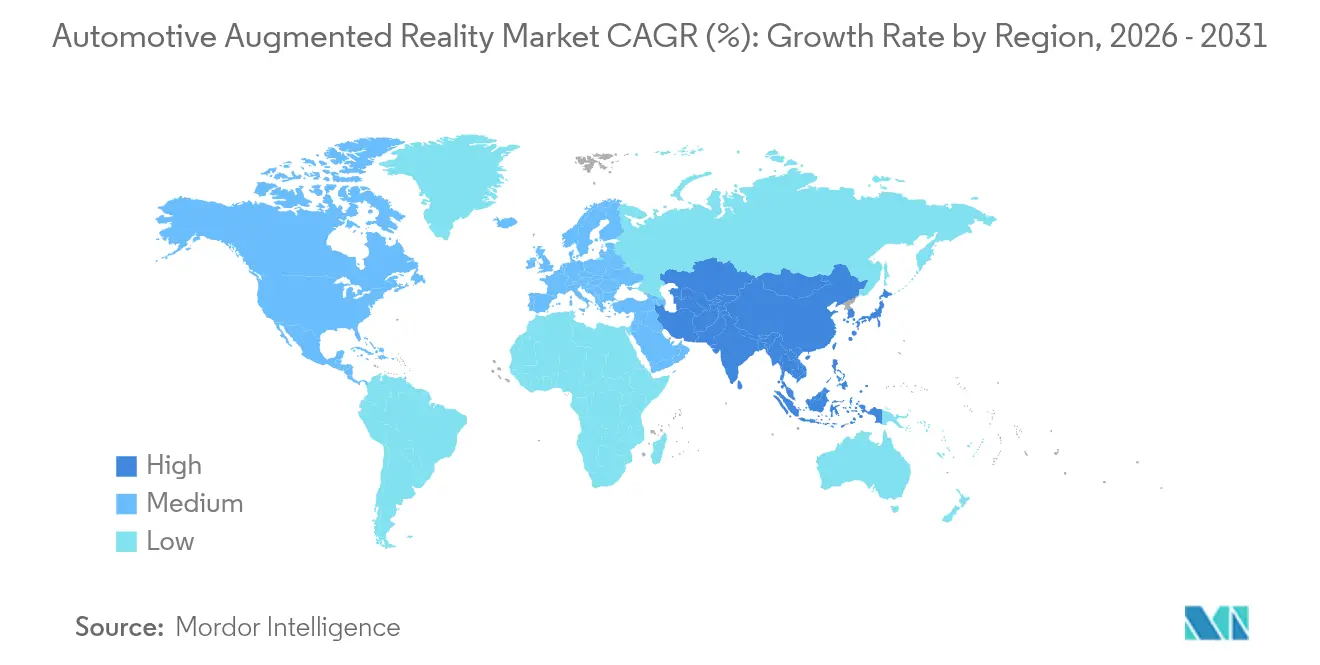
| Fastest Growing Market | Asia Pacific |
| Largest Market | North America |
| Market Concentration | Medium |
Major Players *Disclaimer: Major Players sorted in no particular order Image © Mordor Intelligence. Reuse requires attribution under CC BY 4.0. | |
Automotive Augmented Reality Market Analysis by Mordor Intelligence
The Automotive Augmented Reality market size is expected to grow from USD 8.22 billion in 2025 to USD 10.18 billion in 2026 and is forecast to reach USD 29.57 billion by 2031 at 23.76% CAGR over 2026-2031.
Strong demand stems from software-defined vehicle platforms, rising adoption of advanced driver assistance systems, and tightening safety mandates that emphasize distraction-free human–machine interfaces. Breakthroughs in holographic projection, such as the full-windshield concept demonstrated by Hyundai Mobis for 2027 production, signal a shift toward immersive displays that merge real-world and virtual content without blocking road visibility. The technology mix is evolving as waveguide optics and micro-LED emitters approach mass-production price points, encouraging both luxury and high-volume manufacturers to embed augmented reality directly into the cockpit.
Key Report Takeaways
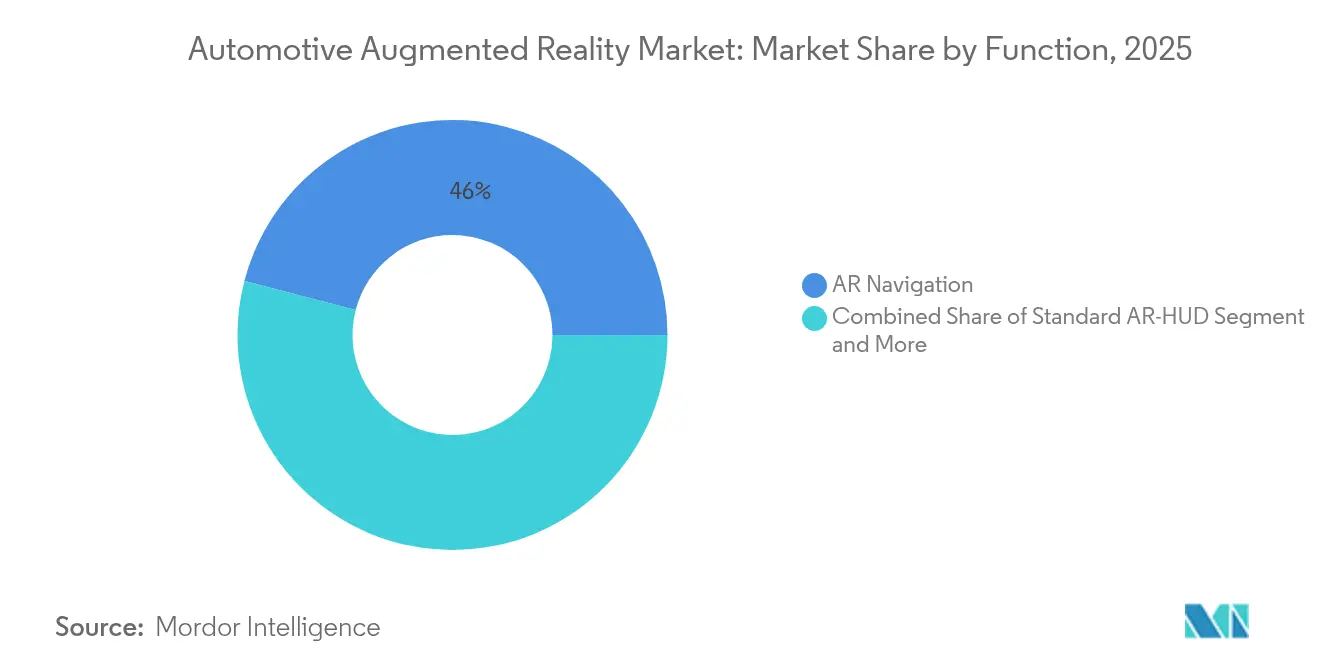
- By function, AR Navigation led with 45.96% revenue share in 2025, whereas AR Lane-Departure Warning is forecast to expand at 28.74% CAGR through 2031.
- By sensor technology, Sensor Fusion held 38.45% of the automotive augmented reality market share in 2025, while LiDAR integration is projected to grow at 31.05% CAGR to 2031.
- By display technology, windshield systems captured a 54.72% share in 2025; waveguide displays are poised for a 27.40% CAGR through 2031.
- By level of autonomy, non-autonomous vehicles accounted for 80.42% of the automotive augmented reality market size in 2025, whereas autonomous vehicles are set to climb at a 32.10% CAGR.
- By vehicle type, passenger cars held a 73.12% share in 2025; commercial vehicles are advancing at a 25.70% CAGR through 2031.
- By sales channel, OEM-fitted solutions commanded 69.55% share in 2025, while aftermarket retrofits are growing at a 26.60% CAGR.
- By geography, North America led with a 42.35% share in 2025; Asia-Pacific is the fastest-growing region at 27.90% CAGR to 2031.
Note: Market size and forecast figures in this report are generated using Mordor Intelligence’s proprietary estimation framework, updated with the latest available data and insights as of 2026.
Global Automotive Augmented Reality Market Trends and Insights
Drivers Impact Analysis*
| Driver | (~) % Impact on CAGR Forecast | Geographic Relevance | Impact Timeline |
|---|---|---|---|
| Growing Adoption of ADAS | +6.2% | Global with North America and Europe leading | Medium term (2-4 years) |
| OEM Integration of AR-HUD In Premium Models | +4.8% | North America, Europe, premium segments in Asia-Pacific | Short term (≤ 2 years) |
| Falling Waveguide and μLED Costs | +3.9% | Global manufacturing hubs, Asia-Pacific core | Long term (≥ 4 years) |
| Regulatory Push for Distraction-Free Displays | +2.8% | Europe primary, North America secondary | Medium term (2-4 years) |
| SDV/OTA Architectures Enable Feature Upgrades | +2.1% | Global, software-defined vehicle markets | Long term (≥ 4 years) |
| Emergence of Holographic Full-Windshield Projection | +1.5% | Premium markets globally, early adoption in Europe, Asia | Long term (≥ 4 years) |
| Source: Mordor Intelligence | |||
Growing Adoption of ADAS Accelerates AR-HUD Integration
Advanced driver assistance systems already employ cameras, radar, and increasingly LiDAR to interpret the driving environment. Augmented reality overlays built on the same sensor data provide intuitive visual cues for lane-keeping, hazard alerts, and navigation, thereby increasing driver trust in automation. Component scale effects from a USD 125 billion ADAS supply chain reduce the bill of materials for heads-up displays. Level 3 handover scenarios also benefit, as augmented graphics guide the driver to retake control compliantly with emerging safety rules. Automakers gain a cost advantage by repurposing existing perception hardware instead of installing separate sensors for each feature.
OEM Integration in Premium Models Establishes Market Foundation
Luxury brands view augmented reality as a brand-building experience rather than a cost burden. Mercedes-Benz and BMW launched large-format systems that cover most of the windshield, demonstrating color fidelity and dimming that remain legible in broad daylight. Premium adoption cycles help qualify optics, coatings, and thermal solutions under stringent reliability standards within two-year model cycles. Consumers consequently perceive the feature as a hallmark of modern luxury, influencing mainstream expectations and pressuring volume manufacturers to develop lower-cost variants. The resulting trickle-down effect compresses the typical innovation lag between luxury and mid-segment trims.
Falling Component Costs Enable Mass-Market Penetration
Waveguide substrates once required costly photolithography steps and bespoke glass melting processes, but new float-glass derivatives and high-yield nano-imprinting cut per-unit costs by double-digit percentages. Micro-LED arrays reach luminance levels of 10,000 nits while consuming less power than legacy LCD backlights, enabling bright projection even in direct sunlight without drawing heavily on a 12-volt architecture. Manufacturing capacity expansions in Malaysia, Taiwan, and mainland China accelerate learning curves and drive standardization across optical bonding layers, making it economically feasible for mid-size sedans to bundle augmented reality packages.
Regulatory Push for Distraction-Free Displays
The EU General Safety Regulation II lists driver attention warnings, emergency lane-keeping, and intelligent speed assistance as mandatory fitments. Heads-up displays that combine these warnings within the driver’s forward line of sight align with compliance objectives and promise to reduce unintended lane departures and speeding incidents[1]“Mandatory Drivers Assistance Systems Expected to Help Save Over 25,000 Lives by 2038,” European Commission, single-market-economy.ec.europa.eu. European road safety agencies estimate that integrated visual guidance could contribute materially to the prevention of 25,000 traffic deaths by 2038. Similarly, though voluntary guidelines in the United States create uniform test-case scenarios that favor suppliers with proven augmented visualization pipelines.
Restraints Impact Analysis*
| Restraint | (~) % Impact on CAGR Forecast | Geographic Relevance | Impact Timeline |
|---|---|---|---|
| High Up-Front AR System Cost | -3.2% | Global, particularly in Asia-Pacific | Short term (≤ 2 years) |
| Eye-Box and Field-of-View Design Limitations | -2.4% | Worldwide, spanning all vehicle segments | Medium term (2-4 years) |
| Limited Windshield Real Estate | -1.8% | Global, accentuated in compact passenger vehicles | Long term (≥ 4 years) |
| Supply-Chain Shortages of Automotive-Grade Waveguides | -1.6% | Manufacturing clusters in Asia-Pacific | Medium term (2-4 years) |
| Source: Mordor Intelligence | |||
High System Costs Limit Mass-Market Adoption
Complete augmented reality packages priced between USD 800 and USD 2,500 strain electronics budgets in small cars, competing directly with surround-view cameras, connectivity modules, and infotainment upgrades. New Chinese suppliers target a 30 to 40% cost reduction by replacing wedge laminates with passive polarization films that still meet windshield optical requirements. Fleet operators likewise adopt a wait-and-see attitude until price points fall to levels comparable with basic telematics units.
Technical Limitations in Eye-Box and Field of View
Balancing a wide eye-box with a large field of view forces trade-offs in optical engine size, heat dissipation, and brightness. Current arrays provide 130 mm × 75 mm eye-box dimensions, yet drivers of varying height struggle to see crisp overlays unless seats are adjusted precisely. Commercial vehicle cabs amplify the challenge because driver seating positions differ widely across shifts. Deep neural networks now optimize virtual content layout to mitigate clipping at display edges, but optical redesigns remain essential for a long-term fix.
*Our forecasts treat driver/restraint impacts as directional, not additive. The impact forecasts reflect baseline growth, mix effects, and variable interactions.
Segment Analysis
By Function: Navigation Dominance Drives Current Adoption
AR Navigation delivered a 45.96% share of the automotive augmented reality market in 2025, reflecting its clear safety and convenience value at highway and urban speeds. Lane-Departure Warning, rising at 28.74% CAGR, addresses stricter lane-keeping regulations and insurance incentives. Adaptive Cruise Control overlays blend time-gap visualization with speed suggestions, allowing drivers to verify system status without glancing at cluster screens.
Standard HUD implementations persist as a lower-cost entry strategy for brands exploring image-generation software partnerships. Automakers also explore point-of-interest labels to support e-commerce partnerships, though monetization models remain early-stage. The functional hierarchy suggests compliance-driven safety features will outpace purely convenience functions until the total cost of ownership drops further. User feedback indicates that navigation graphics anchored to curb edges rather than road centerlines reduce steering wheel adjustments, supporting the perception that interface detail, not merely feature count, drives satisfaction levels.


By Sensor Technology: Fusion Architectures Enable Comprehensive Perception
Sensor Fusion remains dominant with a 38.45% share of the automotive augmented reality market because combining radar, camera, and inertial measurements produces robust localization under glare, rain, or dense traffic. LiDAR, advancing at 31.05% CAGR, introduces centimeter-level depth estimation that precisely pins virtual objects to physical lane markers even when lane paint deteriorates. Radar-only solutions attract commercial fleets that prioritize cost and tolerance to debris obscuration, yet the limited angular resolution curbs use cases to basic forward collision warnings.
Image-sensor arrays deliver photorealistic context for augmented pedestrian alerts, but processing overhead rises exponentially when they form the sole perception stack. Ultrasonic sensors complement near-field object placement during parking maneuvers, yet bandwidth constraints limit their standalone value for dynamic overlays above 30 km/h. The sensor roadmap thus converges on heterogeneous stacks processed by centralized compute nodes that allocate workloads dynamically, boosting efficiency across diverse traffic scenarios.
By Display Technology: Windshield Integration Leads Market Evolution
Windshield systems accounted for a 54.72% share in 2025, proving that integrating optics into laminated safety glass offers a maximized field of view without adding cabin hardware. Combiner-based HUDs still sell into retrofit channels because they clip directly onto the dashboard, cutting integration lead times below three months. Waveguide displays, forecast for a 27.40% CAGR, compress projection optics into a panel thinner than 5 mm, freeing dashboard real estate for infotainment or airbag packaging.
Holographic foils distribute projection points across multiple incidence angles, mitigating ghost images that troubled first-generation prototypes. Micro-OLED engines improve color saturation and lifetime, making direct-view combiner systems attractive for two-wheeler helmets, an adjacent segment often overlooked by car manufacturers. Contoured windshields, common in crossovers and vans, demand variable-thickness laminates to keep overlay tolerance within ISO 15008, extending validation cycles by nine to twelve months. Therefore, Tier-1 suppliers accelerate investments in parametric optical simulators to decouple display design from vehicle design freeze dates.
By Level of Autonomy: Non-Autonomous Systems Drive Current Volume
Vehicles operating at SAE Levels 0 to 2 generated 80.42% of the automotive augmented reality market size in 2025, as they constitute the bulk of global production. For this group, augmented reality improves situational awareness without altering liability frameworks. Level 3 applications grow at 32.10% CAGR because regulators now outline clear transition behaviors that rely on unambiguous driver handoff cues, often presented through windshield icons and countdown bars.
Level 4 robo-taxis use heads-up displays primarily for passenger reassurance and route confirmation, turning the windshield into an experience canvas rather than safety equipment. The design language evolves as autonomy rises; handover messages require contrasting color palettes and audio synchronization, while passenger-only vehicles can incorporate infotainment overlays occupying peripheral zones. Standards bodies formulate luminance ranges aimed at preventing nausea when passengers face dynamic augmented content during lateral accelerations.
By Vehicle Type: Passenger Focus Enables Technology Refinement
Passenger cars held 73.12% of the automotive augmented reality market in 2025, giving suppliers a consistent platform to refine projection optics and heat-resistant polarizers. Consumer surveys show a willingness to pay a USD 700 premium for integrated augmented reality if paired with semi-autonomous driving features. Commercial vehicles are growing at 25.70% CAGR, largely because logistics firms quantify the technology’s benefit in fewer collision-related downtime hours.
Heavy-duty trucks leverage augmented reality to visualize blind-spot zones on A-pillars, reducing merge incidents on multi-lane highways. Bus operators adopt heads-up pedestrian proximity alerts to comply with urban speed restrictions. Fleet procurement cycles bundle augmented reality into broader safety packages that also include driver monitoring cameras, amplifying economies of scale. Agricultural machinery OEMs investigate AR-HUDs for sprayer guidance and obstacle detection, illustrating future diversification beyond on-road segments.

By Sales Channel: OEM Integration Shapes Market Structure
OEM-installed solutions retained 69.55% share of the automotive augmented reality market in 2025, aided by tighter cybersecurity integration with vehicle networks and inclusion in factory warranties. Design-to-delivery lead times align with three-year platform refresh cycles, allowing optical suppliers to amortize tooling investments across high volumes. Aftermarket retrofits, expanding at 26.60% CAGR, attract ride-share drivers and enthusiasts who cannot justify a new-car purchase but desire the safety enhancement.
Universal projector modules paired with adhesive combiner foils reduce installation times to two hours, expanding retail channels at big-box electronics stores. Warranty limitations and certification gaps remain hurdles, yet component standardization efforts aim to secure functional safety ratings analogous to forward camera retrofits. Insurance carriers in some regions have begun offering minor premium reductions to vehicles documented with augmented reality driver-assistance records, bolstering retrofit value propositions.
Geography Analysis
North America generated 42.35% of the automotive augmented reality market in 2025. Premium vehicle density, robust ADAS regulations, and brand differentiation strategies sustain steady growth despite a moderate regional growth through 2031. Canadian provinces are aligning distracted-driving statutes with federal recommendations, further motivating OEMs to embed at-source visual aids. U.S. luxury manufacturers pursue subscription-based navigation overlays to offset electrification R&D budgets, ensuring ongoing feature updates delivered by cellular networks.
Asia-Pacific is the fastest-growing region with a 27.90% CAGR, propelled by the combination of a rising middle class, domestic brand innovation, and cost-competitive optical fabrication. Chinese automakers such as BYD integrate augmented reality into compact sedans priced below USD 20,000, reinforcing the perception that the technology will soon reach mass penetration. Korean and Japanese suppliers leverage domestic semiconductor ecosystems to develop proprietary micro-LED emitters, further shrinking the bill of materials. Regional governments issue tax incentives for makers of driver-assistance electronics, reinforcing supply-chain localization ambitions.
Europe shows significant growth as the General Safety Regulation II moves augmented reality from optional luxury to quasi-mandatory safety equipment. German and Swedish OEMs synchronize AR-HUD rollouts with autonomous pilot programs along pre-mapped highways, highlighting synergies between perception data and human-machine interface design. Suppliers tap EU recovery-fund grants dedicated to zero-accident road maps, accelerating investment in holographic display glass lines. The continent’s cross-border highway network drives demand for multilingual navigation overlays, encouraging software frameworks that switch iconography and units of measure in real time.

Competitive Landscape
The automotive augmented reality market features a moderate concentration where established Tier-1 suppliers hold strong OEM relationships while specialized optics firms contribute unique intellectual property. Bosch upgraded its optical engine to support dual-image planes, allowing simultaneous near-field hazard warnings and far-field navigation cues. Hyundai Mobis partnered with Zeiss to industrialize holographic foil lamination techniques that enable full-windshield projection without distorting polarized sunglasses' views. SCHOTT collaborates with Lumus to lift glass melting capacity, reducing lead times for large waveguide blanks and easing single-source bottlenecks for European OEMs.
Emerging players exploit white-space niches in aftermarket kits and commercial fleet retrofits. Chinese start-up Zhiyungu replaced costly wedge components with proprietary collimator lenses, targeting a 40% cost reduction while maintaining ISO optical standards. U.S. company Mojo Vision integrates micro-LED pixel arrays directly onto silicon backplanes, claiming 20-to-50-times higher efficiency than current LCD-based combiner systems. Patent filings reveal Tesla’s focus on nanosecond-latency communication networks inside the cockpit, suggesting that system-level integration, rather than isolated optical breakthroughs, will shape durable advantages.
Strategic investments cluster around software ecosystems that monetize post-sale upgrades. Qualcomm and Panasonic Automotive will deploy cockpit AI cores that dynamically adjust augmentation density based on driver workload, enabling tiered subscription models. Vuzix and Garmin collaborate on nano-imprinted waveguides for motorcycle helmets, expanding adjacent revenue streams while sharing R&D overhead with automotive programs. As optical simulation libraries mature, smaller suppliers can license reference designs and avoid costly in-house toolchains, further normalizing the competitive playing field.
Automotive Augmented Reality Industry Leaders
Continental AG
Denso Corporation
Panasonic Connect
Visteon Corporation
Robert Bosch GmbH
- *Disclaimer: Major Players sorted in no particular order

Recent Industry Developments
- January 2025: Hyundai Mobis unveiled the first full-windshield holographic display at CES 2025, targeting 2027 mass production.
- January 2025: Panasonic Automotive Systems expanded collaboration with Qualcomm to embed Snapdragon Cockpit Elite AI features into domain controllers from 2026.
- January 2025: HARMAN showcased in-cabin displays powered by Samsung technology and the Ready Aware alert system at CES 2025.
- October 2024: Zeiss and Hyundai Mobis partnered to co-develop panoramic holographic displays for lower windshields, with production slated for 2027.


Research Methodology Framework and Report Scope
Market Definitions and Key Coverage
Our study defines the automotive augmented reality market as all factory-built or retrofit vehicle systems that overlay computer-generated navigation, safety, and infotainment graphics onto the driver's real-world view through windshield or combiner head-up displays, wave-guide projectors, or comparable AR interfaces that synchronize with on-board sensors and cloud data.
Scope exclusion: pure virtual-reality simulators used only in design studios or external driver-training centers fall outside this assessment.
Segmentation Overview
- By Function
- Standard AR-HUD
- AR Navigation
- AR Adaptive Cruise Control
- AR Lane-Departure Warning
- By Sensor Technology
- Radar
- LiDAR
- Image Sensors
- Sensor Fusion
- By Display Technology
- Combiner
- Windshield
- Wave-guide
- By Level of Autonomy
- Non-Autonomous (L0-L2)
- Autonomous (L3-L5)
- By Vehicle Type
- Passenger Vehicles
- Commercial Vehicles
- By Sales Channel
- OEM-fitted
- Aftermarket Retrofit
- By Geography
- North America
- United States
- Canada
- Rest of North America
- South America
- Brazil
- Argentina
- Rest of South America
- Europe
- Germany
- United Kingdom
- France
- Italy
- Spain
- Rest of Europe
- Asia-Pacific
- China
- Japan
- India
- South Korea
- Rest of Asia-Pacific
- Middle East and Africa
- Saudi Arabia
- UAE
- South Africa
- Nigeria
- Rest of Middle East and Africa
- North America
Detailed Research Methodology and Data Validation
Primary Research
Interviews with HUD module engineers in Germany, sensor-fusion chip architects in South Korea, AR-software product leads in California, and procurement managers at passenger-car OEMs across China and Mexico refined attach-rate assumptions, validated average selling prices, and stress-tested regional forecasts against real purchase pipelines.
Desk Research
Mordor analysts mapped the market landscape by mining open datasets from UNECE safety regulations, NHTSA crash-injury statistics, ACEA production rolls, UN Comtrade optical-component trade flows, and patent filings indexed on Questel and IEEE Xplore. Company filings, investor decks, and reputable press feeds accessed via D&B Hoovers and Dow Jones Factiva shaded in cost trends, OEM adoption roadmaps, and partnership deals. These references anchor the baseline before any model build; nevertheless, many additional public and subscription sources were consulted to round out figures and context.
Second-pass desk work linked regional fitment mandates to sensor fusion cost curves and traced micro-LED and wave-guide price erosion through Asia Metal reports and Marklines vehicle BOM snapshots. That linkage helped us size hardware value without overstating software-only revenues.
Market-Sizing & Forecasting
A top-down vehicle-production and trade reconstruction, blended once with bottom-up supplier roll-ups for spot checks, forms the core model. Key variables include annual light-vehicle output, AR-HUD penetration by trim line, average projector ASP, LiDAR and radar cost deflation, regulatory implementation timetables, and electric-vehicle share uplifts. Multivariate regression combined with scenario analysis projects these drivers through 2030, while gap fills, such as missing aftermarket volumes in smaller economies, are bridged using proxy import data and calibrated survey ratios.
Data Validation & Update Cycle
Outputs pass three-layer reviews: automated variance alerts flag anomalies, senior analysts reconcile swings against independent indicators, and the report is refreshed each year, with interim corrections when material events move the market.
Why Mordor's Automotive Augmented Reality Baseline Commands Reliability
Published estimates often diverge because firms anchor on dissimilar scopes, price stacks, or refresh cadences. We acknowledge these gaps upfront, then ground our totals in shipped hardware and verified software licenses, not speculative pipeline talk.
Key gap drivers include whether retrofit sales are counted, how conventional HUD revenues are separated from true AR units, the currency-conversion windows chosen, and the pace at which future fitment laws are baked into forecasts.
Benchmark comparison
| Market Size | Anonymized source | Primary gap driver |
|---|---|---|
| USD 8.22 B (2025) | Mordor Intelligence | - |
| USD 15.47 B (2024) | Regional Consultancy A | Rolls broader supply-chain revenue plus prototype showcase spend, inflating base. |
| USD 5.00 B (2024) | Global Consultancy B | Applies conventional HUD ASPs and omits aftermarket retrofits, understating value. |
The comparison shows that when scope, variables, and update rhythm are aligned with real production evidence, Mordor delivers a balanced, transparent baseline that decision-makers can trace back to clear inputs and repeatable steps.


Key Questions Answered in the Report
What is the current size of the automotive augmented reality market?
The market stands at USD 10.18 billion in 2026 and is projected to reach almost USD 29.57 billion by 2031.
Which region leads global adoption?
North America leads with a 42.35% share in 2025, driven by premium vehicle density and supportive safety regulations.
Which application segment is growing fastest?
AR Lane-Departure Warning is advancing at a 28.74% CAGR through 2031 due to its safety-centric value.
How will falling component costs affect adoption?
Lower waveguide and micro-LED prices are expected to push augmented reality packages into mid-segment vehicles within four years.
Why are OEM-fitted systems dominant?
Factory integration accounts for 69.55% of the 2025 volume because it ensures quality control, cybersecurity alignment, and warranty coverage.
Page last updated on:


