Augmented Reality Games Market Size and Share
Market Overview
| Study Period | 2020 - 2031 |
|---|---|
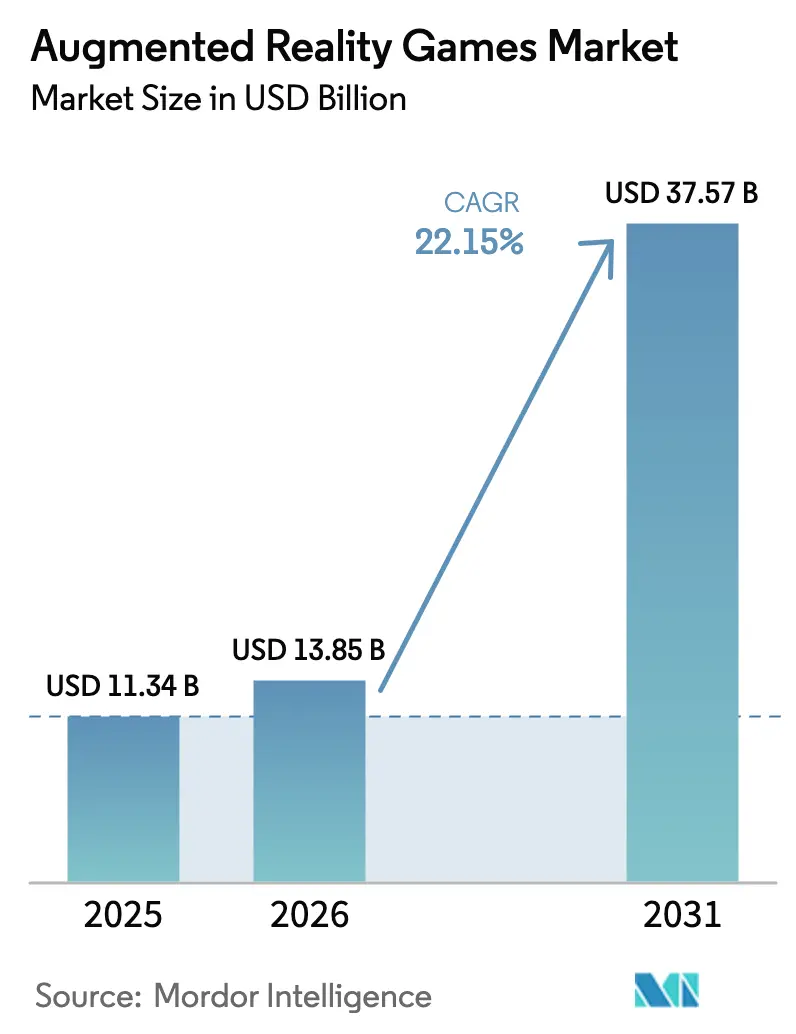
| Market Size (2026) | USD 13.85 Billion |
| Market Size (2031) | USD 37.57 Billion |
| Growth Rate (2026 - 2031) | 22.15% CAGR |
| Fastest Growing Market | Asia Pacific |
| Largest Market | North America |
| Market Concentration | Medium |
Major Players *Disclaimer: Major Players sorted in no particular order Image © Mordor Intelligence. Reuse requires attribution under CC BY 4.0. | |
Augmented Reality Games Market Analysis by Mordor Intelligence
The augmented reality games market size was valued at USD 11.34 billion in 2025 and estimated to grow from USD 13.85 billion in 2026 to reach USD 37.57 billion by 2031, at a CAGR of 22.15% during the forecast period (2026-2031). Growth is underpinned by 5G roll-out, cloud-anchored persistent-world platforms and cost-optimised chipsets that allow seamless multiplayer experiences on both smartphones and lightweight wearables. Mobile devices currently dominate revenues, yet rapid improvements in smart-glasses optics and power management signal an impending device mix shift. Location-based gameplay remains the principal design archetype thanks to mature geospatial data sets, while blockchain-linked play-to-earn mechanics are redrawing monetisation strategies. Regionally, North America continues to generate the highest spend, but Asia-Pacific delivers the steepest revenue curve as telcos blanket key markets with mid-band 5G and culturally embedded social-gaming habits migrate to AR formats.[1]GSMA, “The Mobile Economy Asia Pacific 2024,” gsma.com
Key Report Takeaways
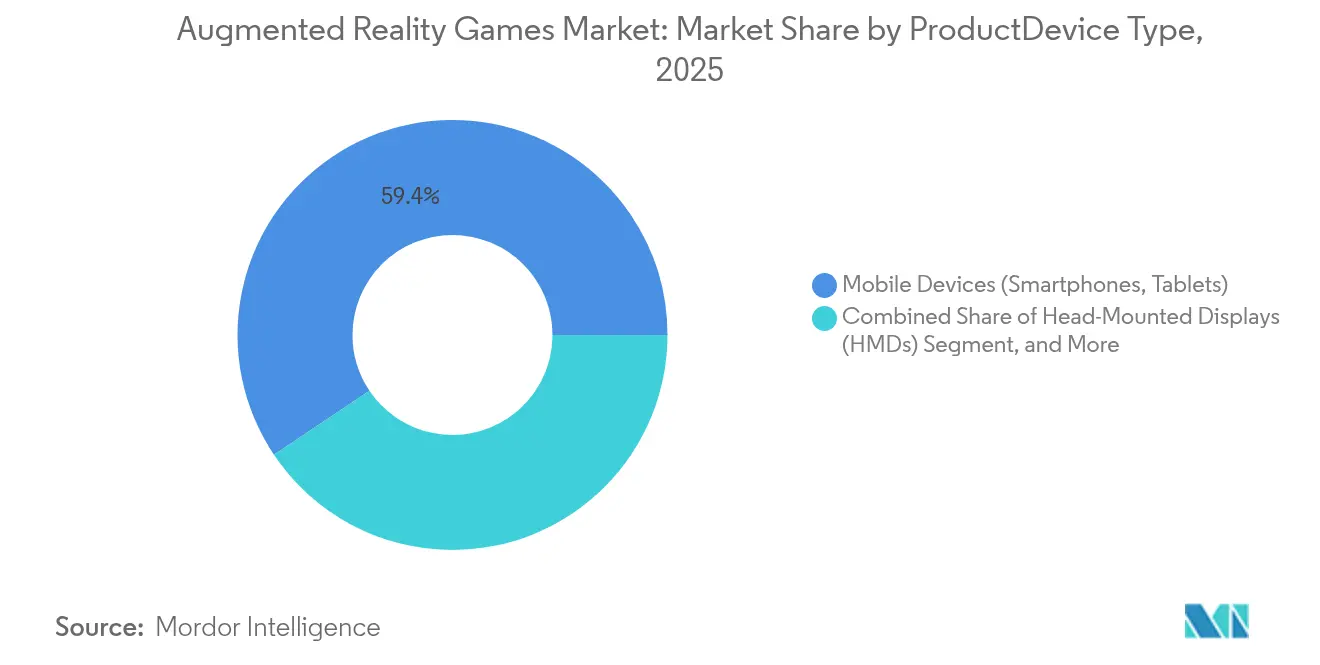
- By product category, mobile devices captured 59.40% of the augmented reality games market share in 2025, while AR/smart glasses are projected to grow at a 27.1% CAGR through 2031.
- By component, hardware contributed 57.30% of 2025 revenue; services are expanding fastest at a 30.9% CAGR to 2031.
- By game type, location-based experiences held 64.10% of the augmented reality games market size in 2025; mixed-reality hybrids are on course for a 35.9% CAGR to 2031.
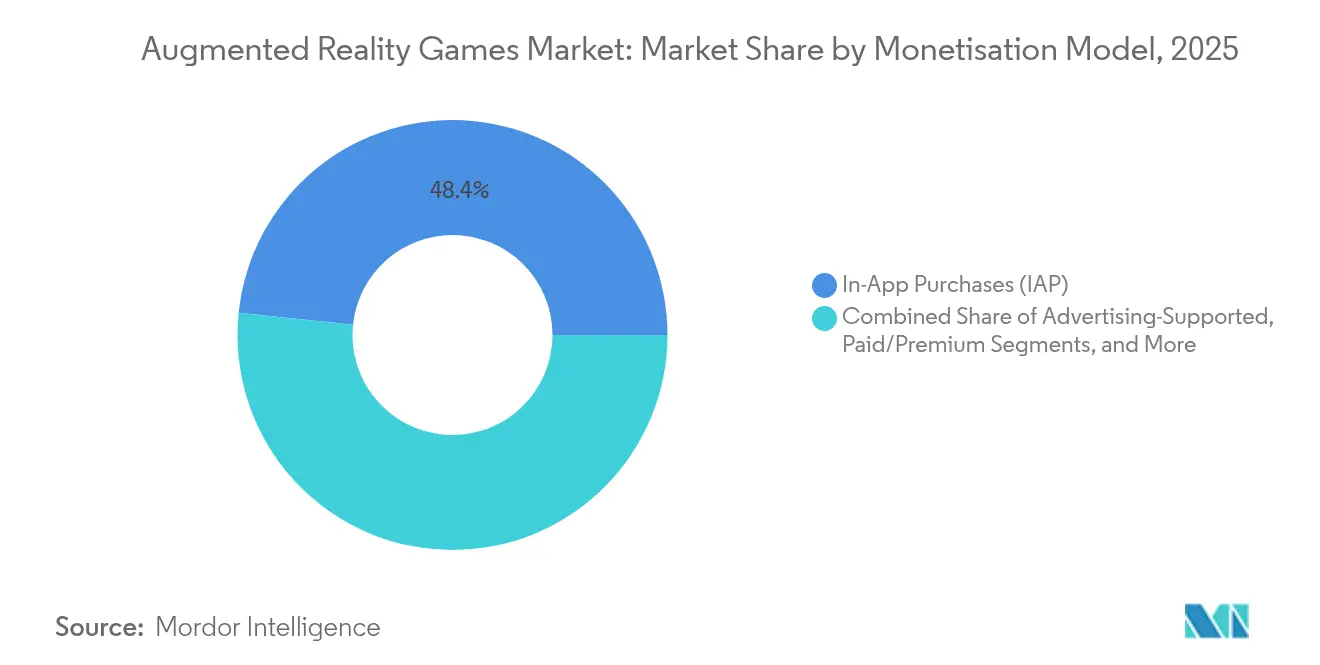
- By monetisation model, in-app purchases delivered 48.35% of 2025 revenue; play-to-earn and NFT-integrated titles are accelerating at a 33.2% CAGR.
- By application, personal and home entertainment accounted for 69.20% of 2025 revenue, whereas fitness and health gamification is climbing at a 28.6% CAGR.
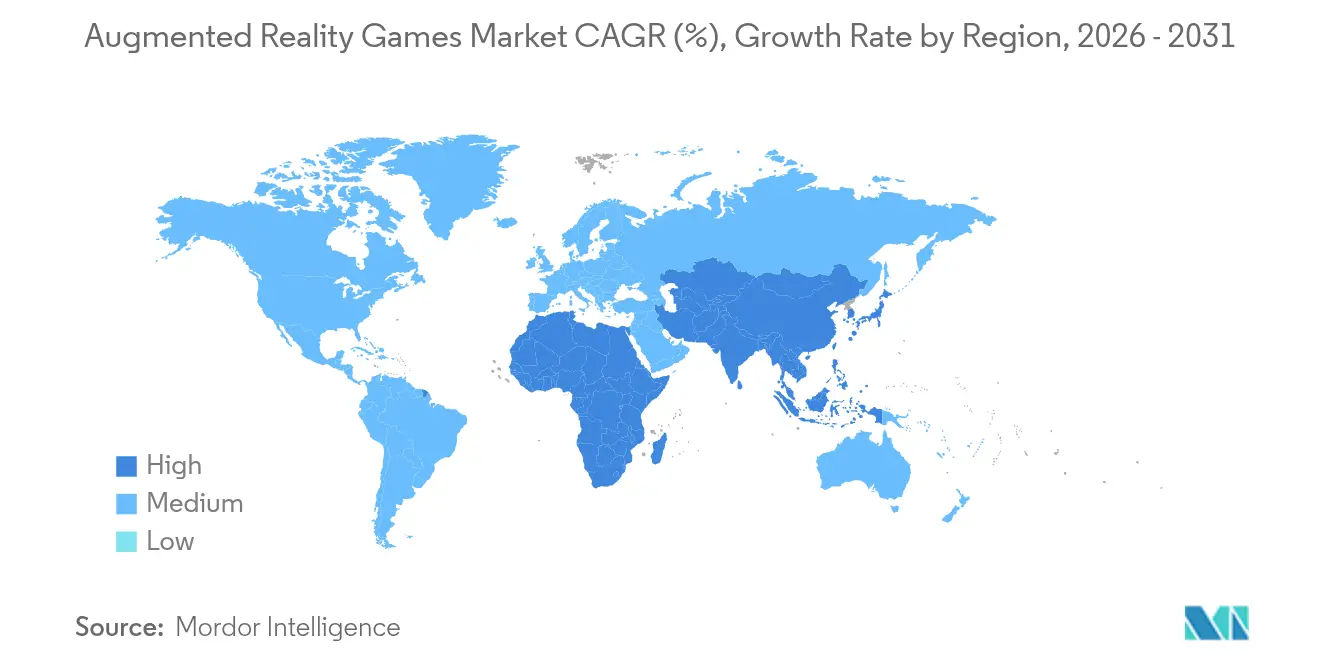
- By geography, North America led with 34.60% revenue in 2025; Asia-Pacific is the fastest-growing region at a 26.7% CAGR to 2031.
Note: Market size and forecast figures in this report are generated using Mordor Intelligence’s proprietary estimation framework, updated with the latest available data and insights as of 2026.
Global Augmented Reality Games Market Trends and Insights
Drivers Impact Analysis*
| Driver | (~) % Impact on CAGR Forecast | Geographic Relevance | Impact Timeline |
|---|---|---|---|
| 5G-enabled smartphones unlock real-time multiplayer gameplay | +4.2% | APAC core, spill-over to MEA | Medium term (2-4 years) |
| Location-based advertising partnerships with tourism boards | +2.8% | Europe, expanding to North America | Short term (≤ 2 years) |
| LiDAR sensors in Apple devices enable advanced occlusion | +3.1% | North America & EU | Medium term (2-4 years) |
| Qualcomm Snapdragon AR2 Gen 2 lowers headset BOM | +2.9% | Global | Long term (≥ 4 years) |
| Cloud-anchored persistent worlds boost city-scale engagement | +3.4% | Global, early gains in urban centers | Medium term (2-4 years) |
| Corporate wellness subsidies fuel AR fitness titles | +1.8% | Nordics & Australia | Short term (≤ 2 years) |
| Source: Mordor Intelligence | |||
5G network proliferation transforms multiplayer architecture
Commercial 5G coverage widened sharply across Asia-Pacific in 2024, lifting mobile-internet users past 1.4 billion and delivering sub-20 ms latency that sustains synchronous AR battles for dozens of co-located players. The inflow of bandwidth and edge-compute capability eliminates prior motion-to-photon lag, enabling persistent cross-session avatars, volumetric voice chat and real-time environment updates. Developers consequently record longer average session lengths and higher retention, outcomes that directly enlarge the augmented reality games market addressable base.
Location-based advertising partnerships reshape revenue models
European tourism boards now embed branded quests and historical overlays into landmark-centric titles, shifting monetisation from user spend to advertiser budgets.[2]Iva Cibilić et al., “Implementing Augmented Reality in Tourism,” proc-int-cartogr-assoc.net Early pilots in Croatia increased museum footfall and generated premium CPMs, prompting similar initiatives around US national parks. This dynamic diversifies cash-flow sources, reduces platform dependency on micro-transactions and widens the augmented reality games market participation of cultural institutions.
LiDAR integration enables advanced occlusion mechanics
Apple’s LiDAR-equipped devices map indoor environments at millimetre-level depth, empowering games to hide virtual creatures behind real furniture and to anchor physics-based puzzles onto complex surfaces.[3]Apple Inc., “Apple Arcade for Apple Vision Pro Takes Players into a New Dimension,” apple.com User tests show perceptual realism rises markedly when occlusion accuracy surpasses 95%, directly lifting in-app purchase conversion. However, developers still combine LiDAR meshes with visual-inertial odometry to maintain tracking stability over multi-hour sessions.[4]Wojtek Trzasko, “LiDAR Research - Analyzing Apple’s LiDAR Scanner,” nomtek.com
Qualcomm chipset advances reduce headset manufacturing costs
The Snapdragon AR2 Gen 2 reference design delivers 2.5× GPU throughput and 8× on-device AI versus the previous generation while cutting PCB footprint by 40%.[5]Qualcomm, “Qualcomm Launches Its Next Generation XR and AR Platforms,” qualcomm.com Component consolidation trims bill-of-materials and allows sub-300-gram goggles that pass consumer comfort thresholds. OEM roadmaps indicate more than 15 models in active design, a pipeline that elevates hardware choice and deepens the augmented reality games market penetration of dedicated wearables.
Restraints Impact Analysis*
| Restraint | (~) % Impact on CAGR Forecast | Geographic Relevance | Impact Timeline |
|---|---|---|---|
| EU privacy standard gaps slow large-scale launches | -2.1% | Europe | Medium term (2-4 years) |
| Battery drain & thermal throttling on mid-tier Android devices | -1.9% | Emerging Asia | Short term (≤ 2 years) |
| Fragmented content discovery across app stores & browsers | -1.4% | Global | Long term (≥ 4 years) |
| High mobile-data costs in South America & Africa | -2.3% | South America & Africa | Medium term (2-4 years) |
| Source: Mordor Intelligence | |||
Absence of harmonised EU privacy rules delays launches
Developers must currently interpret divergent national statutes on biometric scanning and geolocation, adding legal overhead that postpones pan-EU roll-outs and defers marketing spend.. The uncertainty particularly constrains crowd-scaled titles reliant on shared vision data, reducing early-stage revenue momentum in a region otherwise rich in tourist landmarks.
Android hardware limitations constrain session duration
Thermal throttling on sub-USD 300 smartphones curtails GPU frequency after 15-20 minutes of graphics-heavy AR, cutting median gameplay sessions in Indonesia and Vietnam by 35% versus flagship-grade devices. Developers are forced to down-scale polygon counts, which in turn diminishes immersion and monetisation potential until chipset efficiencies diffuse to budget tiers.
*Our forecasts treat driver/restraint impacts as directional, not additive. The impact forecasts reflect baseline growth, mix effects, and variable interactions.
Segment Analysis
By Product/Device Type: Mobile leadership faces smart-glasses acceleration
Mobile handsets contributed 59.40% of the augmented reality games market size in 2025, reflecting near-universal smartphone ownership and mature SDKs such as ARKit and ARCore. Yet wearables are scaling quickly as component miniaturisation permits 50-gram glasses that deliver a 45-degree field of view and six-hour battery life. Qualcomm’s AR2 platform and Samsung-Google’s Android XR alliance are catalysing OEM pipelines, hinting at a device mix realignment after 2027. Multi-modal input, including gaze and pinch detection, further differentiates head-worn form factors by freeing both hands for continuous interaction.
Developers are consequently adopting cross-device asset pipelines that auto-scale texture resolution and UI density. Early access titles on Meta’s smart-glasses ecosystem already log 20% longer session averages than comparable smartphone builds, signalling that wearables can unlock premium pricing tiers. Nevertheless, smartphones will remain a sizeable revenue bedrock through 2030 as they serve entry-level users and markets with low discretionary spend.


By Component: Services growth outpaces hardware revenue
Hardware generated 57.30% of 2025 sales, anchored by cameras, depth sensors and waveguides. The services layer, however, is posting a 30.9% CAGR as publishers migrate from one-off device profit to recurring cloud income. Unity’s Audience Hub links 3 billion gamer profiles to privacy-first ad-partners, demonstrating how data orchestration and analytics now command strategic value.
Cloud rendering, positional data APIs and user-generated-content moderation round out the services stack, shifting competitive advantage toward platforms that secure multi-year developer contracts. Hardware vendors are responding with bundled service credits, reinforcing ecosystem lock-in while diluting stand-alone component margins.
By Game Type: Location-based dominance challenged by mixed-reality hybrids
Location-based titles owned 64.10% of the augmented reality games market share in 2025, an edge earned through Niantic’s early mapping and the player familiarity bred by Pokémon GO. Yet mixed-reality hybrids are expanding at 35.9% CAGR by fusing spatial anchors with full-body occlusion and real-time environment re-lighting. Volkswagen’s mobility field tests with Microsoft HoloLens 2 prove that XR gameplay can persist inside moving vehicles, opening transit-time use cases.
Developers pursuing hybrid mechanics must solve alignment drift when users transition indoors, a technical frontier where visual positioning systems and private 5G slice connectivity show promise. The resulting design flexibility invites licensed sports franchises and narrative-rich IPs that need dynamic set pieces untethered from static geofences.
By Monetisation Model: Blockchain reinvents player economics
In-app purchases still contributed 48.35% of 2025 turnover, but tokenised economies are rising swiftly on 33.2% CAGR. Smart contracts now mint scarce digital wearables whose resale royalties flow back to studios, smoothing post-launch cash flow. Players, meanwhile, view ownership of NFTs as status and income, spending longer in-game to appreciate asset values. Adoption is highest in South-East Asia where under-banked demographics favour blockchain wallets over credit cards.
Ad-supported and subscription hybrids are evolving too. European tourism boards underwrite in-game quests, while fitness platforms sell annual passes with tiered coaching content that reduce revenue volatility compared with episodic DLC drops.
By Application: Fitness gamification becomes enterprise growth lever
Personal entertainment accounted for 69.20% of spend in 2025, yet corporate wellness programmes are fast-tracking fitness-centric titles. Nordic employers subsidise AR running games that sync with health insurance portals, covering subscription fees to promote employee activity. The segment’s 28.6% CAGR reflects clear ROI for companies that log reduced absenteeism and improved workforce retention.
Developers embed heart-rate APIs and dashboard analytics to meet enterprise reporting needs, thereby commanding higher per-seat pricing than consumer equivalents. The dual-target approach balances volume-driven consumer margins with premium enterprise invoices, broadening cash-flow resilience across the augmented reality games market.
Geography Analysis
North America held 34.60% of 2025 revenue as deep 5G coverage and Apple’s LiDAR-enabled device base provide fertile ground for early adopter spending. Major publishers pilot spatial-computing concepts on Vision Pro before global scale-out, and US corporates integrate AR wellness apps into benefits packages. The region also hosts the densest cluster of cloud edge nodes, enabling persistent-world latency below 15 ms across key metros.
Asia-Pacific is the locomotive of future growth, charting a 26.7% CAGR through 2031. Operators in China, South Korea and Japan have extended mid-band 5G to more than 80% of urban populations, allowing multiplayer titles to flourish. Mobile-first gamer cultures, where free-to-play mechanics are norm, convert readily to location-based AR quests. Challenges remain around battery drain on mid-tier Android devices, yet chipset roadmaps suggest a step-change in power efficiency by 2027.
Europe advances steadily once privacy harmonisation matures. Tourism authorities replicate Croatian pilot successes by embedding AR narratives in UNESCO heritage sites, driving incremental visitor spend. Nordic corporates amplify demand for fitness-gamified titles, while regulatory ambiguity still delays continent-wide launches that rely on large-scale geospatial data sharing. Latin America and MEA trail but show long-run upside as mobile-data tariffs decline and handset ASPs fall.

Competitive Landscape
The augmented reality games market remains moderately fragmented. Niantic sustains leadership in location-based design thanks to its Lightship VPS that covers over 1 million mapped sites globally. Unity dominates cross-platform engines, driving monetisation via cloud collaboration tools rather than self-published content. Samsung, Google and Qualcomm pool IP to accelerate an Android-centred XR ecosystem, challenging Apple’s vertically integrated approach.
Meta leverages Qualcomm chipsets and generative AI to shorten content pipeline cycles and to tailor real-time events in metaverse settings. Hardware patents for lightweight lens stacks and battery-efficient waveguides give Samsung defensible moats in wearables manufacturing, while Apple’s focus on end-to-end spatial computing sustains premium pricing power.
White-space opportunities exist in enterprise wellness and cultural-tourism niches where incumbent game studios lack tailored content. Service-oriented integrators such as Capgemini fill gaps by customising AR layers for non-gaming clients, blending workforce training with gamified engagement to expand addressable revenue beyond consumer entertainment.
Augmented Reality Games Industry Leaders
HP Inc.
Qualcomm Inc.
Milkroom Studios GmbH
Blippar Ltd.
Netmarble Corp.
- *Disclaimer: Major Players sorted in no particular order

Recent Industry Developments
- June 2025: Samsung and Google confirmed a joint programme to ship AR smart-glasses running Gemini AI on Qualcomm Snapdragon AR1 Gen 1, with first units targeted for late 2025 commercial release.
- May 2025: Unity Software posted USD 435 million Q1 2025 revenue and unveiled Unity 6.1, adding AI-assisted asset workflows for Meta Quest and Android XR devices.
- April 2025: Unity announced Survival Kids as a co-developed Nintendo Switch 2 launch title alongside KONAMI, marking the engine provider’s first end-to-end game production.
- March 2025: Apple released visionOS 2.4, integrating Apple Intelligence features that improve spatial-gaming NPC interactions and real-time environment mapping.
- February 2025: Unity reported USD 1.813 billion FY 2024 revenue and emphasised growth in subscription-based developer services despite portfolio rationalisation.


Global Augmented Reality Games Market Report Scope
Augmented reality (AR) games are interactive video games that combine real-world environments with digital content using augmented reality technology. AR games use the camera, sensors, and screen of a device (such as a smartphone, tablet, or AR glasses) to overlay virtual elements—such as characters, objects, or information—onto the real world in real time.
The study tracks the revenue accrued through the sale of augmented reality games by various players across the globe. It also tracks the key market parameters, underlying growth influencers, and major vendors operating in the industry, which supports the market estimations and growth rates over the forecast period. The study further analyses the overall impact of COVID-19 aftereffects and other macroeconomic factors on the market. The report’s scope encompasses market sizing and forecasts for the various market segments.
The augmented reality games market is segmented by device (head-mounted display, mobile devices, AR glasses, and other device types), application (personal and commercial), and geography (North America, Europe, Asia Pacific, Middle East & Africa, and Latin America). The market sizes and forecasts regarding value (USD) for all the above segments are provided.
| Head-Mounted Displays (HMDs) |
| Mobile Devices (Smartphones, Tablets) |
| AR/Smart Glasses |
| Spatial Displays (Projection, Desktop) |
| Accessories and Sensors |
| Hardware |
| Software |
| Services |
| Location-Based AR Games |
| Marker-Based AR Games |
| Projection-Based AR Games |
| Super-imposition and Occlusion-Based Games |
| Mixed-Reality (MR)-Hybrid Games |
| In-App Purchases (IAP) |
| Advertising-Supported |
| Paid/Premium |
| Subscription |
| Play-to-Earn and NFT Integrated |
| Personal/Home Entertainment |
| Commercial Arcade and LBE |
| Educational and Serious Games |
| Fitness and Health Gamification |
| North America | United States |
| Canada | |
| Mexico | |
| South America | Brazil |
| Argentina | |
| Rest of South America | |
| Europe | Germany |
| United Kingdom | |
| France | |
| Italy | |
| Spain | |
| Rest of Europe | |
| Asia-Pacific | China |
| Japan | |
| South Korea | |
| India | |
| Australia | |
| Rest of Asia-Pacific | |
| Middle East | United Arab Emirates |
| Saudi Arabia | |
| Rest of Middle East | |
| Africa | South Africa |
| Rest of Africa |
| By Product/Device Type | Head-Mounted Displays (HMDs) | |
| Mobile Devices (Smartphones, Tablets) | ||
| AR/Smart Glasses | ||
| Spatial Displays (Projection, Desktop) | ||
| Accessories and Sensors | ||
| By Component | Hardware | |
| Software | ||
| Services | ||
| By Game Type | Location-Based AR Games | |
| Marker-Based AR Games | ||
| Projection-Based AR Games | ||
| Super-imposition and Occlusion-Based Games | ||
| Mixed-Reality (MR)-Hybrid Games | ||
| By Monetization Model | In-App Purchases (IAP) | |
| Advertising-Supported | ||
| Paid/Premium | ||
| Subscription | ||
| Play-to-Earn and NFT Integrated | ||
| By Application | Personal/Home Entertainment | |
| Commercial Arcade and LBE | ||
| Educational and Serious Games | ||
| Fitness and Health Gamification | ||
| By Geography | North America | United States |
| Canada | ||
| Mexico | ||
| South America | Brazil | |
| Argentina | ||
| Rest of South America | ||
| Europe | Germany | |
| United Kingdom | ||
| France | ||
| Italy | ||
| Spain | ||
| Rest of Europe | ||
| Asia-Pacific | China | |
| Japan | ||
| South Korea | ||
| India | ||
| Australia | ||
| Rest of Asia-Pacific | ||
| Middle East | United Arab Emirates | |
| Saudi Arabia | ||
| Rest of Middle East | ||
| Africa | South Africa | |
| Rest of Africa | ||


Key Questions Answered in the Report
What is the current size of the augmented reality games market?
The augmented reality games market size stood at USD 13.85 billion in 2026 and is projected to reach USD 37.57 billion by 2031.
Which device segment is growing fastest in AR gaming?
AR/smart glasses are the fastest-growing segment, charting a 27.1% CAGR between 2026 and 2031 as lightweight optics and efficient chipsets enter mass production.
How are AR games primarily monetised today?
In-app purchases constitute 48.35% of 2025 revenue, though play-to-earn and NFT-based models are expanding at a 33.2% CAGR.
Which region is expected to deliver the highest AR gaming growth?
Asia-Pacific is forecast to grow at 26.7% CAGR to 2031, fuelled by ubiquitous 5G and a strong mobile-first gaming culture.
Why are services revenues rising faster than hardware sales?
Publishers increasingly rely on cloud rendering, data analytics and audience-targeting platforms, pushing the services component to a 30.9% CAGR as recurring income overtakes one-off device margins.
What regulatory challenge most affects European AR game launches?
The lack of harmonised EU rules for location and vision data introduces compliance uncertainty that delays continent-wide deployments and raises legal costs.
Page last updated on:


