Argentina Courier, Express, And Parcel (CEP) Market Size and Share
Market Overview
| Study Period | 2018 - 2031 |
|---|---|
| Forecast Data Period | 2026 - 2031 |
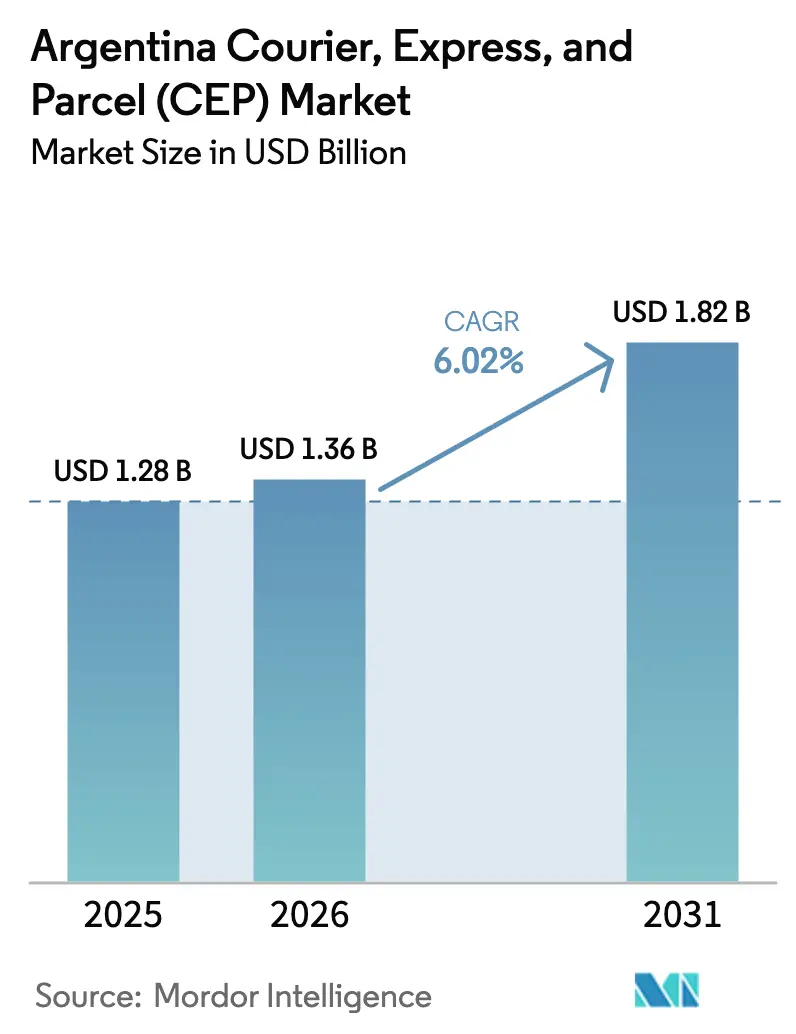
| Base Year Market Size (2025) | USD 1.28 Billion |
| Market Size (2026) | USD 1.36 Billion |
| Market Size (2031) | USD 1.82 Billion |
| Growth Rate (2026 - 2031) | 6.02% CAGR |
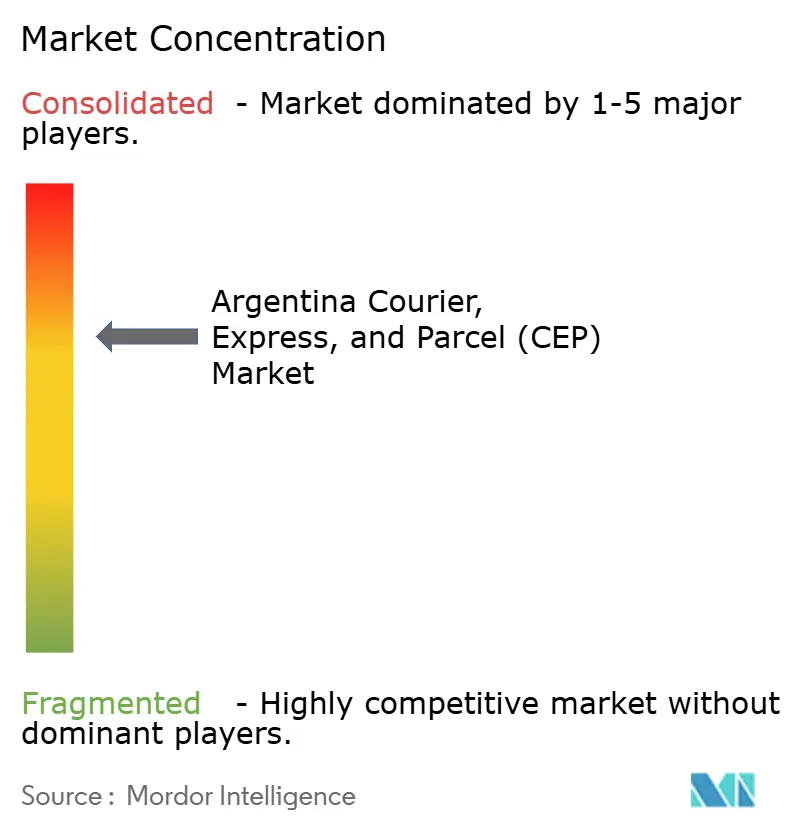
| Market Concentration | Medium |
Major Players *Disclaimer: Major Players sorted in no particular order Image © Mordor Intelligence. Reuse requires attribution under CC BY 4.0. | |
Argentina Courier, Express, And Parcel (CEP) Market Analysis by Mordor Intelligence
The Argentina courier, express, and parcel market size was valued at USD 1.28 billion in 2025 and estimated to grow from USD 1.36 billion in 2026 to reach USD 1.82 billion by 2031, at a CAGR of 6.02% during the forecast period (2026-2031). The Argentina courier, express, and parcel market benefits from the Milei administration’s liberalization program, which removed currency controls and eased import limits, stimulating cross-border trade and parcel flows. E-commerce platforms, including Mercado Libre’s USD 2.6 billion 2025 logistics investment, continue to push shipment volumes higher by upgrading fulfillment centers and last-mile capacity. Record export earnings and a widening set of 186 trading partners have lifted international parcel demand, while quick-commerce players such as PedidosYa fuel rapid-delivery expectations in major cities. Meanwhile, global integrators are adding direct flights and cold-chain capacity, signaling confidence that the Argentina courier, express, and parcel market can sustain robust growth despite persistent inflation and infrastructure gaps.
Key Report Takeaways
- By destination, domestic shipments accounted for 64.20% of the Argentina courier, express, and parcel market share in 2025, whereas international services are projected to register the fastest 6.17% CAGR between 2026-2031.
- By speed of service, non-express parcels held 75.10% of the Argentina courier, express, and parcel market size in 2025; express delivery is forecast to accelerate at a 6.86% CAGR between 2026-2031.
- By model, the business-to-consumer (B2C) segment dominated with 56.10% revenue share in 2025 and is expected to post the highest 7.18% CAGR between 2026-2031.
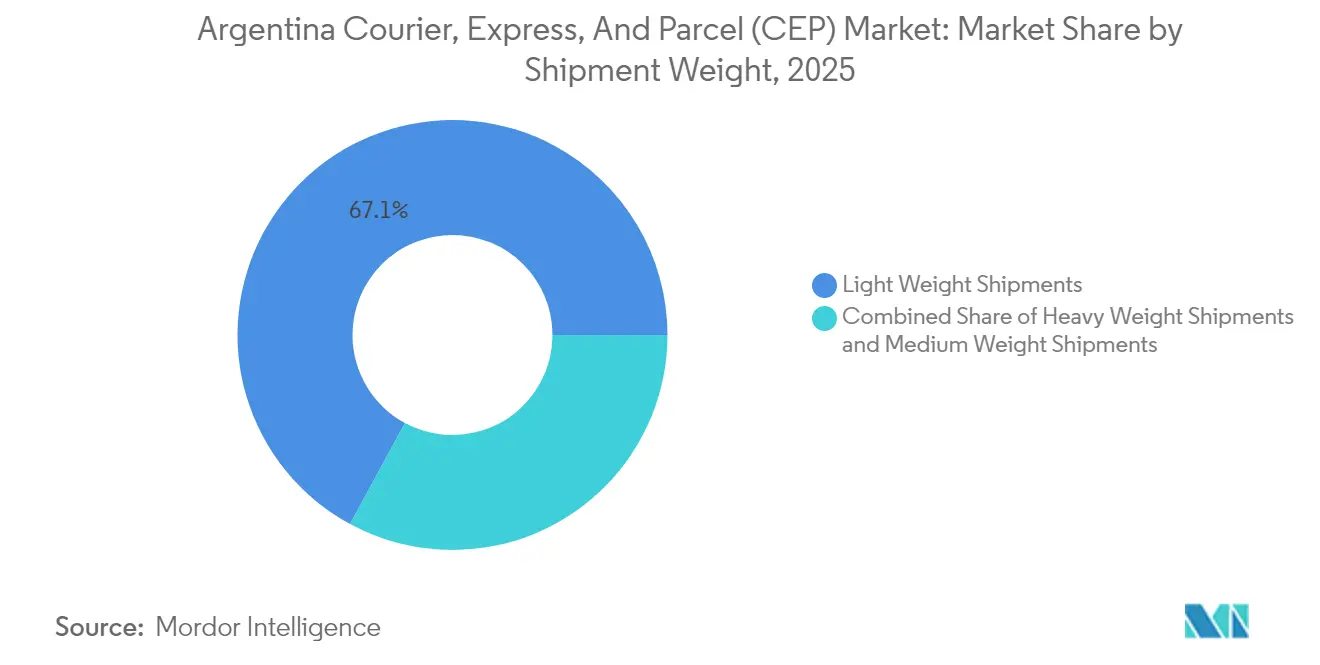
- By shipment weight, lightweight parcels captured 67.10% of the 2025 value and are on track for the strongest 6.58% CAGR between 2026-2031.
- By mode of transport, road retained 60.20% of shipments in 2025; air freight is set to grow fastest at a 6.56% CAGR between 2026-2031.
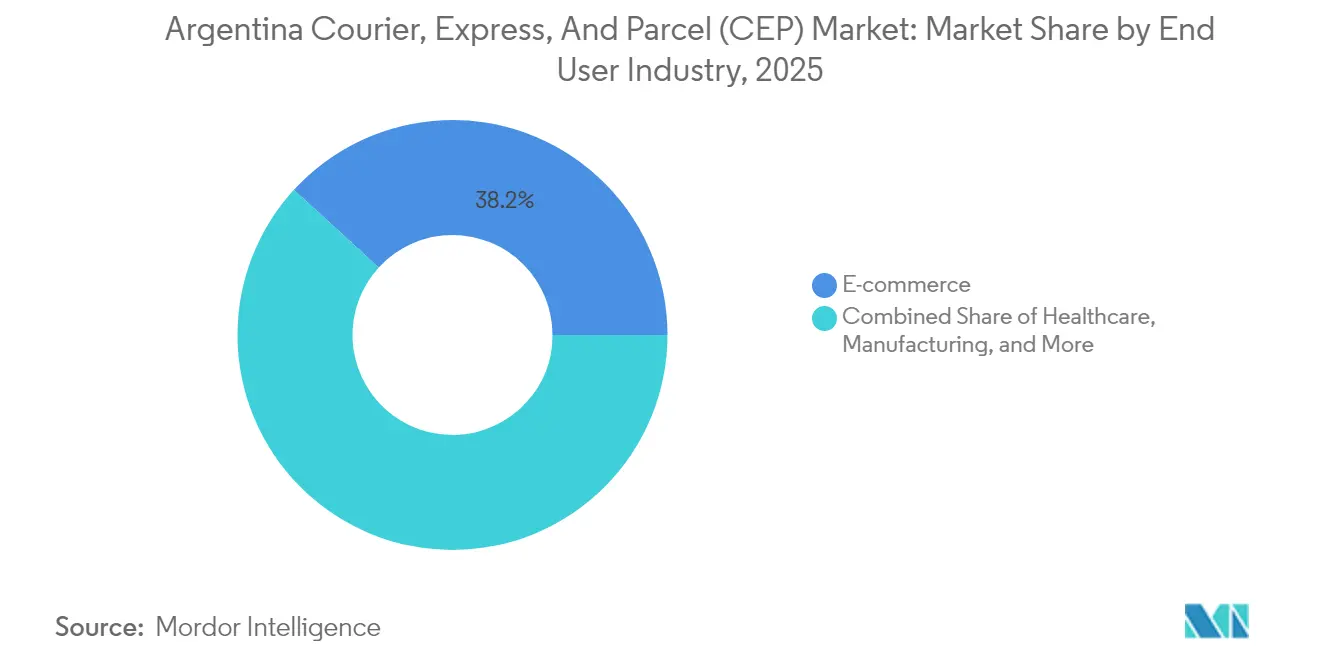
- By end user industry, e-commerce generated 38.20% of 2025 revenue and is expected to rise quickly with a 6.52% CAGR between 2026-2031.
Note: Market size and forecast figures in this report are generated using Mordor Intelligence’s proprietary estimation framework, updated with the latest available data and insights as of 2026.
Argentina Courier, Express, And Parcel (CEP) Market Trends and Insights
Drivers Impact Analysis*
| Driver | (~) % Impact on CAGR Forecast | Geographic Relevance | Impact Timeline |
|---|---|---|---|
| E-commerce boom driving parcel volumes | +1.8% | National, concentrated in Buenos Aires metropolitan area | Short term (≤ 2 years) |
| Public investment in logistics infrastructure | +1.2% | National, with focus on northern corridors and port modernization | Medium term (2-4 years) |
| Cross-border trade expansion within Mercosur | +0.9% | Regional, emphasizing Brazil-Argentina corridor | Medium term (2-4 years) |
| Rise of quick-commerce (Q-commerce) platforms | +0.7% | Urban centers, primarily Buenos Aires, Córdoba, Rosario | Short term (≤ 2 years) |
| Electrification of last-mile fleets | +0.4% | Urban areas with charging infrastructure development | Long term (≥ 4 years) |
| Digital payment adoption boosting B2C success rates | +0.6% | National, with higher penetration in urban markets | Short term (≤ 2 years) |
| Source: Mordor Intelligence | |||


E-Commerce Boom Driving Parcel Volumes
Digital retail adoption keeps parcel demand climbing. Mercado Libre’s 2025 network expansion and continuous warehouse automation have shortened fulfillment cycles, increasing expectations for two-day or faster delivery[1]Ayelén Iñigo, “Mercado Libre anuncia inversión de 2600 millones de dólares en Argentina durante 2025,” fashionnetwork.com. The concentration of online shoppers in the Buenos Aires metropolitan area supports dense delivery routes that improve unit economics. Retailers outside the capital view fast shipping as a competitive advantage, motivating them to outsource to specialized couriers. Smaller merchants also benefit from simplified import limits, which now allow individual shipments up to USD 3,000 without extensive paperwork. Combined, these shifts create a virtuous loop in which higher service levels reinforce customer loyalty and drive sustained volume growth in the Argentina courier, express, and parcel market.
Public Investment in Logistics Infrastructure
Argentina has prioritized upgrades on the Bioceanic Corridor—a USD 10 billion, 2,400 km multimodal network linking Atlantic and Pacific ports—aiming to finish 22 projects by 2026[2]Indian Council of World Affairs, “The Bioceanic Corridor—The Road to Development in South America,” icwa.in. Although federal austerity has slowed direct government spending, concession models are attracting private funds to dredge the Paraguay-Paraná waterway that moves nearly 80% of export cargo. New truck lanes, dry ports, and digitized customs modules along this corridor are expected to cut transit times and handling costs for parcel operators. Enhanced road quality in Salta and Jujuy should boost first-mile reliability for mining-related e-commerce suppliers, while upgraded port access will allow international express shipments to bypass congestion in Buenos Aires. These incremental improvements underpin medium-term growth in the Argentina courier, express, and parcel market.
Cross-Border Trade Expansion Within Mercosur
Mercosur trade flows rebounded in 2024 as tariff-cutting measures spurred a 19.4% year-on-year jump in Argentina’s exports, with manufactured goods moving more freely to Brazil, Paraguay, and Uruguay. The December 2024 EU-Mercosur deal, once ratified, will phase out duties on more than 90% of goods, widening the addressable market for parcel firms. Argentina’s August 2024 reform halved import payment cycles, encouraging firms to restock inventories faster and rely on door-to-door courier services[3]Source: U.S. Department of Commerce, “Argentina Import Payment Timeline Reduced,” trade.gov. Regional transport associations are also lobbying to implement the TIR system across the Bioceanic route, which would standardize customs seals and documentation, further reducing border dwell times. Collectively, these initiatives add momentum to international parcels and enhance the long-term attractiveness of the Argentina courier, express, and parcel market.
Rise of Quick-Commerce (Q-Commerce) Platforms
Ultra-fast delivery startups are reshaping urban supply chains by positioning micro-fulfillment centers within five kilometers of dense residential clusters. PedidosYa already manages more than 150 dark stores across 91 Latin-American cities, enabling 10-15-minute grocery drop-offs in Buenos Aires and Córdoba. Rappi continues to mirror the model, stocking 3,000–4,000 SKUs in compact warehouses that can handle over 200 peak-hour orders. These businesses outsource upstream replenishment to specialized couriers who consolidate multiple restocks per day, stimulating a higher frequency of light-parcel movements. Real-time delivery promises have forced traditional carriers to adopt route-optimization software and invest in electric two-wheelers for traffic-dense neighborhoods. As consumers grow accustomed to minute-level delivery windows, the Argentina courier, express, and parcel market must scale differentiated service tiers that balance speed, reliability, and price.
Restraints Impact Analysis*
| Restraint | (~) % Impact on CAGR Forecast | Geographic Relevance | Impact Timeline |
|---|---|---|---|
| High inflation elevating operating costs | -1.4% | National, with acute impact on fuel and labor costs | Short term (≤ 2 years) |
| Currency volatility eroding express margins | -0.8% | National, affecting international operations and imports | Short term (≤ 2 years) |
| Shortage of skilled last-mile drivers | -0.6% | Urban centers, particularly Buenos Aires and major cities | Medium term (2-4 years) |
| Regulatory red tape at customs delaying parcels | -0.4% | National, affecting international shipments and imports | Short term (≤ 2 years) |
| Source: Mordor Intelligence | |||
High Inflation Elevating Operating Costs
Argentina’s annual inflation has remained in triple digits since 2024, driving up diesel prices and compelling couriers to re-price their services every quarter. Currency swings against the USD heighten the cost of imported vehicles, scanner hardware, and warehouse automation. However, some carriers have introduced fuel surcharges, and intense competition limits full cost pass-through to shippers. Wage demands are climbing as unions seek compensation for lost purchasing power, raising concern that labor expenses will outstrip productivity gains. To protect margins, operators are recalibrating delivery zones, consolidating pickups, and experimenting with parcel lockers in suburban districts. These defensive strategies ensure service continuity but may slow network expansion until macroeconomic stability returns.
Shortage of Skilled Last-Mile Drivers
Turnover among urban delivery drivers tops 40% per year as applicants seek higher pay in competing gig-economy roles. Courier firms face extended onboarding because regulations require drivers to master electronic proof-of-delivery tools and meet stringent safety standards[4]La Nación, “Shortage of drivers challenges Argentina logistics,” lanacion.com.ar. Peak-season hiring becomes costlier, forcing operators to offer sign-on bonuses and flexible shifts. Persistent scarcity limits the number of routes a carrier can open in newly urbanized zones, especially for time-critical services. Investments in routing algorithms and electric cargo-bike fleets partially offset the labor shortfall, yet capacity bottlenecks remain a structural restraint on the Argentina courier, express, and parcel market.
*Our forecasts treat driver/restraint impacts as directional, not additive. The impact forecasts reflect baseline growth, mix effects, and variable interactions.
Segment Analysis
By End User Industry: E-Commerce Dominates and Leads Growth
E-commerce accounted for 38.20% revenue in 2025 and is expected to grow at a 6.52% CAGR between 2026-2031, underpinned by marketplace fulfillment centers and buy-now-pay-later options adapted to local credit constraints. Manufacturing parcels benefit from export-oriented agribusiness and auto-parts clusters that use time-definite courier services for just-in-time inventory. Financial services require secure document transport and are adopting biometric verification hand-offs to reduce fraud.
Healthcare logistics will gather momentum once DHL Health Logistics deploys its planned GDP-certified pharma hub in Buenos Aires, promising temperature-controlled capacity for vaccines and biologics. Wholesale and retail trade outside e-commerce contracts conventional courier work for store replenishment and promotional campaigns, while primary industry shipments ride the commodity boom but must contend with seasonal production swings and infrastructure bottlenecks.


By Destination: International Growth Outpaces Domestic Volume
International parcels are projected to post a 6.17% CAGR between 2026-2031, even though domestic services held 64.20% of the Argentina courier, express, and parcel market share in 2025. Export earnings reached USD 79.7 billion in 2024, propelled by a 26.7% jump in shipped quantities, placing sustained pressure on integrators to expand outbound capacity. Air-express lanes connecting Buenos Aires with Miami via Santiago now operate multiple weekly frequencies, improving customs pre-clearance and delivery reliability. At the same time, simplified personal-purchase limits up to USD 3,000 per package have lifted small-parcel imports, with customs data indicating more than 150,000 courier items processed monthly in early 2025.
Domestic traffic continues to benefit from high e-commerce penetration but faces infrastructure bottlenecks on secondary roads. Even so, leading platforms employ proprietary route-planning software to maintain two-day delivery standards across the Pampas and the Paraná industrial belt. Rural areas lag behind, encouraging carriers to adopt pick-up points inside convenience stores to minimize last-mile mileage. Looking ahead, the international arena will remain the principal growth catalyst, whereas domestic revenues will depend on cost discipline amid inflationary pressures. Both segments collectively form the backbone of the Argentina courier, express, and parcel market.
By Speed of Delivery: Express Services Accelerate Despite Non-Express Dominance
Non-express options retained 75.10% of 2025 revenue, but express parcels are forecast to expand at a 6.86% CAGR between 2026-2031. Sub-48-hour delivery has become a baseline expectation in Buenos Aires and Córdoba, spurred by global integrators’ time-definite offerings and the rise of quick-commerce hubs. Carriers are upgrading sortation equipment to process higher express volumes without sacrificing accuracy, while airlines allocate more main-deck space on overnight flights.
Price-sensitive shoppers continue to opt for non-express tiers, which consolidate multiple orders and leverage truckload moves to reduce unit costs. Yet, heightened digital-payment adoption lowers failed-delivery rates, making premium express fees more palatable to affluent urban households. As a result, the express niche will capture incremental share, though large non-express volumes ensure scale economies remain intact across the Argentina courier, express, and parcel market.
By Shipment Weight: Light Weight Parcels Dominate and Drive Growth
Lightweight parcels held a 67.10% share in 2025 and are slated for a 6.58% CAGR (2026-2031) as frequent small orders replace bulk purchases. The Argentina courier, express, and parcel market size tied to light parcels thrives on duty-free treatment for shipments under USD 400, encouraging consumer cross-border shopping. Quick-commerce’s reliance on 0-5 kg packages heightens turnover and underpins network densification around dark stores.
Medium-weight parcels serve apparel returns and SME exports, while heavy parcels address industrial and project cargo, benefiting from LNG and mining investments in Patagonia. Road-weight limits, axle taxes, and river-draft issues on the Paraná corridor continue to hamper heavy-parcel reliability, prompting some shippers to shift to break-bulk ocean services or scheduled truck convoys accompanied by police escorts in sensitive areas.
By Mode of Transport: Road Dominance Despite Air Freight Expansion
Road held 60.20% revenue share in 2025, reflecting Argentina’s 18,000-mile paved network and the flexibility of door-to-door trucking. However, persistent potholes on provincial routes inflate maintenance costs and transit times. To sustain service levels, carriers deploy dual-temperature trailers and telematics for fuel-efficiency analytics. The privatization of the Paraguay-Paraná waterway could divert some heavy cargo to barges, indirectly freeing road capacity for parcel hauls.
Air freight is on pace for a 6.56% CAGR between 2026-2031 as DHL’s Miami hub expansion and FedEx’s new Buenos Aires rotation add lift for high-value goods. Dedicated freighters shorten door-to-airport clearance to under six hours, enabling next-day deliveries to North America and Europe. Rail remains peripheral due to gauge incompatibilities, yet proposed China-backed upgrades could open new long-haul options post-2030. Accordingly, the Argentina courier, express, and parcel market will keep leaning on trucks for volume but tap aviation for speed-critical lanes.
By Model: B2C Dominates and Leads Growth
B2C commanded 56.10% of the Argentina courier, express, and parcel market share in 2025, with a projected 7.18% CAGR between 2026-2031, driven by digital wallet penetration exceeding 60% of consumers. Marketplace sellers rely on courier APIs for automatic label generation and doorstep pickups, pushing daily parcel counts to record highs. The Argentina courier, express, and parcel market size attached to B2C continues to widen as merchant micro-export programs leverage simplified courier regimes for global reach.
B2B flows cover manufacturing inputs, spare parts, and wholesale replenishment, growing more slowly due to subdued industrial expansion. Still, payment-term reforms and Mercosur harmonization improve liquidity and could revive enterprise shipping by mid-decade. C2C remains a niche but benefits from recommerce trends among Gen Z buyers, though regulatory scrutiny on informal trade could restrain volumes unless platforms adopt KYC protocols.
Geography Analysis
Buenos Aires concentrates nearly one-half of the national parcel volume thanks to dense consumer clusters and a large pool of sorting hubs. Same-day coverage spans most of the metropolitan area, and private lockers now appear in subway stations to relieve last-mile congestion. Yet suburban growth strains existing cross-docks, prompting carriers to lease extra space in Pilar and La Plata industrial parks.
Northern provinces, notably Salta and Jujuy, stand to gain from the Bioceanic Corridor upgrades that will connect Atlantic and Pacific ports by 2026. Enhanced customs coordination and new dry-port facilities will shorten export lead times for lithium producers and regional agribusinesses. As these corridors mature, parcel firms can establish spoke terminals that feed nightly line-haul runs to Buenos Aires for nationwide redistribution.
Patagonia is emerging as an energy-logistics hotspot after YPF confirmed plans for a multibillion-dollar LNG terminal in Río Negro. Construction phases beginning in the next decade will galvanize demand for project-cargo shipments and specialized spare-parts lanes. Coastal provinces will also benefit as the Paraguay-Paraná waterway dredging project improves barge reliability and reduces draft-related delays. This geographic diversification ensures that future growth in the Argentina courier, express, and parcel market is not exclusively metropolitan but increasingly regional.
Competitive Landscape
The competitive arena is fragmented, with global integrators, regional specialists, and Correo Argentino vying for volume. Deregulation enacted in November 2024 removed state-postal exclusivity for some services, allowing private firms to enter segments up to 50 kg and recorded mail categories. Mercado Libre’s in-house network continues to scale but now relies on third-party carriers for overflow capacity during holiday peaks, creating partnership opportunities rather than outright displacement.
Technology spending differentiates leaders. DHL plans to roll out end-to-end visibility tools and expand temperature-controlled capacity across Latin America as part of its EUR 2 billion (USD 2.20 billion) healthcare investment. FedEx is upgrading its Buenos Aires facility to support new multi-stop rotations through Santiago and Quito that arrive at Miami in overnight cycles. UPS, meanwhile, has digitized its Argentine hub, providing labs with specimen-tracking dashboards that integrate directly into hospital systems.
Domestic players respond by electrifying last-mile fleets; TASA Logística has ordered electric vans under a government-approved import quota that grants duty concessions until 2030. Aramex expanded partnerships with regional airlines to secure block-space agreements, ensuring peak-season capacity. As a result, competition is intensifying on service reliability, technology integration, and specialized capabilities rather than on price alone, shaping a dynamic outlook for the Argentina courier, express, and parcel market.
Argentina Courier, Express, And Parcel (CEP) Industry Leaders
Correo Argentino
DHL Group
TASA Logística
OCASA
Andreani Logistica SA
- *Disclaimer: Major Players sorted in no particular order

Recent Industry Developments
- August 2025: UPS introduced UPS Healthcare® Lablink, a digital dashboard that enhances specimen tracking and self-service label printing for laboratories.
- April 2025: DHL Group committed EUR 2 billion (USD 2.20 billion) to expand global life-sciences logistics, allocating 50% to the Americas and signaling upgrades for Argentine cold-chain capacity.
- April 2025: OCASA opened a 17000 m² distribution center in Esteban Echeverria’s Parque Empresarial El Jaguel in April 2025, with operations starting in May 2025.
- November 2024: FedEx launched new flights connecting Buenos Aires, Santiago, Quito, and Miami, expanding shipping capacity between South America and the United States.


Argentina Courier, Express, And Parcel (CEP) Market Report Scope
Domestic, International are covered as segments by Destination. Express, Non-Express are covered as segments by Speed Of Delivery. Business-to-Business (B2B), Business-to-Consumer (B2C), Consumer-to-Consumer (C2C) are covered as segments by Model. Heavy Weight Shipments, Light Weight Shipments, Medium Weight Shipments are covered as segments by Shipment Weight. Air, Road, Others are covered as segments by Mode Of Transport. E-Commerce, Financial Services (BFSI), Healthcare, Manufacturing, Primary Industry, Wholesale and Retail Trade (Offline), Others are covered as segments by End User Industry.| Domestic |
| International |
| Express |
| Non-Express |
| Business-to-Business (B2B) |
| Business-to-Consumer (B2C) |
| Consumer-to-Consumer (C2C) |
| Heavy Weight Shipments |
| Light Weight Shipments |
| Medium Weight Shipments |
| Air |
| Road |
| Others |
| E-Commerce |
| Financial Services (BFSI) |
| Healthcare |
| Manufacturing |
| Primary Industry |
| Wholesale and Retail Trade (Offline) |
| Others |
| Destination | Domestic |
| International | |
| Speed of Delivery | Express |
| Non-Express | |
| Model | Business-to-Business (B2B) |
| Business-to-Consumer (B2C) | |
| Consumer-to-Consumer (C2C) | |
| Shipment Weight | Heavy Weight Shipments |
| Light Weight Shipments | |
| Medium Weight Shipments | |
| Mode of Transport | Air |
| Road | |
| Others | |
| End User Industry | E-Commerce |
| Financial Services (BFSI) | |
| Healthcare | |
| Manufacturing | |
| Primary Industry | |
| Wholesale and Retail Trade (Offline) | |
| Others |


Market Definition
- Courier, Express, and Parcel - The Courier, Express, and Parcel services, often called as CEP Market, refers to the logistics and postal service providers which specialize in moving small goods (parcels/packages). It captures the overall market size (USD) and market volume (number of parcels) of (1) the shipments/parcels/packages which are under 70kgs/ 154lbs weight, (2) Business Customer packages viz. Business-to-Business (B2B) & Business-to-Consumer (B2C) as well as private customer packages (C2C), (3) non-express parcel delivery services (Standard and Deferred) as well as express parcel delivery services (Day-Definite-Express and Time-Definite-Express), (4) domestic as well as international shipments.
- Demographics - To analyse total addressable market demand, population growth & forecasts have been studied and presented in this industry trend. It represents population distribution across categories like gender (male/female), development area (urban/rural), major cities among other key parameters like population density and final consumption expenditure (growth and share % of GDP). This data has been used for assessing the fluctations in demand & consumption expenditure, and the major hotspots (cities) of potential demand.
- Domestic Courier Market - Domestic Courier Market refers to the CEP shipments wherein the origin and destination is within the boundary of the geography studied (country or region as per the scope of report). It captures the market size (USD) and market volume (number of parcels) of (1) the shipments/parcels/packages which are under 70kgs/ 154lbs weight, including light weight shipments, medium weight shipments and heavy weight shipments (2) Business Customer packages viz. Business-to-Business (B2B) & Business-to-Consumer (B2C) as well as private customer packages (C2C), (3) non-express parcel delivery services (Standard and Deferred) as well as express parcel delivery services (Day-Definite-Express and Time-Definite-Express).
- E-Commerce - This end user industry segment captures the external (outsourced) logistics expenditure incurred by the e-tailers, through online sales channel, on Courier, Express, and Parcel (CEP) services. The scope includes (i) the supply chain of a company's online customer orders being fulfilled, (ii) the process of getting a product from the point of manufacturing to the point at which it is delivered to consumers. It involves managing inventory (deferred as well as time critical), shipping, and distribution.
- Export Trends and Import Trends - Overall logistics performance of an economy is positively and significantly (statistically) correlated to its trade performance (exports and imports). Hence, in this industry trend, total value of trade, major commodities/ commodity groups and the major trade partners, for the studied geography (country or region as per the scope of report) have been analysed alongside the impact of major trade/logistics infrastructure investments & regulatory environment.
- Financial Services (BFSI) - This end user industry segment captures the external (outsourced) logistics expenditure incurred by the BFSI players, on Courier, Express, and Parcel (CEP) services. CEP is important to the financial services industry in shipping of confidential documents and files. The establishments in this sector are engaged in (i) financial transactions (that is, transactions involving the creation, liquidation, or change in ownership of financial assets) or in facilitating financial transactions, (ii) financial intermediation, (iii) the pooling of risk by underwriting annuities and insurance, (iv) providing specialized services that facilitate or support financial intermediation, insurance and employee benefit programs, and (v) monetary control - the monetary authorities.
- Fuel Price - Fuel price spikes can cause delays and diruption for logistics service providers (LSPs), while drops in the same can result in higher short-term profitability and increased market rivalry to offer consumers with the best deals. Hence, the fuel price variations have been studied over the review period and presented along with the causes as well as market impacts.
- GDP Distribution by Economic Activity - Nominal Gross Domestic Product and distribution of the same, across major economic sectors in the geography studied (country or region as per scope of the report) have been studied and presented in this industry trend. As GDP is positively related to the profitability and growth of logistics industry, this data has been used in adjunction to the input-output tables/ supply-use tables for analyzing the potential major contributing sectors towards the logistics demand.
- GDP Growth by Economic Activity - Growth of Nominal Gross Domestic Product across major economic sectors, for the geography studied (country or region as per scope of the report) have been presented in this industry trend. This data has been utilized for assessing the growth of logistics demand from all the market end users (economic sectors considered here).
- Healthcare - This end user industry segment captures the external (outsourced) logistics expenditure incurred by the Healthcare players (Hospitals, clinics, mrdical centres) , on Courier, Express, and Parcel (CEP) services. The scope includes CEP services involved in the defrerred as well time critical movement of medical goods & supplies (surgical supplies and instruments, including gloves, masks, syringes, equipment). The establishments in this sector (i) include the ones providing medical care exclusively (ii) deliver services by trained professionals (iii) involve processes, including labor inputs of health practitioners with the requisite expertise (iv) are defined based on the educational degree held by the practitioners included in the industry.
- Inflation - Variations in both Wholesale Price Inflation (YoY change in producer price index) and Consumer Price Inflation have been presented in this industry trend. This data has been used to assess the inflationary environment as it plays a vital role in smooth functioning of the supply chain, directly impacting the logistics operational cost components e.g., pricing of tyres, driver wages & benefits, energy/fuel prices, maintenace costs, toll charges, warehousing rents, custom brokerage, forwarding rates, courier rates etc. hence impacting the overall freight and logistics market.
- Infrastructure - As infrastructure plays a vital role in an economy's logistics performance, variables like length of roads, distribution of road length by surface category (paved v/s unpaved), distribution of road length by road classification (expressways v/s highways v/s other roads), rail length, volume of containers handled by major ports and tonnage handled by major airports have been analysed and presented in this industry trend.
- International Express Service Market - International Express Service Market refers to the CEP shipments wherein the origin or destination is not within the boundary of the geography studied (country or region as per the scope of report). It captures the market size (USD) and market volume (number of parcels) of (1) the shipments/parcels/packages which are under 70kgs/ 154lbs weight, including light weight shipments, medium weight shipments and heavy weight shipments (ii) Inter-Region as well as Intra-Region Shipments
- Key Industry Trends - The report section named "Key Industry Trends" include all the key variables/parameters studied to better analyze the market size estimates and forecasts. All the trends have been presented in the form of data points (time series or latest available data points) along with analysis of the paramter in the form of concise market relevant commentary, for the geography studied (country or region as per the scope of report).
- Key Strategic Moves - The action taken by a company to differentiate from its competitor or used as a general strategy is referred to as a key strategic move (KSM). This includes (1) Agreements (2) Expansions (3) Financial Restructuring (4) Mergers and Acquisitions (5) Partnerships, and (6) Product Innovations. Key players (Logistics Service Providers, LSPs) in the market have been shortlisted, their KSM have been studied and presented in this section.
- Logistics Performance - Logistics Performance and Logistics Costs are the backbone of trade, and influences trade costs, making countries compete globally. Logistics performance is influenced by market wide adopted supply chain management strategies, government services, investments & policies, fuel/ energy costs, inflationary environment etc. Hence, in this industry trend, the logistics performance of the geography studied (country/ region as per the scope of report) has been analysed and presented over the review period.
- Manufacturing - This end user industry segment captures the external (outsourced) logistics expenditure incurred by the Manufacturing industry (including Hi-Tech/Technology) players, on Courier, Express, and Parcel (CEP) services. The end user players considered are the establishments primarily engaged in the chemical, mechanical or physical transformation of materials or substances into new products. Logistics Service Providers (LSPs) play a crucial role in maintaining a smooth flow of raw materials across the supply chain, enabling timely delivery of finished goods to distributors or end customers and storing & supplying the raw materials to clients for just-in-time manufacturing.
- Other End Users - Other end user segment captures the external (outsourced) logistics expenditure incurred by the construction, real estate, educational services, and professional services (administrative, waste management, legal, architectural, engineering, design, consulting, scientific R&D), on Courier, Express, and Parcel (CEP) services. Logistics Service Providers (LSPs) plays a crucial role in the reliable movement of time critical supplies and documents to/from these industries such as transporting any equipment or resources required, shipping confidential documents and files.
- Primary Industry - This end user industry segment captures the external (outsourced) logistics expenditure incurred by the AFF (Agriculture, Fishing, and Forestry) and Extraction indsutry (Oil &Gas, Quarrying and Mining) players, on Courier, Express, and Parcel (CEP) services. The end user players considered are the establishments (i) primarily engaged in growing crops, raising animals, harvesting timber, harvesting fish & other animals from their natural habitats and providing related support activities; (ii) that extract naturally occurring mineral solids, such as coal and ores; liquid minerals, such as crude petroleum; and gases, such as natural gas. Herein, Logistics Service Providers (LSPs) (i) play a crucial role in acquisition, storage, handling, transportation, and distribution activities for the optimal & continuous flow of inputs (seeds, pesticides, fertilizers, equipment, and water) from manufacturers or suppliers to the producers and smooth flow of output (produce, agro-goods) to distributors/ consumers; (ii) cover entire phases from upstream to downstream and play a crucial role in the transportation of machinery, drilling equipments, extracted minerals, crude oil & natural gas and refined/ processed products from one place to another. This includes both termperature controlled and non-temperature controlled logistics, as and when required according to the shelf life of goods being transported or stored.
- Producer Price Inflation - It indicates inflation from viewpoint of the producers viz. the average selling price received for their output over a period of time. Annual change (YoY) of producer price index is reported as wholesale price inflation in the "Inflation" industry trend. As WPI captures dynamic price movements in most comprehensive way, it is widely used by governments, banks, industry, business circles and is deemed important in formulation of trade, fiscal and other economic policies. The data has been used in adjunction to consumer price inflation for better understanding the inflationary environment.
- Segmental Revenue - Segmental Revenue has been triangulated or computed and presented for all the major players in the market. It refers to the courier, express, and parcel (CEP) market specific revenue earned by the company, over the base year of study, in the geography studied (country or region as per the scope of report). It is computed through the study and analysis of major parameters like financials, service portfolio, employee strength, fleet size, investments, number of countries present in, major economies of concern, etc. that have been reported by the company in its annual reports, webpage. For companies having scarce financial disclosures, paid databases like D&B Hoovers, Dow Jones Factiva have been resorted to and verified through industry/expert interactions.
- Transport and Storage Sector GDP - Value and growth of Transport and Storage Sector GDP has a direct relation to the freight and logistics market size. Hence, this variable has been studied and presented over the review period, in value terms (USD) and as share % of total GDP, in this industry trend. The data has been supported by concise and relevant commentary around the investments, developments, and current market scenario.
- Trends in E-Commerce Industry - Enhanced internet connectivity and boom in smartphone penetration, coupled with increasing disposable incomes, has led to a phenomenal growth in the e-commerce market globally. Online shoppers require fast and efficient delivery of their orders leading to an increase in the demand for logistics services especially e-commerce fulfilment services. Hence, the Gross Merchandise Value (GMV), historial and projected growth, breakup of major commodity groups in e-commerce industry for the studied geography (country or region as per scope of the report) have been analysed and presented in this industry trend.
- Trends in Manufacturing Industry - Manufacturing industry involves the transformation of raw materials into finished products, while logistics industry ensures the efficient flow of raw materials to the factory, and the transport of manufactured products to the distributors & consumers. Demand-Supply of both industries are highly cross-linked and critical for a seamless supply chain. Hence, the Gross Value Added (GVA), breakup of GVA into major manufacturing sectors, and growth of manufacturing industry over the review period have been analysed and presented, in this industry trend.
- Wholesale and Retail Trade (Offline) - This end user industry segment captures the external (outsourced) logistics expenditure incurred by the wholesalers and retailers, through offline sales channel, on Courier, Express, and Parcel (CEP) services. The end user players considered are the establishments primarily engaged in wholesaling or retailing merchandise, generally without transformation, and rendering services incidental to the sale of merchandise. Logistics Service Providers (LSPs) plays a crucial role in the reliable movement of supplies to and finished products from production houses to the distributors and finally to the end customer covering activites like material sourcing, transportation, order fulfillment, warehousing & storage, demand forecasting, inventory management etc.
| Keyword | Definition |
|---|---|
| Axle Load | The axle load refers to the total load (weight) bearing on the roadway through wheels connected to a given axle. Across the globe, there are systems in place to ensure axle load monitoring, wherein surpassing the defined limits set by the concerned regulatory authority can lead to penalty/fine. For transportation of goods via road this can be an important determinant of costs as knowledge about the axle load limits can be used to (i) load the vehicle optimally for maximizing profits (ii) avoid exceeding the same and hence the probable fines associated (iii) avoid wear and tear of the vehicle (iv) avoid damage to pavement resulting in noticeable public maintenance and repair costs (v) achieve better turnaround time. |
| Back Haul | Backhaul is the return movement of a transport vehicle from its original destination to its original point of departure, and can include full, partial, or empty truck loads (all or part of the way) depending on the visibility of the local freight ecosystem. In this regard, transportation of empty containers to the point of origin, known as deadheading is also a significant factor, considering the supply/container shortages across the geographies, resulting in cost escalation and under optimized profit potential attainment. Generally, the carriers offer discounts on the backhaul, to secure freight for the trip. |
| Bill of Lading (BOL) | A bill of lading is a legal contract document issued by a carrier to a shipper to acknowledge reception of their cargo, and is evidence for the contract of carriage between the two parties. Broadly it details the (i) type, quantity, and other specifications of the goods being carried (ii) destination, and terms & conditions of the shipment (iii) carrier and drivers with all the necessary information to process the shipment, which can be used for insurance and customs clearance purposes (iv) assurance that the consignment is damage-free and ready to be shipped to the consignee. In this regard, a house bill of lading (HBL) is a document issued by a freight forwarder or a non-vessel operating common carrier (NVOCC) to acknowledge receipt of items for shipment (to a shipper). If shipments from several shippers are involved a master bill of lading (MBL) might be involved which is a consolidated version of the same for all the shipments being taken care of by the carrier (to a common destination) and might be issued by the carrier to the freight forwarder or the shipper (depending on who books the transport). |
| Bunkering | Bunkering is the process of supplying fuel to power the propulsion system of a ship. It includes the logistics of loading and distributing the fuel among available shipboard tanks. In this regard, (i) Bunker fuel is technically any type of fuel oil used aboard ships. It gets its name from the containers on ships and in ports that it is stored in; in the days of steam they were coal bunkers but now they are bunker-fuel tanks, (ii) Bunker refers to the spaces (Tank) on board a vessel to store fuel, (iii) Bunker trader refers to a person dealing in trade of bunker (fuel), (iv) Bunker call is made when a cargo ship anchors or berths in a port to take on bunker oil or supplies, (v) Bunkering service is the supply of a requested quality and quantity of bunkers to a ship. Bunkering is signficant from point of view of freight rates applicable to the shipper as Bunker Contribution (BUC)/ Fuel Adjustment Factor (FAF)/ Bunker Adjustment Factor (BAF) are applied by shipping lines to offset the effect of fluctuations in the cost of bunkers. |
| Cabotage | Transport by a vehicle registered in a country, performed on the national territory of another country. Cabotage law may restrict domestic cargo traffic to be carried in its own nationally registered, and sometimes built and crewed vehicles, though regulations vary across industries/commodity groups/countries and sometimes specify maximum allowable percentage of cabotage that can be serviced by foreign registered fleet. |
| C-commerce | Collaborative commerce (also known as C-commerce), (i) describes electronically enabled business interactions among an enterprise’s internal personnel, business partners and customers throughout a trading community (industry, industry segment, supply chain or supply chain segment); (ii) is the optimization of supply and distribution channels to capitalize on the global economy by using new technology efficiently. Advantages of C-commerce, to detail few include (i) maximization of organization's efficiency and profitability (ii) technology integration with physical channels to allow companies to work together (iii) increased information exchange such as inventory and product specifications, using the web as an intermediary (iv) increased competitiveness by reaching a broader audience. Examples of C-commerce, also known as peer-to-peer commerce, include (i) companies that allow consumers to rent things from each other, or marketplaces, such as Meta (formerly Facebook) Marketplace, that allow the sale of used goods; (ii) DoorDash teamed up with many national brands, such as McDonald’s and Chipotle, to offer fast food delivery, building their business model on c-commerce. They have since expanded their delivery service from restaurants to retailers and even offer 'fleets' of drivers to businesses. |
| Courier | A business/company that delivers packages/parcels/shipments (upto 70 kgs) including quick door to door pickup and delivery service for goods or documents, domestically or internationally, on a commercial contract basis. Example, DHL Group, FedEx, United Parcel Service of America, Inc., USPS, International Distributions Services, J&T Express, SF Express among several others |
| Cross docking | Cross docking is a practice in logistics management that includes unloading incoming delivery vehicles and loading the materials directly into outbound delivery vehicles, omitting traditional warehouse logistical practices and saving time and money. It requires close synchronization of both inbound and outbound movements. It is highly significant in reduction of costs pertaining to warehousing & storage (and the associated Value Added Services). |
| Cross Trade | International transport between two different countries performed by a vehicle registered in a third country. A third country is a country other than the country of loading/embarkation and the country of unloading/disembarkation. Cross Trade law may restrict international cargo traffic to be carried by respective country's registered vehicles, and sometimes built and crewed vehicles, though regulations vary across industries/commodity groups/countries and sometimes specify maximum allowable percentage of cross trade that can be serviced by foreign registered fleet. |
| Customs Clearance | The process of declaring and clearing cargoes through customs. It includes the procedures involved in getting cargo released by Customs through designated formalities such as presenting import license/permit, payment of import duties and other required documentations by the nature of the cargo. In this regard, a customs broker is a person or company licensed by the respective department of the country to act on behalf of freight importers and exporters. |
| Dangerous Goods | Dangerous goods (or hazardous materials or HAZMAT) include flammable liquids/solids, gases (compressed, liquified, dissolved under pressure), corrosives, oxidising substances, explosive substances and articles, substances which on contact with water emit flammable gasses, organic peroxides, toxic substances, infectious substances, radioactive materials, miscellaneous dangerous goods and articles. |
| First mile Delivery | First mile delivery refers to the (i) first stage of the freight/shipment/cargo/courier transportation (ii) the transportation of goods from a merchant’s premises or warehouse to the next fulfillment centre/warehouse/hub from where the goods are forwarded (iii) shipping goods from local distribution centers to stores (For retailers) (iv) transportation of finished goods from a plant or a factory to a distribution center (For manufacturers), (v) pick up of goods from the end-customer’s home or store followed by movement to a warehouse or storage location (movers and packers), (vi) process where goods are picked up from a retailer and then transferred to third-party logistics providers or courier service providers to be delivered to the end-consumer (e-commerce). Once the package reaches the next warehouse or the courier’s hub, it is then sorted and transported further until it reaches the customer’s doorstep. Example, if one chooses UPS as a courier, first-mile delivery will be the product being delivered from manufacturer's/retailer's warehouse to the UPS’s warehouse/ fulfilment centre. |
| Last Mile Delivery | Last mile delivery refers to the very last step of the delivery process when a parcel is moved from a transportation hub (warehouse or a distribution center or fulfillment centre) to its final destination, which usually is a personal residence/retail store/ business, or parcel locker. It accounts for around half of the total cost involved in entire process of first mile, middle mile, and last mile delivery, though it can vary shipment to shipment, based on commodity, business model and similar factors. |
| Milkrun | A Milk Run is a delivery method used to transport mixed loads from various suppliers to one customer, using lean management principles applied to logistics. Instead of each supplier sending a truck every week to meet the needs of one customer, one truck (or vehicle) visits the suppliers to pick up the loads for that customer. This method of transport got its name from the dairy industry practice, where one tanker used to collect milk from several dairy farms for delivery to a milk processing company. A milk run can be a more efficient way to handle logistics but require proper planning. If the route involves products from different companies, there is need for an agreement about cost-sharing and other aspects of the cooperative delivery arrangement. Once the group settles these issues, this delivery method can save time and money for everyone by pooling operation costs and resources. |
| Multi country consolidation | Multi-Country Consolidation (MCC) is a cost-effective solution that consolidates one's cargo from different countries of origin to build Full Container Loads (FCL). MCC is most suitable for companies that import light volumes of goods from multiple countries but want to take advantage of the more economic FCL freight rates. Apart from costing some of the other advantages include (i) flexibility to choose suppliers from a wider range of origin countries without worrying about the logistics to final destination from each origin, (ii) ability to pick the most suitable suppliers from many different countries for one's business operations. The increase in one's sourcing options by MCC provides the kind of flexibility needed in competitive global markets. |
| Q-commerce | Q-commerce, also referred to as quick commerce, is a type of e-commerce where emphasis is on quick deliveries, typically in less than an hour. The companies providing Q-Commerce services might have vertically intergrated model or might be using third party delivery platforms (outsourced logistics). It has advantages like (i) competitve USP, (ii) potential to earn greater profit margins, (iii) better customer experience, (iv) guaranteed availability of products, (v) traceability, and (vi) scaleability. |
| ReverseLogistics | Reverse logistics is a type of supply chain management that moves goods from customers back to the sellers or manufacturers and may involve ciruclar economy principles (3Rs) viz. recycling, reuse (repurposing, reselling), reducing or repairing. In this regard, reverse commerce (or Recommerce) is the selling of previously owned items through physical or online marketplaces/distribution channels to buyers who reuse, recycle or resell them. |


Research Methodology
Mordor Intelligence follows a four-step methodology in all our reports.
- Step-1: Identify Key Variables: In order to build a robust forecasting methodology, the variables and factors identified in Step-1 are tested against available historical market numbers. Through an iterative process, the variables required for market forecast are set and the model is built on the basis of these variables.
- Step-2: Build a Market Model: Market-size estimations for the forecast years are in nominal terms. Inflation is considered to be a part of the pricing, and the average selling price (ASP) is varying throughout the forecast period for each country
- Step-3: Validate and Finalize: In this important step, all market numbers, variables and analyst calls are validated through an extensive network of primary research experts from the market studied. The respondents are selected across levels and functions to generate a holistic picture of the market studied.
- Step-4: Research Outputs: Syndicated Reports, Custom Consulting Assignments, Databases & Subscription Platforms


