Omega-3 PUFA 市场规模

| 研究期 | 2019 - 2029 |
| 估计的基准年 | 2023 |
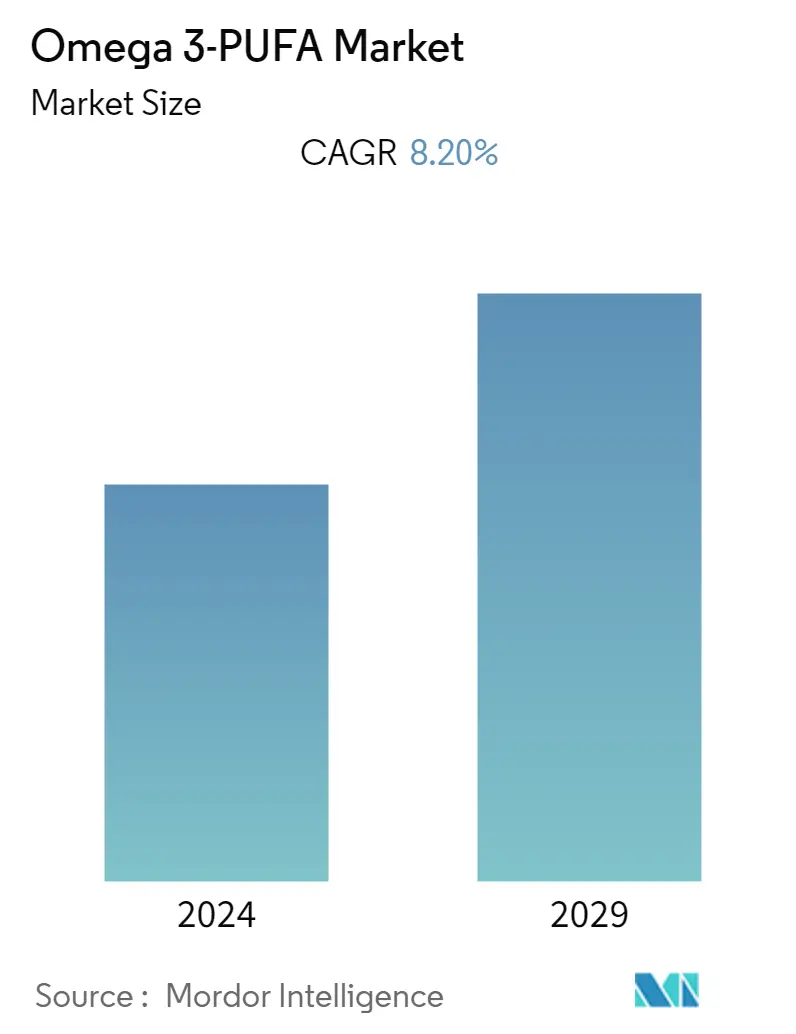
| CAGR | 8.20 % |
| 增长最快的市场 | 亚太地区 |
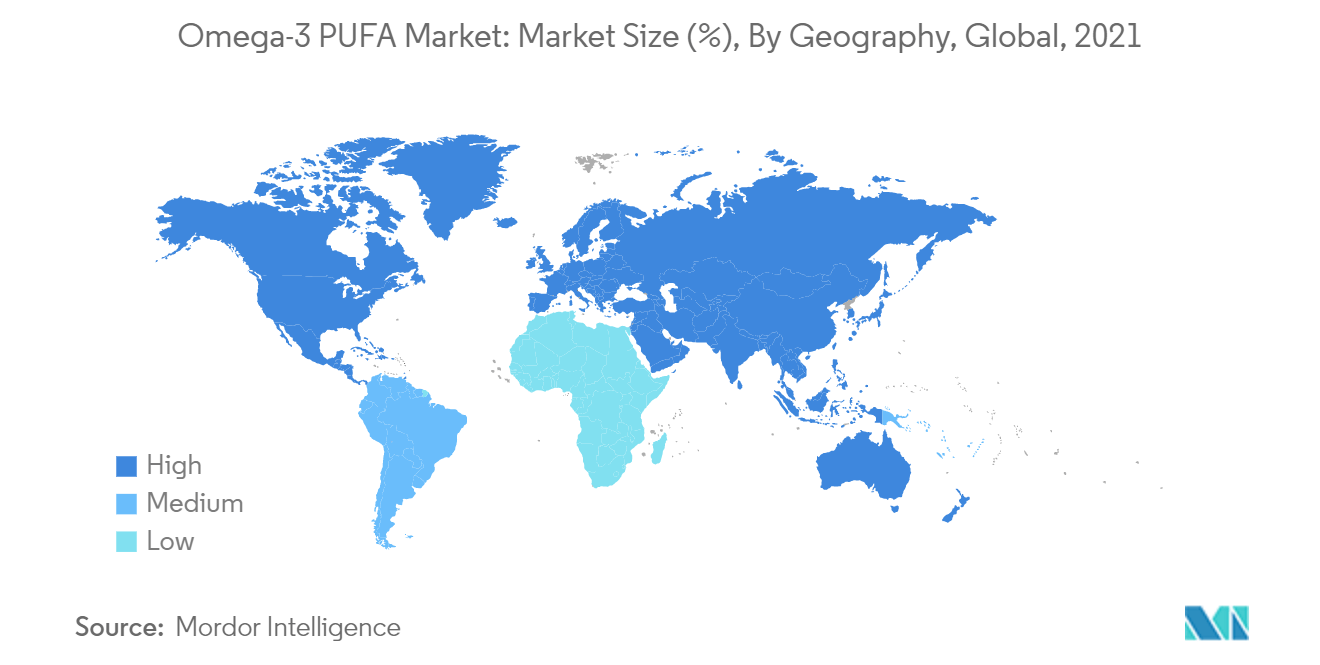
| 最大的市场 | 北美 |
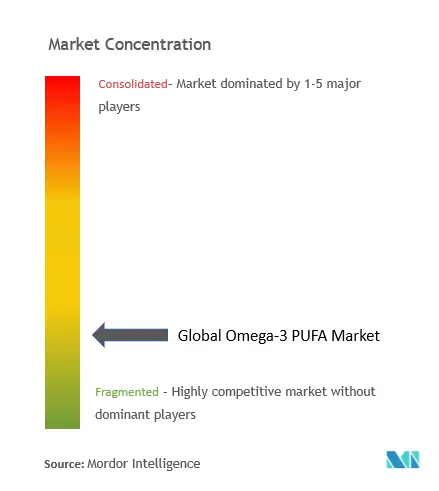
| 市场集中度 | 低的 |
主要参与者
*免责声明:主要玩家排序不分先后 |
我们可以帮忙吗?
Omega-3 PUFA 市场分析
在预测期内(2022-2027 年),全球 omega-3 PUFA 市场的复合年增长率为 8.2%。
COVID-19 对 omega-3 PUFA 市场产生了重大影响。疫情期间,消费者的购买模式发生了变化。这是因为消费者对健康、营养食品的兴趣提高。含有omega-3 PUFA的产品受到消费者的青睐,因为食用此类产品有助于改善身心健康。例如,该行业的主要参与者之一阿彻丹尼尔斯米德兰公司(Archer Daniels Midland Company)预计2021财年第一季度的增长率为76%。
消费者对 omega-3 PUFA 健康益处的认识不断提高等因素推动了市场增长。由于人们采取预防性医疗措施的比例不断增加,该行业也变得越来越重要,并成为消费者日常饮食的一部分。
omega-3 PUFA 在工业领域的应用不断增加,最终推动了全球市场的增长。因此,随着消费者意识到自己的健康,大多数消费者更喜欢含有omega-3的产品作为他们的基本需求补充剂。
Omega-3 PUFA 市场趋势
对含有 EPA 的食品的需求不断增加
消费者对二十碳五烯酸的需求正在上升,二十碳五烯酸是几种 omega-3 脂肪酸之一。这是因为 EPA 可以帮助预防和逆转心脏病,食用这些产品可以帮助减少心律不齐,包括炎症、外周动脉疾病、主要冠状动脉事件和抗凝。因此,消费者对更健康生活方式的意识最终将拉动这一特定市场的人均支出。一些最常见的含有二十碳五烯酸的食物是冷水鱼、坚果、种子和植物油。 EPA 带来的健康益处受到全球消费者的青睐。因此,这个因素正在极大地推动市场。。
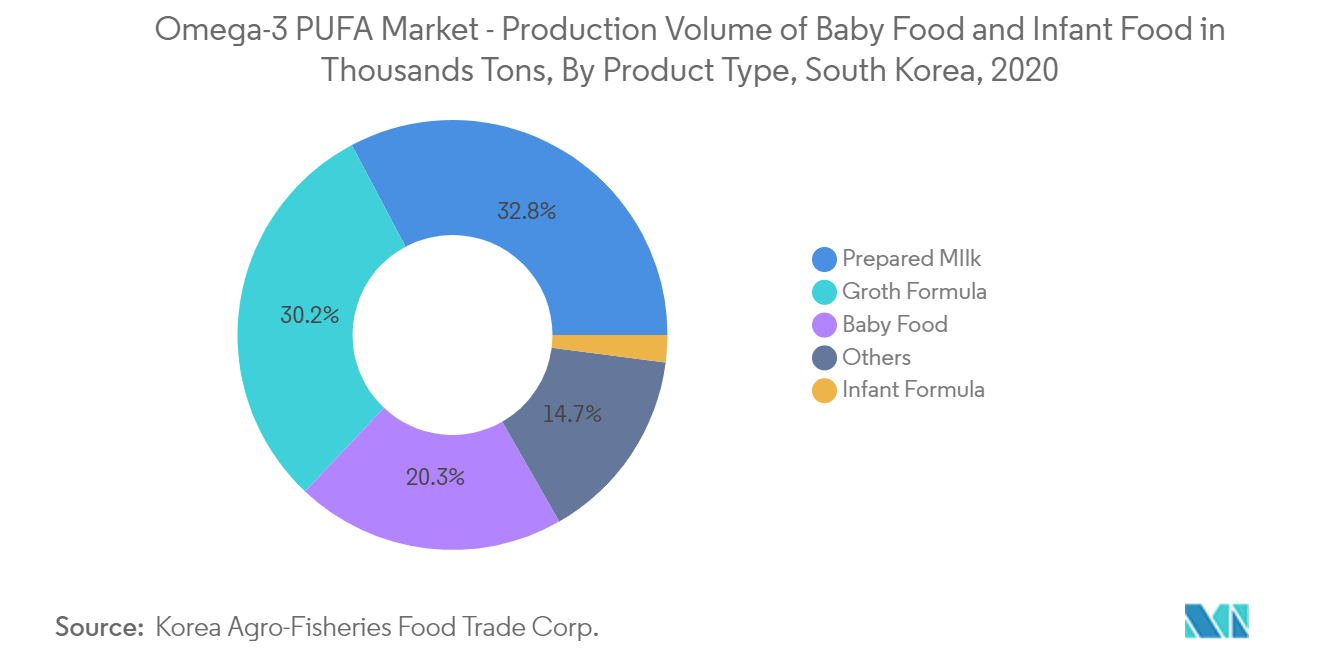
亚太地区是增长最快的市场
亚太地区是 omega-3 成分市场增长最快的地区,主要市场在中国和日本。中国是最大的市场,其次是日本和澳大利亚。强大的制造基础、不断增加的中产阶级人口、可支配收入和健康意识正在推动Omega 3 PUFA市场的发展,尤其是中国EPA和DHA成分的消费。中国的高出生率和最近取消一胎政策预计将刺激婴儿营养配方奶粉中基于 DHA 成分的需求。婴儿配方奶粉和膳食补充剂是中国EPA和DHA市场的两个主要应用领域。随着可自由支配支出的增加,中国市场的膳食补充剂行业预计将成为 EPA 和 DHA 成分利润丰厚的应用领域。
Omega-3 PUFA 行业概览
研究的市场本质上是竞争性的。这是因为该领域有众多国内外参与者。该行业的一些主要参与者包括 Croda International Plc、Archer Daniels Midland Company、Corbion NV、BASF SE 和 Cargill, Incorporated。主要参与者主要专注于产品开发和产品创新,通过提供多样化的口味和产品质量来满足消费者的需求,以保持高端化。一些主要参与者将并购作为其关键战略。
Omega-3 PUFA 市场领导者
-
Cargill, Incorporated
-
BASF SE
-
Corbion NV
-
Archer Daniels Midland Company
-
Croda International Plc
*免责声明:主要玩家排序不分先后
Omega-3 PUFA 市场新闻
- 2021 年,嘉吉公司收购了 Croda 的生物基工业业务。收购 Croda 技术和化学业务背后的关键战略将有助于开发新产品,这将有利于满足全球消费者的不同需求,因为该公司可以使用不同的技术提供多种创新的 omega-3 PUFA 补充剂对于消费者来说,它将在业务扩张中发挥重要作用。
- 2021 年,Pharma Marine 与 GEA 合作,GEA 是食品和饮料行业知名且活跃的成员。此次合作背后的战略是扩大挪威西海岸的鱼油产量。
Omega-3 PUFA 市场报告 - 目录
1. 介绍
1.1 研究假设和市场定义
1.2 研究范围
2. 研究方法论
3. 执行摘要
4. 市场动态
4.1 市场驱动因素
4.2 市场限制
4.3 波特五力分析
4.3.1 新进入者的威胁
4.3.2 买家/消费者的议价能力
4.3.3 供应商的议价能力
4.3.4 替代产品的威胁
4.3.5 竞争激烈程度
5. 市场细分
5.1 按来源
5.1.1 植物
5.1.2 海洋
5.2 按类型
5.2.1 二十二碳六酸 (DHA)
5.2.2 二十碳五酸 (EPA)
5.2.3 α-亚麻酸 (ALA)
5.2.4 其他的
5.3 按浓度
5.3.1 高浓度
5.3.2 中浓度
5.3.3 低浓度
5.4 按申请
5.4.1 食品和饮料
5.4.1.1 功能性食品和饮料
5.4.1.2 婴幼儿配方奶粉
5.4.2 膳食补充剂
5.4.3 药品
5.4.4 动物营养
5.5 地理
5.5.1 北美
5.5.1.1 美国
5.5.1.2 加拿大
5.5.1.3 墨西哥
5.5.1.4 北美其他地区
5.5.2 欧洲
5.5.2.1 西班牙
5.5.2.2 英国
5.5.2.3 德国
5.5.2.4 法国
5.5.2.5 意大利
5.5.2.6 俄罗斯
5.5.2.7 欧洲其他地区
5.5.3 亚太
5.5.3.1 中国
5.5.3.2 日本
5.5.3.3 印度
5.5.3.4 澳大利亚
5.5.3.5 亚太其他地区
5.5.4 南美洲
5.5.4.1 巴西
5.5.4.2 阿根廷
5.5.4.3 南美洲其他地区
5.5.5 中东和非洲
5.5.5.1 南非
5.5.5.2 沙特阿拉伯
5.5.5.3 中东和非洲其他地区
6. 竞争格局
6.1 最活跃的公司
6.2 最常用的策略
6.3 市场份额分析
6.4 公司简介
6.4.1 Cargill, Incorporated
6.4.2 BASF SE
6.4.3 Corbion NV
6.4.4 Archer Daniels Midland Company
6.4.5 Croda International Plc
6.4.6 Omega Protein Corporation
6.4.7 Pharma Marine
6.4.8 Stepan company
6.4.9 Novotech Nutraceuticals Inc
6.4.10 Clover Corporation Ltd
7. 市场机会和未来趋势
8. COVID-19 对市场的影响
Omega-3 PUFA 行业细分
全球 omega-3 PUFA 市场按来源分为植物来源和海洋来源;按类型分为二十二碳六烯酸 (DHA)、二十碳五烯酸 (EPA)、α-亚麻酸 (ALA) 等。按集中度划分,市场分为高集中度、中集中度和低集中度;并应用于食品和饮料、膳食补充剂、药品和动物饲料。该市场还按地理位置细分为北美、欧洲、亚太地区、南美以及中东和非洲。该报告提供了上述所有细分市场的市场规模和有机食品和饮料市场价值(百万美元)的预测。
| 按来源 | ||
| ||
|
| 按类型 | ||
| ||
| ||
| ||
|
| 按浓度 | ||
| ||
| ||
|
| 按申请 | ||||||
| ||||||
| ||||||
| ||||||
|
| 地理 | ||||||||||||||||
| ||||||||||||||||
| ||||||||||||||||
| ||||||||||||||||
| ||||||||||||||||
|
Omega-3 PUFA 市场研究常见问题解答
目前 Omega 3-PUFA 市场规模有多大?
Omega 3-PUFA 市场预计在预测期内(2024-2029 年)复合年增长率为 8.20%
谁是 Omega 3-PUFA 市场的主要参与者?
Cargill, Incorporated、BASF SE、Corbion NV、Archer Daniels Midland Company、Croda International Plc 是 Omega 3-PUFA 市场运营的主要公司。
Omega 3-PUFA 市场增长最快的地区是哪个?
预计亚太地区在预测期内(2024-2029 年)复合年增长率最高。
哪个地区在 Omega 3-PUFA 市场中占有最大份额?
2024年,北美在Omega 3-PUFA市场中占据最大的市场份额。
这个 Omega 3-PUFA 市场涵盖哪些年份?
该报告涵盖了 2019 年、2020 年、2021 年、2022 年和 2023 年的 Omega 3-PUFA 市场历史市场规模。该报告还预测了 2024 年、2025 年、2026 年、2027 年、2028 年和 2029 年的 Omega 3-PUFA 市场规模。。
Omega 3-PUFA 行业报告
Mordor Intelligence™ 行业报告创建的 2024 年 Omega 3-PUFA 市场份额、规模和收入增长率统计数据。 Omega 3-PUFA 分析包括 2029 年的市场预测展望和历史概述。获取此行业分析的样本(免费下载 PDF 报告)。

