MEA 植物生长调节剂市场规模

| 研究期 | 2019 - 2029 |
| 估计的基准年 | 2023 |
| 预测数据期 | 2024 - 2029 |
| 历史数据期 | 2019 - 2022 |
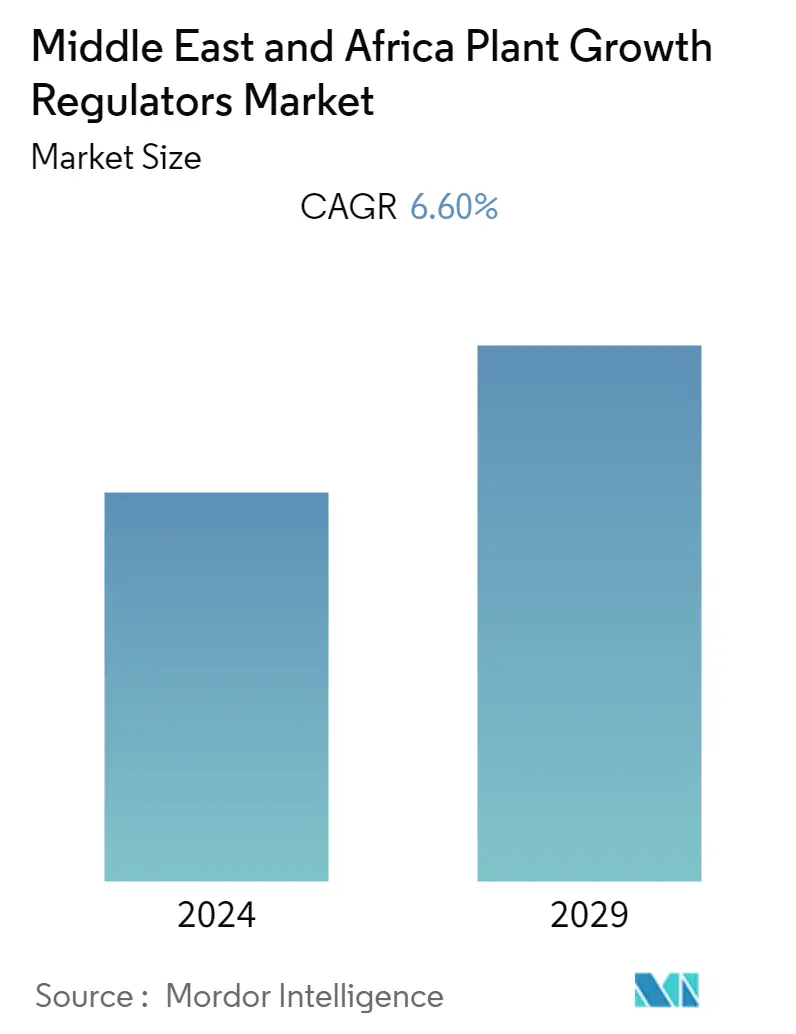
| CAGR | 6.60 % |
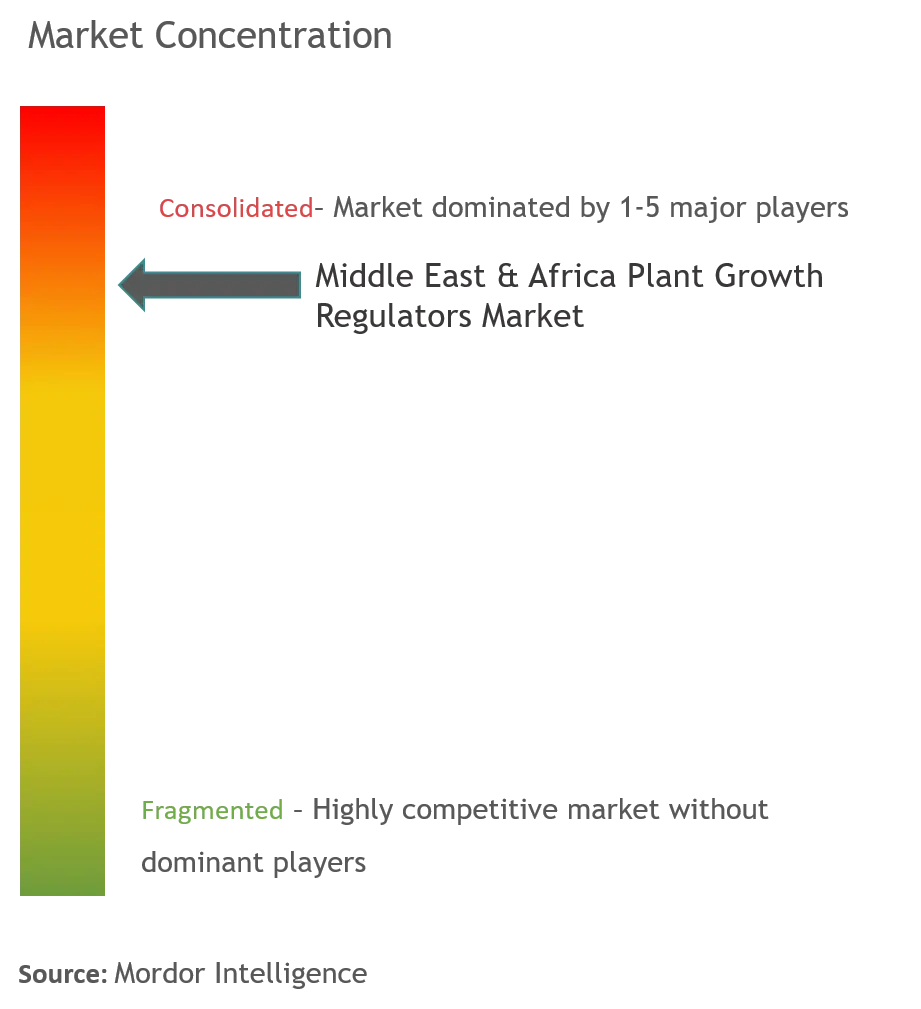
| 市场集中度 | 高的 |
主要参与者
*免责声明:主要玩家排序不分先后 |
我们可以帮忙吗?
MEA植物生长调节剂市场分析
中东和非洲植物生长调节剂市场预计在预测期内(2020-2025年)复合年增长率为6.6%。
- 埃及和南非对水果的需求不断增加,植物生长调节剂(PGR)在水果作物上的应用不断增加。同样,在非洲,植物生长调节剂大量用于蔬菜,如土豆、西红柿和洋葱。在土耳其,通过应用植物生长调节剂,水果的品质得以提高,例如苹果、梨和桃子。
- 南非预计将成为预测期内非洲增长最快的植物遗传资源市场。推动南非市场增长的主要因素是葡萄、香蕉等水果消费的增加以及农民收入的增加。此外,该国水果种植面积的增加也推动了市场的发展,预计在预测期内也会出现同样的趋势。
MEA植物生长调节剂市场趋势
对可持续农业实践的需求不断增加
农业在非洲经济发展中发挥着至关重要的作用。然而,该行业的表现低于其潜力。目前,非洲约有60%的人口依赖农业为生,但2017年该部门对GDP的贡献仅为21%。而非洲的未开垦耕地面积是世界上最高的,2016年接近2.02亿公顷,其生产力远远落后于其他发展中地区。此外,农作物产量仅达到国际平均水平的56%。植物生长调节剂的应用可能有助于提高开花率、刺激植物生长、延迟块根作物发芽等。因此,该地区对大田作物的需求不断增长,加上与棉花作物有关的植物生长调节剂产品组合的不断创新,为进一步渗透到大田作物中提供了机会。
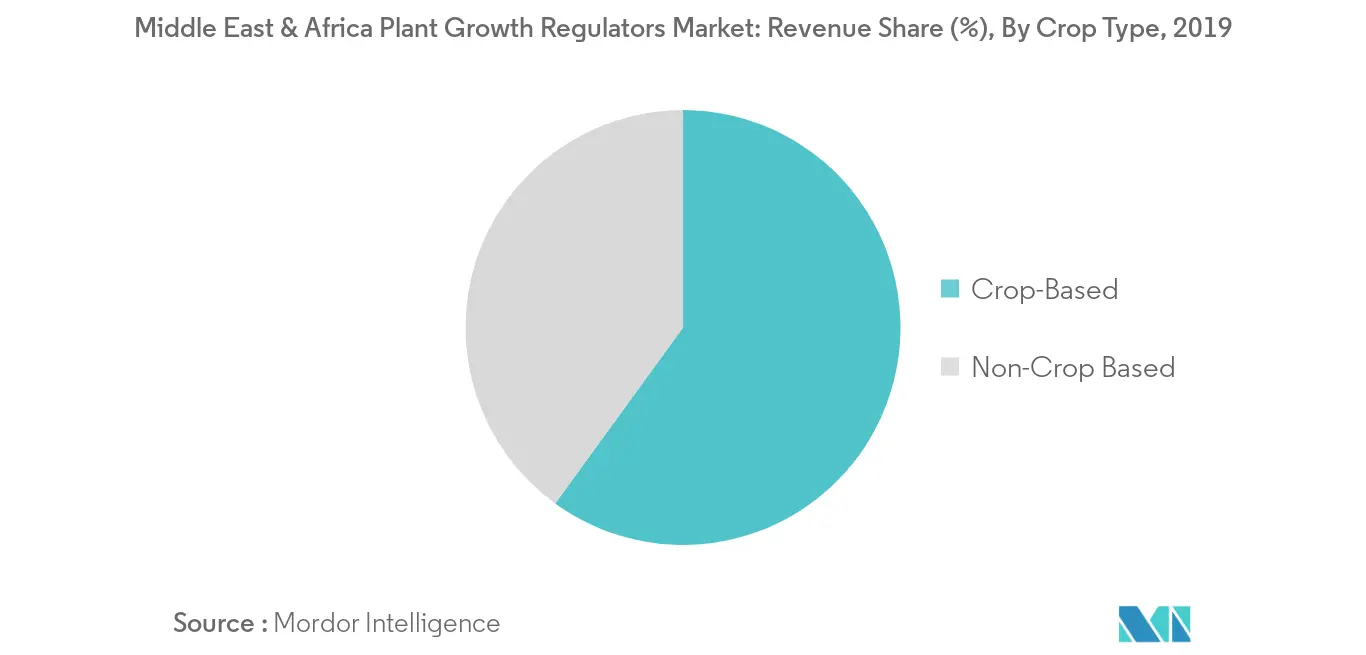
农作物植物生长调节剂占有显着份额
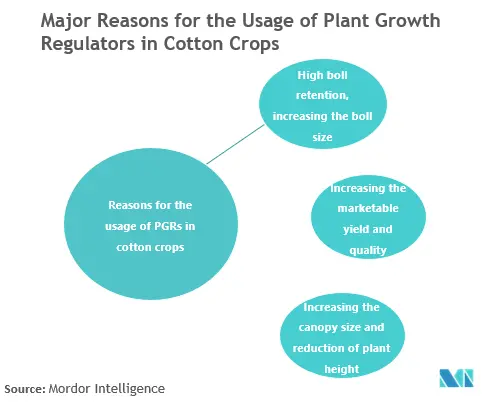
植物生长调节剂用于特定作物,例如水果和谷物。南非的主要水果生产是柑橘、香蕉、芒果、荔枝和葡萄。超过40%的农产品出口包括水果,水果是南非国内利润(GDP)增长的主要贡献者,占南非GDP的2.5%。非洲植物生长调节剂市场需求以南非和埃及等农业国家为主导。谷物和油籽是植物生长调节剂的主要消费者,其次是水果和蔬菜。南非对植物生长激素的需求很高,因为它们广泛用于香蕉作物。在香蕉上使用植物生长调节剂的三个主要原因是提高采后增产、绿色生活和缓解植物胁迫。这些公司将非洲地区作为该行业未来发展的目标。为降低植物生长调节剂产品价格以提高主要作物产量而进行的研发投资是主要驱动力,预计这将在预测期内推动植物生长调节剂市场的发展。
MEA植物生长调节剂行业概况
Nufarm Ltd、Zagro、ADAMA、UPL 和先正达是所研究市场中的一些知名参与者。这些公司正在通过扩大在该地区的业务来巩固自己的地位。此外,这些企业还与当地分销零售商合作,在该地区销售他们的 PGR 产品。例如,Zagro 与当地零售商合作以增加其市场份额。
MEA 植物生长调节剂市场领导者
-
BASF SE
-
Bayer Crop Science AG
-
Corteva AgriScience
-
Sumitomo Chemical Co. LTD
*免责声明:主要玩家排序不分先后
MEA 植物生长调节剂市场报告 - 目录
-
1. 介绍
-
1.1 研究成果
-
1.2 研究假设
-
1.3 研究范围
-
-
2. 研究方法论
-
3. 执行摘要
-
4. 市场动态
-
4.1 市场概况
-
4.2 市场驱动因素
-
4.3 市场限制
-
4.4 波特五力分析
-
4.4.1 新进入者的威胁
-
4.4.2 买家/消费者的议价能力
-
4.4.3 供应商的议价能力
-
4.4.4 替代产品的威胁
-
4.4.5 竞争激烈程度
-
-
-
5. 市场细分
-
5.1 产品类别
-
5.1.1 细胞分裂素
-
5.1.2 生长素
-
5.1.3 赤霉素
-
5.1.4 其他类型
-
-
5.2 作物类型
-
5.2.1 以农作物为基础
-
5.2.2 非农作物为主
-
-
5.3 地理
-
5.3.1 非洲
-
5.3.1.1 尼日利亚
-
5.3.1.2 坦桑尼亚
-
5.3.1.3 乌干达
-
5.3.1.4 喀麦隆
-
5.3.1.5 刚果
-
5.3.1.6 非洲其他地区
-
-
5.3.2 中东
-
5.3.2.1 伊朗
-
5.3.2.2 火鸡
-
5.3.2.3 伊拉克
-
5.3.2.4 也门
-
5.3.2.5 埃及
-
5.3.2.6 中东其他地区
-
-
-
-
6. 竞争格局
-
6.1 最常用的策略
-
6.2 市场份额分析
-
6.3 公司简介
-
6.3.1 BASF SE
-
6.3.2 Bayer Crop Science
-
6.3.3 Corteva Agriscience
-
6.3.4 Crystal Crop Protection Pvt. Limited
-
6.3.5 Sumitomo Chemicals Co. Ltd
-
6.3.6 NuFarm Ltd
-
6.3.7 Zagro
-
6.3.8 UPL Limited
-
6.3.9 ADAMA Ltd
-
6.3.10 Syngenta AG
-
-
-
7. 市场机会与未来趋势
-
8. COVID-19 的影响
MEA植物生长调节剂行业细分
该报告包括植物生长调节剂的类型及其未来在市场上的广泛范围。该研究还包括作物和田间应用,以及农业中的非作物用途。中东和非洲市场的公司以 B2C 形式运营,市场规模是在消费者层面进行的。
| 产品类别 | ||
| ||
| ||
| ||
|
| 作物类型 | ||
| ||
|
| 地理 | ||||||||||||||
| ||||||||||||||
|
MEA 植物生长调节剂市场研究常见问题解答
目前中东和非洲植物生长调节剂市场规模有多大?
中东和非洲植物生长调节剂市场预计在预测期内(2024-2029)复合年增长率为 6.60%
谁是中东和非洲植物生长调节剂市场的主要参与者?
巴斯夫股份公司、拜耳作物科学股份公司、科迪华农业科技和住友化学有限公司是中东和非洲植物生长调节剂市场的主要公司。
中东和非洲植物生长调节剂市场涵盖哪些年份?
该报告涵盖了中东和非洲植物生长调节剂市场的历史市场规模:2019年、2020年、2021年、2022年和2023年。该报告还预测了中东和非洲植物生长调节剂市场的多年市场规模:2024年、2025年、2026年、2027 年、2028 年和 2029 年。
中东和非洲植物生长调节剂行业报告
Mordor Intelligence™ 行业报告创建的 2024 年中东和非洲植物生长调节剂市场份额、规模和收入增长率统计数据。中东和非洲植物生长调节剂分析包括 2029 年的市场预测展望和历史概述。获取此行业分析的样本(免费下载 PDF 报告)。

