Canada Pet Food Market Size
| Icons | Lable | Value |
|---|---|---|
|
|
Study Period | 2017 - 2029 |
|
|
Market Size (2024) | USD 4.79 Billion |
|
|
Market Size (2029) | USD 5.96 Billion |
|
|
Largest Share by Pets | Dogs |
|
|
CAGR (2024 - 2029) | 4.47 % |
|
|
Fastest Growing by Pets | Dogs |
Major Players |
||
|
|
||
|
*Disclaimer: Major Players sorted in alphabetical order. |
Canada Pet Food Market Analysis
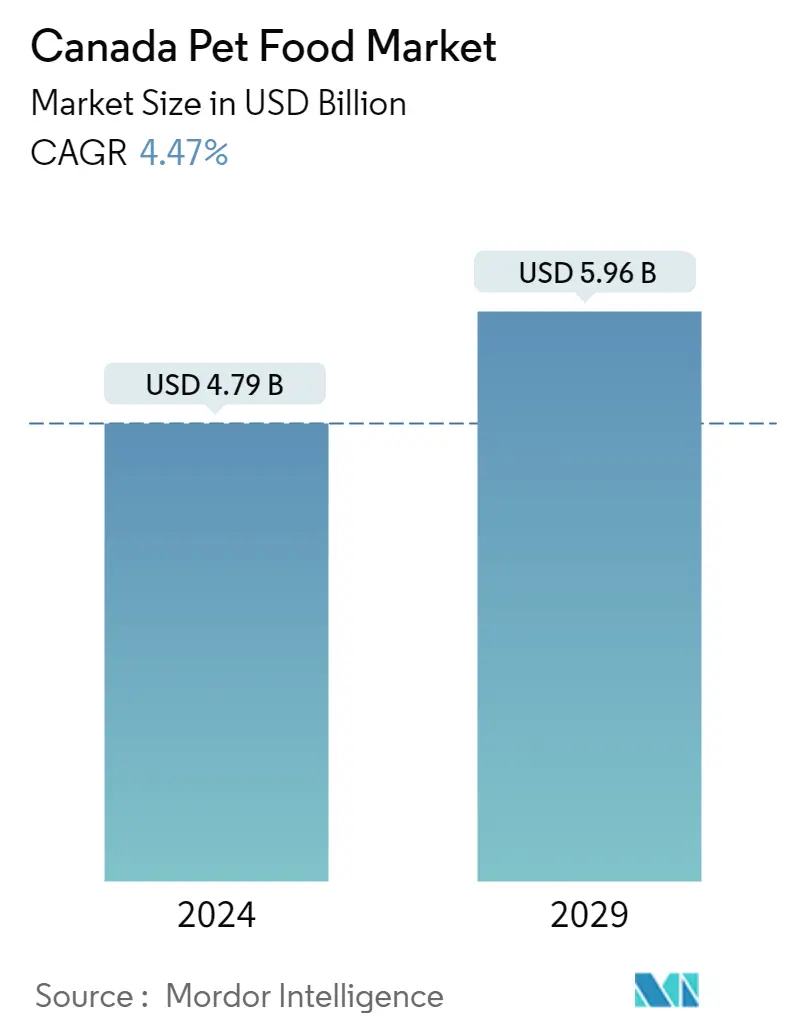
The Canada Pet Food Market size is estimated at USD 4.79 billion in 2024, and is expected to reach USD 5.96 billion by 2029, growing at a CAGR of 4.47% during the forecast period (2024-2029).
4.79 Billion
Market Size in 2024 (USD)
5.96 Billion
Market Size in 2029 (USD)
5.30 %
CAGR (2017-2023)
4.47 %
CAGR (2024-2029)
Largest Market by Product
68.51 %
value share, Food, 2022

The rising pet population and increasing consumer demand for high-quality dry and wet pet foods to support their pets' health are the major factors boosting the pet food segment in the country.
Largest Market by Animal
37.01 %
value share, Dogs, 2022

Despite its smaller population compared to cats, dogs are the largest segment due to the high consumption rate and availability of wider dog food options from various brands.
Fastest-growing Market by Product
9.06 %
Projected CAGR, Pet Nutraceuticals/Supplements, 2023-2029

The increasing demand for vitamins and minerals, probiotics, and omega-3 fatty acids and growing awareness about preventive health care with nutraceuticals are increasing the segment's usage.
Fastest-growing Market by Animal
5.58 %
Projected CAGR, Dogs, 2023-2029
The expanding dog ownership rates, increasing consumer disposable income, and the strong demand for high-quality dog foods in the country are driving the segment's growth.
Leading Market Player
22.53 %
market share, Mars Incorporated, 2022

Mars, Incorporated is the market leader due to its many product innovations and recent acquisition strategy, where it acquired Champion Petfoods.
Increasing pet adoption and the demand for premium pet foods are driving the pet food market in the country
- In Canada, pet ownership is highly common, with a significant percentage of households owning pets. As of 2020, 38.0% of households owned cats and 35.0% owned dogs. As a result of this trend, the pet industry in Canada has been on a continuous upward trend, with the market constantly expanding.
- Despite pet dogs having a lower population than cats in Canada, they dominate the pet food market, valued at USD 1.67 billion in 2022. This is due to their higher consumption of commercial food than cats. With the pet population steadily increasing and pet owners becoming more interested in premium pet products such as grain-free and vegan dog food, the pet food market for dogs is anticipated to be the fastest growing, registering a CAGR of 5.5% during the forecast period.
- Cats accounted for about 36.7% of the pet food market in 2022, owing to their large population in the country, which accounted for around 26.3% of the pet population in the same year. The cat food market is anticipated to register a CAGR of 4.0% during the forecast period because of the increase in the cat population. The average lifespan of a cat is about 20 years, which will also have a long-lasting impact on the market.
- Although other pet animals, including birds, fish, and rodents, accounted for 44.5% of the pet population in Canada, they accounted for 26.2% of the market in 2022. This could be attributed to these pets being typically small and, therefore, requiring relatively small amounts of food.
- The increase in pet ownership during the pandemic and the average lifespan of dogs and cats, which is around 8 to 10 years, is expected to have a long-term impact on the pet food market. Additionally, the continuous increase in pet ownership is anticipated to drive the market in the forecast period.

Canada Pet Food Market Trends
Animal shelters are preferred channels for adoption of cats with the majority adopters being millennials and younger adults
- There is an increase in the adoption of cats as pets in Canada due to the high demand for companionship and less expenditure on pet food for cats than dogs. In Canada, the adoption of cats as pets increased by 2.5% between 2017 and 2022 due to a rise in pet humanization and the lesser area cats require to live compared to dogs. For instance, in Canada, households owning a cat as a pet was 40.1% in 2020, more than that of dog ownership.
- There is an increasing trend of pet humanization among millennials adopting pets, particularly cats, in the country. For instance, in 2020, 54% of the millennials were pet parents and adopted cats to have companionship. This trend was further evident during the pandemic, which helped the rate of adoption to increase. More than 3 million are expected to adopt a pet, including a cat, in 2023. This trend is expected to last longer as the average lifespan of cats is more than 10 years in Canada.
- The animal shelter is one of the key channels for adopting pets, including cats. For cat adoption, cities such as Toronto, Calgary, and Quebec had the highest adoption rate as of 2022, with Toronto accounting for 5% of the adoptions in the country, while Calgary and Quebec accounted for 4% and 1%, respectively. About 80,000 cats are adopted annually from animal shelters as they provide authenticated information regarding health problems to potential adopters before releasing an animal for adoption, which makes animal shelters a preferred option.
- The increase in cat adoption in the country during the forecast period will be due to a rise in pet humanization and the availability of pets from animal shelters.

Pet parents seeking premium and high-quality pet foods is increasing the expenditure per pet in the country
- Canadian pet expenditure witnessed a consistent upward trend, with an increase of about 14.2% between 2019 and 2022. This rise can be attributed to two key factors: pet humanization and premiumization. As of 2020, a significant 58.0% of Canadians owned at least one pet and considered them integral members of their families, indicating the growing trend of humanization.
- Canadian pet owners are increasingly opting for premium pet foods. For instance, premium pet food brands such as "Acana" grain-free pet food witnessed retail sales growth, registering a CAGR of 7.4% from 2016 to 2020. Similarly, "Hill's Science Diet," offering specialized nutrition for pet weight management and skin health, also experienced a rise in retail sales, registering a CAGR of 7.3% during the same period. This surge in sales reflects the increasing trend of premiumization within the country.
- The average expenditure on pets in Canada has seen a significant increase in recent years. In 2018, the average expenditure amounted to USD 1,347, which rose to USD 1,557 in 2021, marking a substantial growth of 15.5% within three years. However, it is important to note that pet expenditure varies based on the type and size of the animal. As of 2022, the average annual budgets for the three most popular pets in Canada were USD 2,912 for dogs, USD 2,150 for cats, and USD 995 for rabbits. These figures encompass various expenses related to pets, including food, veterinary care, and grooming.
- Among distribution channels, offline stores were the top preference for over 79.0% of pet owners, while online sales accounted for 21.0% of the total pet food market value in 2022. The easy accessibility of online retailing is expected to boost pet expenditure during the forecast period.

OTHER KEY INDUSTRY TRENDS COVERED IN THE REPORT
- People seeking companionship has driven the adoption of dogs, and it is estimated to continue increasing
- Low-maintenance and other pets that occupy a limited space increased the adoption of other pets
Canada Pet Food Industry Overview
The Canada Pet Food Market is moderately consolidated, with the top five companies occupying 55.89%. The major players in this market are Colgate-Palmolive Company (Hill's Pet Nutrition Inc.), General Mills Inc., Mars Incorporated, Nestle (Purina) and Schell & Kampeter Inc. (Diamond Pet Foods) (sorted alphabetically).
Canada Pet Food Market Leaders
Colgate-Palmolive Company (Hill's Pet Nutrition Inc.)
General Mills Inc.
Mars Incorporated
Nestle (Purina)
Schell & Kampeter Inc. (Diamond Pet Foods)

Other important companies include ADM, Clearlake Capital Group, L.P. (Wellness Pet Company Inc.), PLB International, Sunshine Mills Inc., Virbac.
*Disclaimer: Major Players sorted in alphabetical order.
Canada Pet Food Market News
- July 2023: Hill's Pet Nutrition introduced its new MSC (Marine Stewardship Council) certified pollock and insect protein products for pets with sensitive stomachs and skin lines. They contain vitamins, omega-3 fatty acids, and antioxidants.
- June 2023: Mars Incorporated launched its premium cat brand SHEBA in Canada, offering cat parents wet formulas through its SHEBA BISTRO line.
- May 2023: Nestle Purina launched new cat treats under the Friskies "Friskies Playfuls - treats" brand. These treats are round in shape and are available in chicken and liver and salmon and shrimp flavors for adult cats.
Free with this Report
We provide a complimentary and exhaustive set of data points on regional and country-level metrics that present the fundamental structure of the industry. Presented in the form of 90+ free charts, the section covers difficult-to-find data from various countries regarding the expenditure on different pet food products including food, treats, veterinary diets, and nutraceuticals/supplements.


Canada Pet Food Market Report - Table of Contents
EXECUTIVE SUMMARY & KEY FINDINGS
REPORT OFFERS
1. INTRODUCTION
1.1. Study Assumptions & Market Definition
1.2. Scope of the Study
1.3. Research Methodology
2. KEY INDUSTRY TRENDS
2.1. Pet Population
2.1.1. Cats
2.1.2. Dogs
2.1.3. Other Pets
2.2. Pet Expenditure
2.3. Regulatory Framework
2.4. Value Chain & Distribution Channel Analysis
3. MARKET SEGMENTATION (includes market size in Value in USD and Volume, Forecasts up to 2029 and analysis of growth prospects)
3.1. Pet Food Product
3.1.1. Food
3.1.1.1. By Sub Product
3.1.1.1.1. Dry Pet Food
3.1.1.1.1.1. By Sub Dry Pet Food
3.1.1.1.1.1.1. Kibbles
3.1.1.1.1.1.2. Other Dry Pet Food
3.1.1.1.2. Wet Pet Food
3.1.2. Pet Nutraceuticals/Supplements
3.1.2.1. By Sub Product
3.1.2.1.1. Milk Bioactives
3.1.2.1.2. Omega-3 Fatty Acids
3.1.2.1.3. Probiotics
3.1.2.1.4. Proteins and Peptides
3.1.2.1.5. Vitamins and Minerals
3.1.2.1.6. Other Nutraceuticals
3.1.3. Pet Treats
3.1.3.1. By Sub Product
3.1.3.1.1. Crunchy Treats
3.1.3.1.2. Dental Treats
3.1.3.1.3. Freeze-dried and Jerky Treats
3.1.3.1.4. Soft & Chewy Treats
3.1.3.1.5. Other Treats
3.1.4. Pet Veterinary Diets
3.1.4.1. By Sub Product
3.1.4.1.1. Diabetes
3.1.4.1.2. Digestive Sensitivity
3.1.4.1.3. Oral Care Diets
3.1.4.1.4. Renal
3.1.4.1.5. Urinary tract disease
3.1.4.1.6. Other Veterinary Diets
3.2. Pets
3.2.1. Cats
3.2.2. Dogs
3.2.3. Other Pets
3.3. Distribution Channel
3.3.1. Convenience Stores
3.3.2. Online Channel
3.3.3. Specialty Stores
3.3.4. Supermarkets/Hypermarkets
3.3.5. Other Channels
4. COMPETITIVE LANDSCAPE
4.1. Key Strategic Moves
4.2. Market Share Analysis
4.3. Company Landscape
4.4. Company Profiles
4.4.1. ADM
4.4.2. Clearlake Capital Group, L.P. (Wellness Pet Company Inc.)
4.4.3. Colgate-Palmolive Company (Hill's Pet Nutrition Inc.)
4.4.4. General Mills Inc.
4.4.5. Mars Incorporated
4.4.6. Nestle (Purina)
4.4.7. PLB International
4.4.8. Schell & Kampeter Inc. (Diamond Pet Foods)
4.4.9. Sunshine Mills Inc.
4.4.10. Virbac
5. KEY STRATEGIC QUESTIONS FOR PET FOOD CEOS
6. APPENDIX
6.1. Global Overview
6.1.1. Overview
6.1.2. Porter’s Five Forces Framework
6.1.3. Global Value Chain Analysis
6.1.4. Market Dynamics (DROs)
6.2. Sources & References
6.3. List of Tables & Figures
6.4. Primary Insights
6.5. Data Pack
6.6. Glossary of Terms
List of Tables & Figures
- Figure 1:
- PET POPULATION OF CATS, NUMBER, CANADA, 2017 - 2022
- Figure 2:
- PET POPULATION OF DOGS, NUMBER, CANADA, 2017 - 2022
- Figure 3:
- PET POPULATION OF OTHER PETS, NUMBER, CANADA, 2017 - 2022
- Figure 4:
- PET EXPENDITURE PER CAT, USD, CANADA, 2017 - 2022
- Figure 5:
- PET EXPENDITURE PER DOG, USD, CANADA, 2017 - 2022
- Figure 6:
- PET EXPENDITURE PER OTHER PET, USD, CANADA, 2017 - 2022
- Figure 7:
- VOLUME OF PET FOOD, METRIC TON, CANADA, 2017 - 2029
- Figure 8:
- VALUE OF PET FOOD, USD, CANADA, 2017 - 2029
- Figure 9:
- VOLUME OF PET FOOD BY PET FOOD PRODUCT CATEGORIES, METRIC TON, CANADA, 2017 - 2029
- Figure 10:
- VALUE OF PET FOOD BY PET FOOD PRODUCT CATEGORIES, USD, CANADA, 2017 - 2029
- Figure 11:
- VOLUME SHARE OF PET FOOD BY PET FOOD PRODUCT CATEGORIES, %, CANADA, 2017 VS 2023 VS 2029
- Figure 12:
- VALUE SHARE OF PET FOOD BY PET FOOD PRODUCT CATEGORIES, %, CANADA, 2017 VS 2023 VS 2029
- Figure 13:
- VOLUME OF PET FOOD BY SUB PRODUCT CATEGORIES, METRIC TON, CANADA, 2017 - 2029
- Figure 14:
- VALUE OF PET FOOD BY SUB PRODUCT CATEGORIES, USD, CANADA, 2017 - 2029
- Figure 15:
- VOLUME SHARE OF PET FOOD BY SUB PRODUCT CATEGORIES, %, CANADA, 2017 VS 2023 VS 2029
- Figure 16:
- VALUE SHARE OF PET FOOD BY SUB PRODUCT CATEGORIES, %, CANADA, 2017 VS 2023 VS 2029
- Figure 17:
- VOLUME OF PET FOOD BY SUB DRY PET FOOD CATEGORIES, METRIC TON, CANADA, 2017 - 2029
- Figure 18:
- VALUE OF PET FOOD BY SUB DRY PET FOOD CATEGORIES, USD, CANADA, 2017 - 2029
- Figure 19:
- VOLUME SHARE OF PET FOOD BY SUB DRY PET FOOD CATEGORIES, %, CANADA, 2017 VS 2023 VS 2029
- Figure 20:
- VALUE SHARE OF PET FOOD BY SUB DRY PET FOOD CATEGORIES, %, CANADA, 2017 VS 2023 VS 2029
- Figure 21:
- VOLUME OF KIBBLES, METRIC TON, CANADA, 2017 - 2029
- Figure 22:
- VALUE OF KIBBLES, USD, CANADA, 2017 - 2029
- Figure 23:
- VALUE SHARE OF KIBBLES BY DISTRIBUTION CHANNEL, %, CANADA, 2022 AND 2029
- Figure 24:
- VOLUME OF OTHER DRY PET FOOD, METRIC TON, CANADA, 2017 - 2029
- Figure 25:
- VALUE OF OTHER DRY PET FOOD, USD, CANADA, 2017 - 2029
- Figure 26:
- VALUE SHARE OF OTHER DRY PET FOOD BY DISTRIBUTION CHANNEL, %, CANADA, 2022 AND 2029
- Figure 27:
- VOLUME OF WET PET FOOD, METRIC TON, CANADA, 2017 - 2029
- Figure 28:
- VALUE OF WET PET FOOD, USD, CANADA, 2017 - 2029
- Figure 29:
- VALUE SHARE OF WET PET FOOD BY DISTRIBUTION CHANNEL, %, CANADA, 2022 AND 2029
- Figure 30:
- VOLUME OF PET FOOD BY SUB PRODUCT CATEGORIES, METRIC TON, CANADA, 2017 - 2029
- Figure 31:
- VALUE OF PET FOOD BY SUB PRODUCT CATEGORIES, USD, CANADA, 2017 - 2029
- Figure 32:
- VOLUME SHARE OF PET FOOD BY SUB PRODUCT CATEGORIES, %, CANADA, 2017 VS 2023 VS 2029
- Figure 33:
- VALUE SHARE OF PET FOOD BY SUB PRODUCT CATEGORIES, %, CANADA, 2017 VS 2023 VS 2029
- Figure 34:
- VOLUME OF MILK BIOACTIVES, METRIC TON, CANADA, 2017 - 2029
- Figure 35:
- VALUE OF MILK BIOACTIVES, USD, CANADA, 2017 - 2029
- Figure 36:
- VALUE SHARE OF MILK BIOACTIVES BY DISTRIBUTION CHANNEL, %, CANADA, 2022 AND 2029
- Figure 37:
- VOLUME OF OMEGA-3 FATTY ACIDS, METRIC TON, CANADA, 2017 - 2029
- Figure 38:
- VALUE OF OMEGA-3 FATTY ACIDS, USD, CANADA, 2017 - 2029
- Figure 39:
- VALUE SHARE OF OMEGA-3 FATTY ACIDS BY DISTRIBUTION CHANNEL, %, CANADA, 2022 AND 2029
- Figure 40:
- VOLUME OF PROBIOTICS, METRIC TON, CANADA, 2017 - 2029
- Figure 41:
- VALUE OF PROBIOTICS, USD, CANADA, 2017 - 2029
- Figure 42:
- VALUE SHARE OF PROBIOTICS BY DISTRIBUTION CHANNEL, %, CANADA, 2022 AND 2029
- Figure 43:
- VOLUME OF PROTEINS AND PEPTIDES, METRIC TON, CANADA, 2017 - 2029
- Figure 44:
- VALUE OF PROTEINS AND PEPTIDES, USD, CANADA, 2017 - 2029
- Figure 45:
- VALUE SHARE OF PROTEINS AND PEPTIDES BY DISTRIBUTION CHANNEL, %, CANADA, 2022 AND 2029
- Figure 46:
- VOLUME OF VITAMINS AND MINERALS, METRIC TON, CANADA, 2017 - 2029
- Figure 47:
- VALUE OF VITAMINS AND MINERALS, USD, CANADA, 2017 - 2029
- Figure 48:
- VALUE SHARE OF VITAMINS AND MINERALS BY DISTRIBUTION CHANNEL, %, CANADA, 2022 AND 2029
- Figure 49:
- VOLUME OF OTHER NUTRACEUTICALS, METRIC TON, CANADA, 2017 - 2029
- Figure 50:
- VALUE OF OTHER NUTRACEUTICALS, USD, CANADA, 2017 - 2029
- Figure 51:
- VALUE SHARE OF OTHER NUTRACEUTICALS BY DISTRIBUTION CHANNEL, %, CANADA, 2022 AND 2029
- Figure 52:
- VOLUME OF PET FOOD BY SUB PRODUCT CATEGORIES, METRIC TON, CANADA, 2017 - 2029
- Figure 53:
- VALUE OF PET FOOD BY SUB PRODUCT CATEGORIES, USD, CANADA, 2017 - 2029
- Figure 54:
- VOLUME SHARE OF PET FOOD BY SUB PRODUCT CATEGORIES, %, CANADA, 2017 VS 2023 VS 2029
- Figure 55:
- VALUE SHARE OF PET FOOD BY SUB PRODUCT CATEGORIES, %, CANADA, 2017 VS 2023 VS 2029
- Figure 56:
- VOLUME OF CRUNCHY TREATS, METRIC TON, CANADA, 2017 - 2029
- Figure 57:
- VALUE OF CRUNCHY TREATS, USD, CANADA, 2017 - 2029
- Figure 58:
- VALUE SHARE OF CRUNCHY TREATS BY DISTRIBUTION CHANNEL, %, CANADA, 2022 AND 2029
- Figure 59:
- VOLUME OF DENTAL TREATS, METRIC TON, CANADA, 2017 - 2029
- Figure 60:
- VALUE OF DENTAL TREATS, USD, CANADA, 2017 - 2029
- Figure 61:
- VALUE SHARE OF DENTAL TREATS BY DISTRIBUTION CHANNEL, %, CANADA, 2022 AND 2029
- Figure 62:
- VOLUME OF FREEZE-DRIED AND JERKY TREATS, METRIC TON, CANADA, 2017 - 2029
- Figure 63:
- VALUE OF FREEZE-DRIED AND JERKY TREATS, USD, CANADA, 2017 - 2029
- Figure 64:
- VALUE SHARE OF FREEZE-DRIED AND JERKY TREATS BY DISTRIBUTION CHANNEL, %, CANADA, 2022 AND 2029
- Figure 65:
- VOLUME OF SOFT & CHEWY TREATS, METRIC TON, CANADA, 2017 - 2029
- Figure 66:
- VALUE OF SOFT & CHEWY TREATS, USD, CANADA, 2017 - 2029
- Figure 67:
- VALUE SHARE OF SOFT & CHEWY TREATS BY DISTRIBUTION CHANNEL, %, CANADA, 2022 AND 2029
- Figure 68:
- VOLUME OF OTHER TREATS, METRIC TON, CANADA, 2017 - 2029
- Figure 69:
- VALUE OF OTHER TREATS, USD, CANADA, 2017 - 2029
- Figure 70:
- VALUE SHARE OF OTHER TREATS BY DISTRIBUTION CHANNEL, %, CANADA, 2022 AND 2029
- Figure 71:
- VOLUME OF PET FOOD BY SUB PRODUCT CATEGORIES, METRIC TON, CANADA, 2017 - 2029
- Figure 72:
- VALUE OF PET FOOD BY SUB PRODUCT CATEGORIES, USD, CANADA, 2017 - 2029
- Figure 73:
- VOLUME SHARE OF PET FOOD BY SUB PRODUCT CATEGORIES, %, CANADA, 2017 VS 2023 VS 2029
- Figure 74:
- VALUE SHARE OF PET FOOD BY SUB PRODUCT CATEGORIES, %, CANADA, 2017 VS 2023 VS 2029
- Figure 75:
- VOLUME OF DIABETES, METRIC TON, CANADA, 2017 - 2029
- Figure 76:
- VALUE OF DIABETES, USD, CANADA, 2017 - 2029
- Figure 77:
- VALUE SHARE OF DIABETES BY DISTRIBUTION CHANNEL, %, CANADA, 2022 AND 2029
- Figure 78:
- VOLUME OF DIGESTIVE SENSITIVITY, METRIC TON, CANADA, 2017 - 2029
- Figure 79:
- VALUE OF DIGESTIVE SENSITIVITY, USD, CANADA, 2017 - 2029
- Figure 80:
- VALUE SHARE OF DIGESTIVE SENSITIVITY BY DISTRIBUTION CHANNEL, %, CANADA, 2022 AND 2029
- Figure 81:
- VOLUME OF ORAL CARE DIETS, METRIC TON, CANADA, 2017 - 2029
- Figure 82:
- VALUE OF ORAL CARE DIETS, USD, CANADA, 2017 - 2029
- Figure 83:
- VALUE SHARE OF ORAL CARE DIETS BY DISTRIBUTION CHANNEL, %, CANADA, 2022 AND 2029
- Figure 84:
- VOLUME OF RENAL, METRIC TON, CANADA, 2017 - 2029
- Figure 85:
- VALUE OF RENAL, USD, CANADA, 2017 - 2029
- Figure 86:
- VALUE SHARE OF RENAL BY DISTRIBUTION CHANNEL, %, CANADA, 2022 AND 2029
- Figure 87:
- VOLUME OF URINARY TRACT DISEASE, METRIC TON, CANADA, 2017 - 2029
- Figure 88:
- VALUE OF URINARY TRACT DISEASE, USD, CANADA, 2017 - 2029
- Figure 89:
- VALUE SHARE OF URINARY TRACT DISEASE BY DISTRIBUTION CHANNEL, %, CANADA, 2022 AND 2029
- Figure 90:
- VOLUME OF OTHER VETERINARY DIETS, METRIC TON, CANADA, 2017 - 2029
- Figure 91:
- VALUE OF OTHER VETERINARY DIETS, USD, CANADA, 2017 - 2029
- Figure 92:
- VALUE SHARE OF OTHER VETERINARY DIETS BY DISTRIBUTION CHANNEL, %, CANADA, 2022 AND 2029
- Figure 93:
- VOLUME OF PET FOOD BY PET TYPE, METRIC TON, CANADA, 2017 - 2029
- Figure 94:
- VALUE OF PET FOOD BY PET TYPE, USD, CANADA, 2017 - 2029
- Figure 95:
- VOLUME SHARE OF PET FOOD BY PET TYPE, %, CANADA, 2017 VS 2023 VS 2029
- Figure 96:
- VALUE SHARE OF PET FOOD BY PET TYPE, %, CANADA, 2017 VS 2023 VS 2029
- Figure 97:
- VOLUME OF PET CAT FOOD, METRIC TON, CANADA, 2017 - 2029
- Figure 98:
- VALUE OF PET CAT FOOD, USD, CANADA, 2017 - 2029
- Figure 99:
- VALUE SHARE OF PET CAT FOOD BY PET FOOD CATEGORIES, %, CANADA, 2022 AND 2029
- Figure 100:
- VOLUME OF PET DOG FOOD, METRIC TON, CANADA, 2017 - 2029
- Figure 101:
- VALUE OF PET DOG FOOD, USD, CANADA, 2017 - 2029
- Figure 102:
- VALUE SHARE OF PET DOG FOOD BY PET FOOD CATEGORIES, %, CANADA, 2022 AND 2029
- Figure 103:
- VOLUME OF OTHER PETS FOOD, METRIC TON, CANADA, 2017 - 2029
- Figure 104:
- VALUE OF OTHER PETS FOOD, USD, CANADA, 2017 - 2029
- Figure 105:
- VALUE SHARE OF OTHER PETS FOOD BY PET FOOD CATEGORIES, %, CANADA, 2022 AND 2029
- Figure 106:
- VOLUME OF PET FOOD SOLD VIA DISTRIBUTION CHANNELS, METRIC TON, CANADA, 2017 - 2029
- Figure 107:
- VALUE OF PET FOOD SOLD VIA DISTRIBUTION CHANNELS, USD, CANADA, 2017 - 2029
- Figure 108:
- VOLUME SHARE OF PET FOOD SOLD VIA DISTRIBUTION CHANNELS, %, CANADA, 2017 VS 2023 VS 2029
- Figure 109:
- VALUE SHARE OF PET FOOD SOLD VIA DISTRIBUTION CHANNELS, %, CANADA, 2017 VS 2023 VS 2029
- Figure 110:
- VOLUME OF PET FOOD SOLD VIA CONVENIENCE STORES, METRIC TON, CANADA, 2017 - 2029
- Figure 111:
- VALUE OF PET FOOD SOLD VIA CONVENIENCE STORES, USD, CANADA, 2017 - 2029
- Figure 112:
- VALUE SHARE OF PET FOOD SOLD VIA CONVENIENCE STORES BY PET FOOD PRODUCT CATEGORIES, %, CANADA, 2022 AND 2029
- Figure 113:
- VOLUME OF PET FOOD SOLD VIA ONLINE CHANNEL, METRIC TON, CANADA, 2017 - 2029
- Figure 114:
- VALUE OF PET FOOD SOLD VIA ONLINE CHANNEL, USD, CANADA, 2017 - 2029
- Figure 115:
- VALUE SHARE OF PET FOOD SOLD VIA ONLINE CHANNEL BY PET FOOD PRODUCT CATEGORIES, %, CANADA, 2022 AND 2029
- Figure 116:
- VOLUME OF PET FOOD SOLD VIA SPECIALTY STORES, METRIC TON, CANADA, 2017 - 2029
- Figure 117:
- VALUE OF PET FOOD SOLD VIA SPECIALTY STORES, USD, CANADA, 2017 - 2029
- Figure 118:
- VALUE SHARE OF PET FOOD SOLD VIA SPECIALTY STORES BY PET FOOD PRODUCT CATEGORIES, %, CANADA, 2022 AND 2029
- Figure 119:
- VOLUME OF PET FOOD SOLD VIA SUPERMARKETS/HYPERMARKETS, METRIC TON, CANADA, 2017 - 2029
- Figure 120:
- VALUE OF PET FOOD SOLD VIA SUPERMARKETS/HYPERMARKETS, USD, CANADA, 2017 - 2029
- Figure 121:
- VALUE SHARE OF PET FOOD SOLD VIA SUPERMARKETS/HYPERMARKETS BY PET FOOD PRODUCT CATEGORIES, %, CANADA, 2022 AND 2029
- Figure 122:
- VOLUME OF PET FOOD SOLD VIA OTHER CHANNELS, METRIC TON, CANADA, 2017 - 2029
- Figure 123:
- VALUE OF PET FOOD SOLD VIA OTHER CHANNELS, USD, CANADA, 2017 - 2029
- Figure 124:
- VALUE SHARE OF PET FOOD SOLD VIA OTHER CHANNELS BY PET FOOD PRODUCT CATEGORIES, %, CANADA, 2022 AND 2029
- Figure 125:
- MOST ACTIVE COMPANIES BY NUMBER OF STRATEGIC MOVES, COUNT, CANADA, 2017 - 2023
- Figure 126:
- MOST ADOPTED STRATEGIES, COUNT, CANADA, 2017 - 2023
- Figure 127:
- VALUE SHARE OF MAJOR PLAYERS, %, CANADA, 2022
Canada Pet Food Industry Segmentation
Food, Pet Nutraceuticals/Supplements, Pet Treats, Pet Veterinary Diets are covered as segments by Pet Food Product. Cats, Dogs are covered as segments by Pets. Convenience Stores, Online Channel, Specialty Stores, Supermarkets/Hypermarkets are covered as segments by Distribution Channel.
- In Canada, pet ownership is highly common, with a significant percentage of households owning pets. As of 2020, 38.0% of households owned cats and 35.0% owned dogs. As a result of this trend, the pet industry in Canada has been on a continuous upward trend, with the market constantly expanding.
- Despite pet dogs having a lower population than cats in Canada, they dominate the pet food market, valued at USD 1.67 billion in 2022. This is due to their higher consumption of commercial food than cats. With the pet population steadily increasing and pet owners becoming more interested in premium pet products such as grain-free and vegan dog food, the pet food market for dogs is anticipated to be the fastest growing, registering a CAGR of 5.5% during the forecast period.
- Cats accounted for about 36.7% of the pet food market in 2022, owing to their large population in the country, which accounted for around 26.3% of the pet population in the same year. The cat food market is anticipated to register a CAGR of 4.0% during the forecast period because of the increase in the cat population. The average lifespan of a cat is about 20 years, which will also have a long-lasting impact on the market.
- Although other pet animals, including birds, fish, and rodents, accounted for 44.5% of the pet population in Canada, they accounted for 26.2% of the market in 2022. This could be attributed to these pets being typically small and, therefore, requiring relatively small amounts of food.
- The increase in pet ownership during the pandemic and the average lifespan of dogs and cats, which is around 8 to 10 years, is expected to have a long-term impact on the pet food market. Additionally, the continuous increase in pet ownership is anticipated to drive the market in the forecast period.
| Pet Food Product | |||||||||||
| |||||||||||
| |||||||||||
| |||||||||||
|
| Pets | |
| Cats | |
| Dogs | |
| Other Pets |
| Distribution Channel | |
| Convenience Stores | |
| Online Channel | |
| Specialty Stores | |
| Supermarkets/Hypermarkets | |
| Other Channels |
Market Definition
- FUNCTIONS - Pet foods are usually intended to provide complete and balanced nutrition to the pet but are primarily used as functional products. The scope includes the food and supplements consumed by pets including veterinary diets. Supplements/nutraceuticals that are directly supplied to pets are considered within the scope.
- RESELLERS - Companies engaged in reselling of pet food without value addition have been excluded from the market scope, in order to avoid double counting.
- END CONSUMERS - Pet owners are considered to be the end-consumers in the market studied.
- DISTRIBUTION CHANNELS - Supermarkets/hypermarkets, specialty stores, convenience stores, online channels and other channels are considered within the scope. The stores which are exclusively providing pet related basic and custom products are considered within the scope of specialty stores.
| Keyword | Definition |
|---|---|
| Pet Food | The scope of pet food includes the food that is eatable by pets including food, treats, veterinary diets, and nutraceuticals/supplements. |
| Food | Food is animal feed intended for consumption by pets. It is formulated to provide essential nutrients and meet the dietary needs of various types of pets, including dogs, cats, and other animals. These are generally segmented into dry and wet pet foods. |
| Dry Pet Food | Dry pet foods may be extruded/baked (kibbles) or flaked. They have a lower moisture content, typically around 12-20%. |
| Wet Pet Food | Wet pet food, also known as canned pet food or moist pet food, generally has a higher moisture content compared to dry pet food, often ranging from 70-80%. |
| Kibbles | Kibbles are dry, processed pet food in small, bite-sized pieces or pellets. They are specifically formulated to provide balanced nutrition for various domestic animals, such as dogs, cats, and other animals. |
| Treats | Pet Treats are special food items or rewards given to pets, to show affection, and encourage good behavior. They are especially used during training. Pet treats are made from various combinations of meat or meat-derived materials with other ingredients. |
| Dental Treats | Pet dental treats are specialized treats that are formulated to promote good oral hygiene in pets. |
| Crunchy Treats | It is a type of pet treat that has a firm and crispy texture which can be a good source of nutrition for pets. |
| Soft and chewy treats | Soft and Chewy pet treats are a type of pet food product that is formulated to be easy to chewy and digest. They are usually made from soft and pliable ingredients, such as meat, poultry, or vegetables, that have been blended and formed into bite-sized pieces or strips. |
| Freeze-dried & Jerky Treats | Freeze-dried and jerky treats are snacks given to pets, that are prepared through a special preservation process, without damaging the nutritional content, resulting in long-lasting, nutrient-rich treats. |
| Urinary Tract Disease Diets | These are commercial diets that are specifically formulated to promote urinary health and reduce the risk of urinary tract infections and other urinary problems. |
| Renal Diets | These are specialized pet foods formulated to support the health of pets with kidney disease or renal insufficiency. |
| Digestive Sensitivity Diets | Digestive-sensitive diets are specially formulated to meet the nutritional needs of pets with digestive issues such as food intolerances, allergies, and sensitivities. These diets are designed to be easily digestible and to reduce the symptoms of digestive problems in pets. |
| Oral Care Diets | Oral care diets for pets are specially formulated diets produced to promote oral health and hygiene in pets. |
| Grain-Free Pet Food | Pet food that does not contain common grains like wheat, corn, or soy. Grain-free diets are often preferred by pet owners seeking alternative options or if their pets have specific dietary sensitivities. |
| Premium Pet Food | High-quality pet food formulated with superior ingredients often offers additional nutritional benefits compared to standard pet food. |
| Natural Pet Food | Pet food made from natural ingredients, with minimal processing and without artificial preservatives. |
| Organic Pet Food | Pet food is produced using organic ingredients, free from synthetic pesticides, hormones, and genetically modified organisms (GMOs). |
| Extrusion | A manufacturing process used to produce dry pet food, where ingredients are cooked, mixed, and shaped under high pressure and temperature. |
| Other Pets | Other pets include birds, fish, rabbits, hamsters, ferrets, and reptiles. |
| Palatability | The taste, texture, and aroma of pet food influence its appeal and acceptance by pets. |
| Complete and Balanced Pet Food | Pet food that provides all essential nutrients in appropriate proportions to meet the nutritional needs of pets without additional supplementation. |
| Preservatives | These are the substances that are added to pet food to extend its shelf life and prevent spoilage. |
| Nutraceuticals | Food products that offer health benefits beyond basic nutrition, often contain bioactive compounds with potential therapeutic effects. |
| Probiotics | Live beneficial bacteria that promote a healthy balance of gut flora, supporting digestive health and immune function in pets. |
| Antioxidants | Compounds that help neutralize harmful free radicals in the body, promoting cellular health and supporting the immune system in pets. |
| Shelf-Life | The duration of which pet food remains safe and nutritionally viable for consumption after its production date. |
| Prescription diet | Specialized pet food formulated to address specific medical conditions under veterinary supervision. |
| Allergen | A substance that can cause allergic reactions in some pets, leading to food allergies or sensitivities. |
| Canned food | Wet pet food that is packed in cans and contains higher moisture content than dry food. |
| Limited ingredient diet (LID) | Pet food formulated with a reduced number of ingredients to minimize potential allergens. |
| Guaranteed Analysis | The minimum or maximum levels of certain nutrients present in pet food. |
| Weight management | Pet food designed to help pets maintain a healthy weight or support weight loss efforts. |
| Other Nutraceuticals | It includes prebiotics, antioxidants, digestive fiber, enzymes, essential oils and herbs. |
| Other Veterinary Diets | It includes weight management diets, skin and coat health, cardiac care, and joint care. |
| Other Treats | It includes rawhides, mineral blocks, lickables, and catnips. |
| Other Dry Foods | It includes cereal flakes, mixers, meal toppers, freeze-dried foods, and air-dried foods. |
| Other Animals | It includes birds, fish, reptiles, and small animals (rabbits, ferrets, hamsters). |
| Other Distribution Channels | It includes veterinary clinics, local unregulated stores, and feed and farm stores. |
| Proteins and Peptides | Proteins are large molecules composed of basic units called amino acids which help in the growth and development of pets. Peptides are the short string of 2 to 50 amino acids. |
| Omega-3 fatty acids | Omega-3 fatty acids are essential polyunsaturated fats that play a crucial role in the overall health and well-being of Pets |
| Vitamins | Vitamins are the essential organic compounds that are essential for vital physiological functioning. |
| Minerals | Minerals are naturally occurring inorganic substances that are essential for various physiological functions in pets. |
| CKD | Chronic Kidney Disease |
| DHA | Docosahexaenoic Acid |
| EPA | Eicosapentaenoic Acid |
| ALA | Alpha-linolenic Acid |
| BHA | Butylated Hydroxyanisol |
| BHT | Butylated Hydroxytoluene |
| FLUTD | Feline Lower Urinary Tract Disease |
Research Methodology
Mordor Intelligence follows a four-step methodology in all our reports.
- Step-1: IDENTIFY KEY VARIABLES: In order to build a robust forecasting methodology, the variables and factors identified in Step-1 are tested against available historical market numbers. Through an iterative process, the variables required for market forecast are set and the model is built on the basis of these variables.
- Step-2: Build a Market Model: Market-size estimations for the forecast years are in nominal terms. Inflation is not a part of the pricing, and the average selling price (ASP) is kept constant throughout the forecast period.
- Step-3: Validate and Finalize: In this important step, all market numbers, variables and analyst calls are validated through an extensive network of primary research experts from the market studied. The respondents are selected across levels and functions to generate a holistic picture of the market studied.
- Step-4: Research Outputs: Syndicated Reports, Custom Consulting Assignments, Databases & Subscription Platforms


