Optical Spectrum Analyzer (OSA) Market Size
| Study Period | 2019 - 2029 |
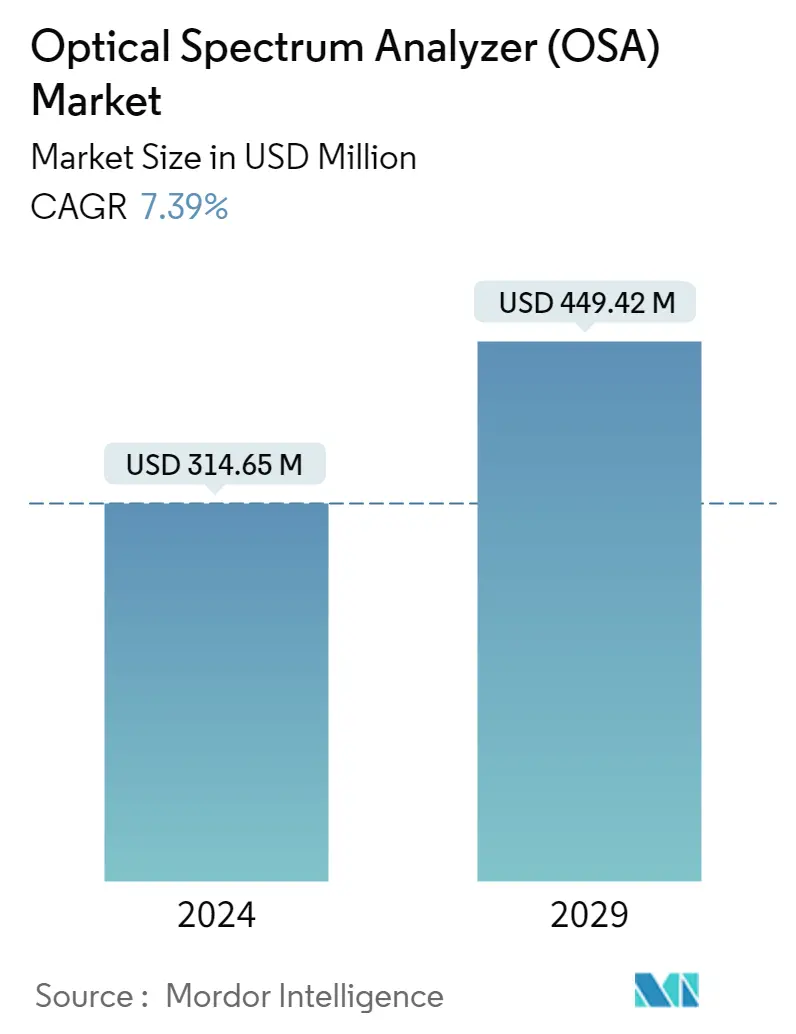
| Market Size (2024) | USD 314.65 Million |
| Market Size (2029) | USD 449.42 Million |
| CAGR (2024 - 2029) | 7.39 % |
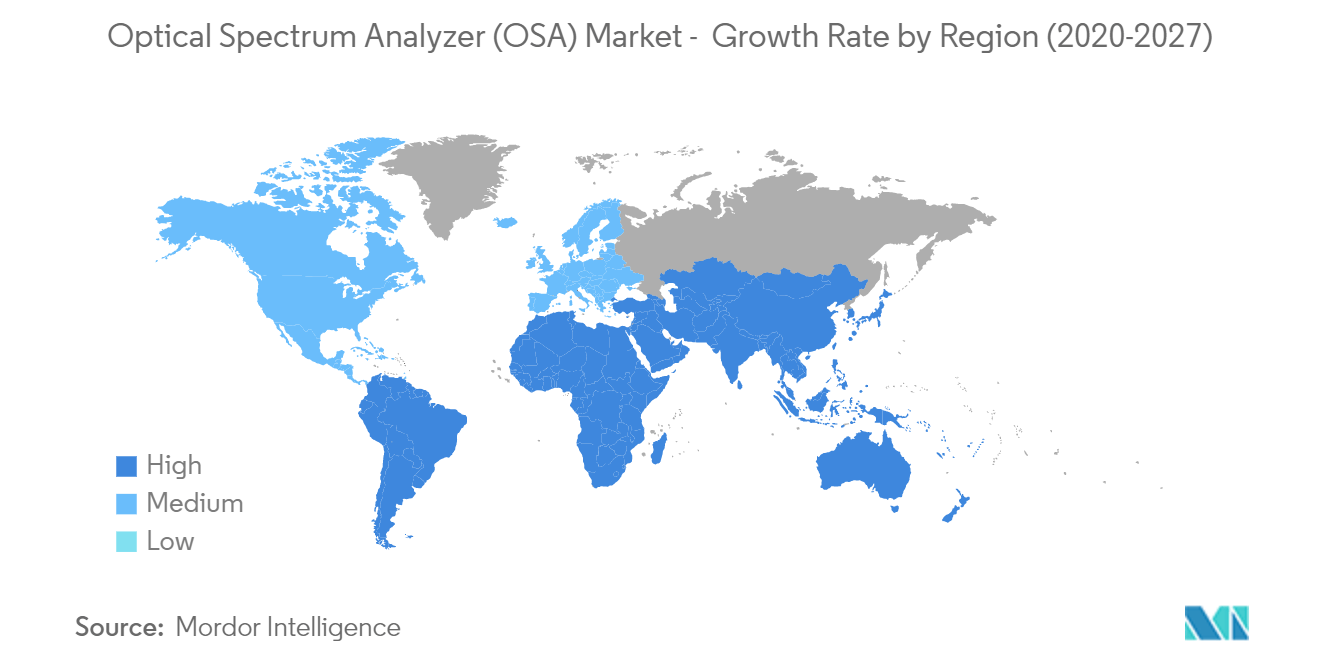
| Fastest Growing Market | Asia Pacific |
| Largest Market | North America |
Major Players
*Disclaimer: Major Players sorted in no particular order |
Need a report that reflects how COVID-19 has impacted this market and its growth?
Optical Spectrum Analyzer (OSA) Market Analysis
The Optical Spectrum Analyzer Market size is estimated at USD 314.65 million in 2024, and is expected to reach USD 449.42 million by 2029, growing at a CAGR of 7.39% during the forecast period (2024-2029).
Optical spectrum analyzers are the key components enabling the research and development and installation operations in several communication applications such as laser modes analysis, very high-resolution spectroscopic measurements, telecommunication devices, system tests, and others.
- In recent years, research and development of highly proficient high-performance products using optical technologies, such as a semiconductor laser developed for data communication, has become more widespread, and the growing demand has developed for high-performance optical spectrum analyzers to evaluate and analyze their optical spectrum.
- Additionally, the significant increase in internet users, both commercially as well as residentially, forced the operators to meet the growing demand for bandwidth. This further aided the operators in investing heavily in testing equipment related to the optical spectrum.
- The increasing demand for connected environments, especially in the manufacturing sector, has started driving the demand for faster and more reliable communication networks.
- The introduction of 5G and cloud communications services is expected to increase the data traffic volumes and data generation massively. In order to allow in-time delivery required for the rapid expansion and adoption of faster rate optical modules, increased module production and shorter inspection times are required.
- The demand for faster and more reliable communication networks has grown because of increased spending on research and development, technical advancements, and the growing need for networked areas, particularly in the manufacturing sector.
- The manufacturing procedure for these mobile versions has expanded the variety of optical spectrum analyzers available in the field, particularly for testing and installation. The telecommunications and manufacturing industries significantly demand optical spectrum analyzers (OSA).
Optical Spectrum Analyzer (OSA) Market Trends
This section covers the major market trends shaping the Optical Spectrum Analyzer (OSA) Market according to our research experts:
Telecommunications is Expected to Hold the Largest Share
- In the telecom industry, spectrum analyzers are essential for determining the required signal spectrum and strength to ensure a reliable network. Optical spectrum analyzers are used to monitor the required output signals continuously, which helps telecom providers to modulate the intensity of their signals dynamically.
- Also, OSA's are of great importance to the telecom equipment manufacturers. As most telecom equipment fabrication procedure includes a wavelength characterization test to qualify a product for market entry, the demand for OSAs from this sector is considerably high.
- One of the major applications of the OSAs in telecommunications is where dense wavelength division multiplexing (DWDM) is used to provide high data bandwidth over fiber optics. Most telecommunication equipment fabrication procedures include a wavelength characterization test in qualifying a product for market entry; the demand for OSAs from this sector is considerably high.
- Rapidly evolving communication networks and a new spectrum like 5G are also creating significant demand opportunities for advanced telecommunication equipment, contributing to increased demand for OSAs from telecom manufacturers.
- Various companies operating in the market are providing OSA for telecommunication applications. For instance, Yokogawa Test & Measurement Corporation provides the AQ6360 optical spectrum analyzer. It is a cost-effective optical spectrum analyzer ideal for industrial manufacturing of telecom devices, such as lasers, optical transceivers, and optical amplifiers.
North-America is Expected to Maintain a Strong Hold over the Market
- North America is one of the largest markets for optical spectrum analyzers globally. The rapid adoption of Industry 4.0 initiatives encouraging automation and a connected manufacturing environment is one of the primary drivers creating the demand for optical spectrum analyzers in the region.
- Owing to several vital manufacturers and backed by the developed economy, the demand for optical spectrum analyzers is likely to grow in the US market.
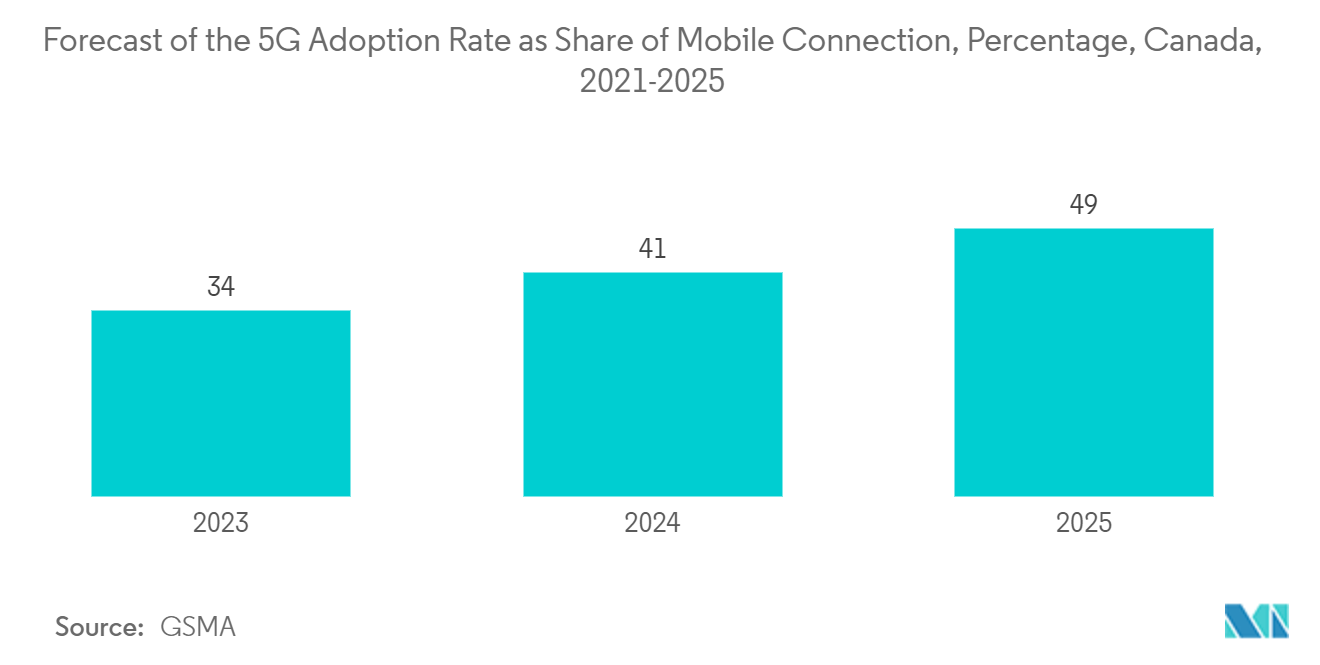
- Due to the advancement of 5G in the region, all the major service providers are moving toward launching new devices that support the technology, thus, creating a potential demand for the OSAs in the market. It is evident because Canadian operators already spent USD 3.5 billion in a 5G spectrum auction for the 600 MHz band, a vital frequency that penetrates buildings and works well in rural areas.
- For instance, in 2021, Canada's largest wireless companies spent almost USD 9 billion on a new 5G spectrum 2021, and consumer expectations are high. Rogers invested CAD 3.3 billion in the 5G spectrum, covering 99.4% of the Canadian population, making it the largest single investor in the 5G spectrum in the country. Bell spent USD 2.1 billion in the auction and TELUS USD 1.95 billion. Videotron spent nearly USD 830 million, with more than half of Ontario, Manitoba, Alberta, and British Columbia investments.
- Ericsson predicts that by 2023, the network traffic will increase by at least eight times. In such a scenario, the current 5G networks will enable ten times lower cost per gigabyte than the current 4G networks. Such benefits are expected to increase investments in the region's telecom sector, creating new opportunities for the optical spectrum analyzer market.
- In May 2021, EXFO, Canada, introduced the 5GPro optimum spectrum analyzer (OSA), the only modular, field-focused radio frequency (RF) testing solution. EXFO solution will provide accurate visibility into 4G/LTE and 5G NR environments to analyze FR1(sub-6 GHz) and FR2 (mmWave) bands using a single, field-upgradeable solution.
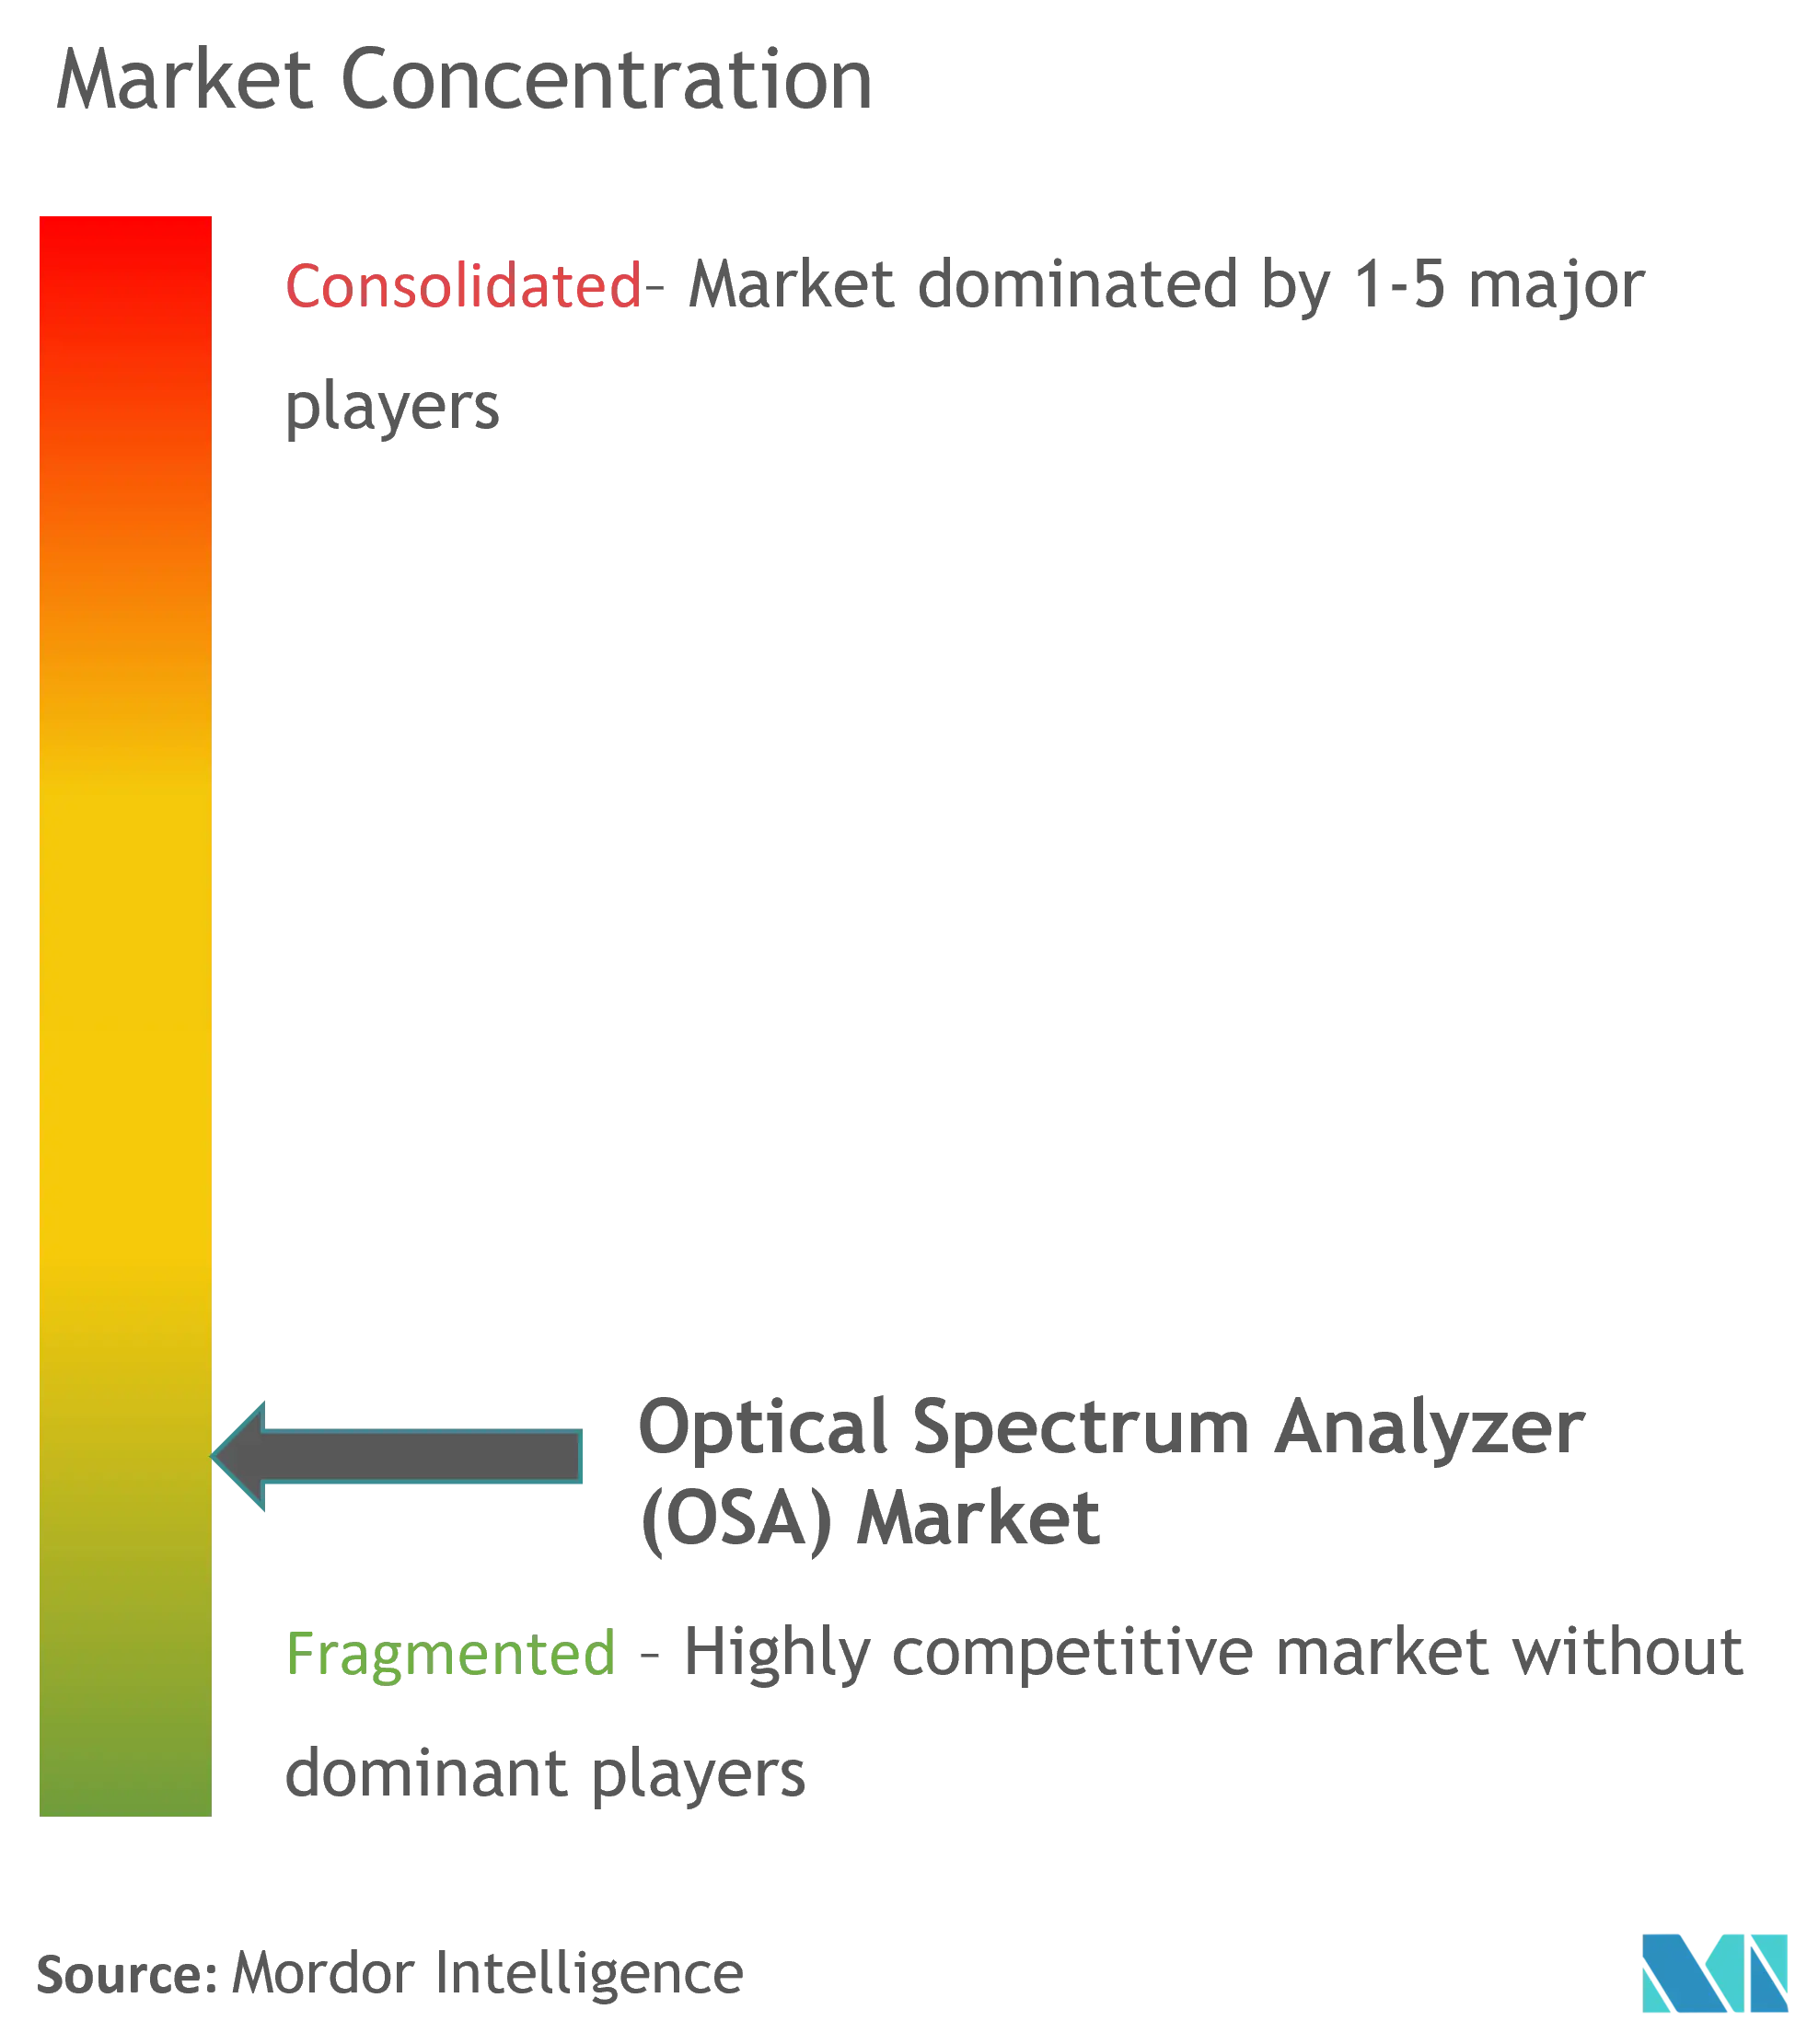
Optical Spectrum Analyzer (OSA) Industry Overview
The competitive rivalry among the players in the optical spectrum analysis is high owing to the presence of some key players, such as Yokogawa, Exfo Inc., VIAVI, Anritsu, Thorlabs, and many more. Their ability to continuously innovate the products by investing a considerable amount in research and development has allowed them to gain a competitive advantage over others in the market. Strategic alliances and mergers and acquisitions have enabled such players to gain a strong foothold in the market.
- September 2021 - Yokogawa, Japan, has launched a new optical spectrum analyzer for researchers developing the next generation of optical communication components. The Yokogawa AQ6380 OSA offers unequaled optical performance to allow scientists and engineers to develop and improve the next generation of communication networks' speed, bandwidth, and quality.
- June 2021 - Bristol Instruments announced offering software that converts 438 Series Multi-Wavelength Meter into a high-resolution optical spectrum analyzer. The model 438 offered the most accurate, effective, and adaptable WDM wavelength testing currently available, owing to features like high precision, measurement rate up to 10 Hz, and a wide operational range of 1000 to 1680 nm.
Optical Spectrum Analyzer (OSA) Market Leaders
Yokogawa Test & Measurement Corporation
Thorlabs Inc.
VIAVI Solutions
EXFO Inc.
Anritsu Corporation
*Disclaimer: Major Players sorted in no particular order
Optical Spectrum Analyzer (OSA) Market News
- August 2022 - Yokogawa announced to launch of two new optical spectrum analyzers (OSAs), AQ6375E and AQ6376E. The launch aimed to fulfill market demands for an instrument capable of measuring a wide range of wavelengths to meet new needs in optical product manufacturing and development.
- January 2022 - SAF Tehnika announced the expansion of its Spectrum Compact family of ultra-portable handheld microwave spectrum analyzers. It now offers overlaps of the frequency ranges for each of the Spectrum Compact V2 models. Also, the new model supports 16-26.5 GHz and delivers enhanced performance with improved features, high durability, and an affordable price.
- June 2021 - VIAVI Solutions Inc. introduced the MOSA module, adding optical spectrum analysis to the VIAVI multiple application platform (MAP) optical manufacturing test system. The MOSA complements existing VIAVI solutions for optical power measurement, switching, and signal-to condition.
- May 2021 - EXFO introduced the 5GPro optimum spectrum analyzer (OSA), the only modular, field-focused radio frequency (RF) testing solution. EXFO solution will provide accurate visibility into 4G/LTE and 5G NR environments to analyze FR1(sub-6 GHz) and FR2 (mmWave) bands using a single, field-upgradeable solution.
Optical Spectrum Analyzer (OSA) Market Report - Table of Contents
1. INTRODUCTION
1.1 Study Assumptions and Market Definition
1.2 Scope of the Study
2. RESEARCH METHODOLOGY
2.1 Research Framework
2.2 Secondary Research
2.3 Primary Research
2.4 Data Triangulation & Insight Generation
3. EXECUTIVE SUMMARY
4. MARKET INSIGHTS
4.1 Market Overview
4.2 Industry Attractiveness - Porter's Five Forces Analysis
4.2.1 Threat of New Entrants
4.2.2 Bargaining Power of Buyers
4.2.3 Bargaining Power of Suppliers
4.2.4 Threat of Substitute Products
4.2.5 Intensity of Competitive Rivalry
4.3 Value Chain Analysis
4.4 Assessment of Impact of COVID-19 on The Market
5. MARKET DYNAMICS
5.1 Market Drivers
5.1.1 Growth of 5G (Millimeter Wave) Technology
5.2 Market Challenges/Restraints
5.2.1 Replacement of Optical Spectrum Analyzer Products with Advanced Products
6. MARKET SEGMENTATION
6.1 By Type
6.1.1 Portable
6.1.2 Handheld
6.1.3 Benchtop
6.2 By End-user Industry
6.2.1 Telecommunication
6.2.2 Healthcare
6.2.3 Consumer Electronics
6.2.4 Other End-user Industry
6.3 By Geography
6.3.1 North America
6.3.2 Europe
6.3.3 Asia-Pacific
6.3.4 Latin America
6.3.5 Middle-East and Africa
7. COMPETITIVE LANDSCAPE
7.1 Company Profiles
7.1.1 Yokogawa Test & Measurement Corporation
7.1.2 Thorlabs Inc.
7.1.3 VIAVI Solutions Inc.
7.1.4 Exfo Inc.
7.1.5 Anritsu Corporation
7.1.6 Quantifi Photonics Limited
7.1.7 Apex Technologies
7.1.8 Aragon Photonics Brillouin
7.1.9 II-VI Incorporated
7.1.10 Luna Innovations
7.1.11 ID Photonics GmbH
- *List Not Exhaustive
8. INVESTMENT ANALYSIS
9. FUTURE TRENDS
Optical Spectrum Analyzer (OSA) Industry Segmentation
An optical spectrum analyzer is a precision instrument used to measure and display the distribution of power from an optic source over a specified wavelength span.
The scope of the study comprises a market analysis of the optical spectrum analyzers sold across the world. The market sizing encompasses the revenue generated through optical spectrum analyzers or systems sold by various market players. The study also tracks the key market parameters, underlying growth influencers, and major vendors operating in the industry, which supports the market estimations and growth rates over the forecast period. Furthermore, the study analyzes the overall impact of COVID-19 on the market ecosystem. The scope of the report encompasses the market sizing and forecast, as well as segmentation by type, end-user industry, and geography.
| By Type | |
| Portable | |
| Handheld | |
| Benchtop |
| By End-user Industry | |
| Telecommunication | |
| Healthcare | |
| Consumer Electronics | |
| Other End-user Industry |
| By Geography | |
| North America | |
| Europe | |
| Asia-Pacific | |
| Latin America | |
| Middle-East and Africa |
Optical Spectrum Analyzer (OSA) Market Research FAQs
How big is the Optical Spectrum Analyzer (OSA) Market?
The Optical Spectrum Analyzer (OSA) Market size is expected to reach USD 314.65 million in 2024 and grow at a CAGR of 7.39% to reach USD 449.42 million by 2029.
What is the current Optical Spectrum Analyzer (OSA) Market size?
In 2024, the Optical Spectrum Analyzer (OSA) Market size is expected to reach USD 314.65 million.
Who are the key players in Optical Spectrum Analyzer (OSA) Market?
Yokogawa Test & Measurement Corporation, Thorlabs Inc., VIAVI Solutions, EXFO Inc. and Anritsu Corporation are the major companies operating in the Optical Spectrum Analyzer (OSA) Market.
Which is the fastest growing region in Optical Spectrum Analyzer (OSA) Market?
Asia Pacific is estimated to grow at the highest CAGR over the forecast period (2024-2029).
Which region has the biggest share in Optical Spectrum Analyzer (OSA) Market?
In 2024, the North America accounts for the largest market share in Optical Spectrum Analyzer (OSA) Market.
What years does this Optical Spectrum Analyzer (OSA) Market cover, and what was the market size in 2023?
In 2023, the Optical Spectrum Analyzer (OSA) Market size was estimated at USD 293 million. The report covers the Optical Spectrum Analyzer (OSA) Market historical market size for years: 2019, 2020, 2021, 2022 and 2023. The report also forecasts the Optical Spectrum Analyzer (OSA) Market size for years: 2024, 2025, 2026, 2027, 2028 and 2029.
Optical Spectrum Analyzer Industry Report
Statistics for the 2024 Optical Spectrum Analyzer market share, size and revenue growth rate, created by Mordor Intelligence™ Industry Reports. Optical Spectrum Analyzer analysis includes a market forecast outlook to 2029 and historical overview. Get a sample of this industry analysis as a free report PDF download.
