MEA Micronutrient Fertilizer Market Size

| Icons | Lable | Value |
|---|---|---|
|
|
Study Period | 2016 - 2030 |
|
|
Market Size (2024) | USD 262.99 Million |
|
|
Market Size (2030) | USD 404.11 Million |
|
|
Largest Share by Product | Zinc |
|
|
CAGR (2024 - 2030) | 7.42 % |
|
|
Largest Share by Country | Nigeria |
Major Players |
||
|
|
||
|
*Disclaimer: Major Players sorted in no particular order |
MEA Micronutrient Fertilizer Market Analysis
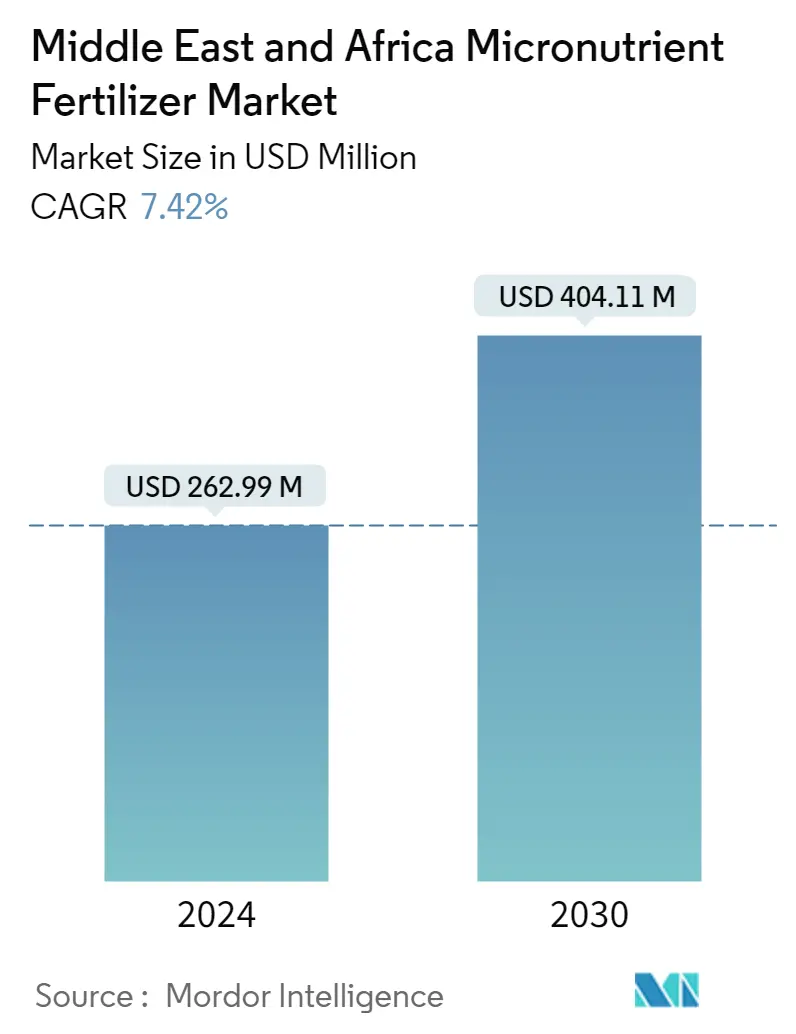
The Middle East & Africa Micronutrient Fertilizer Market size is estimated at USD 262.99 million in 2024, and is expected to reach USD 404.11 million by 2030, growing at a CAGR of 7.42% during the forecast period (2024-2030).
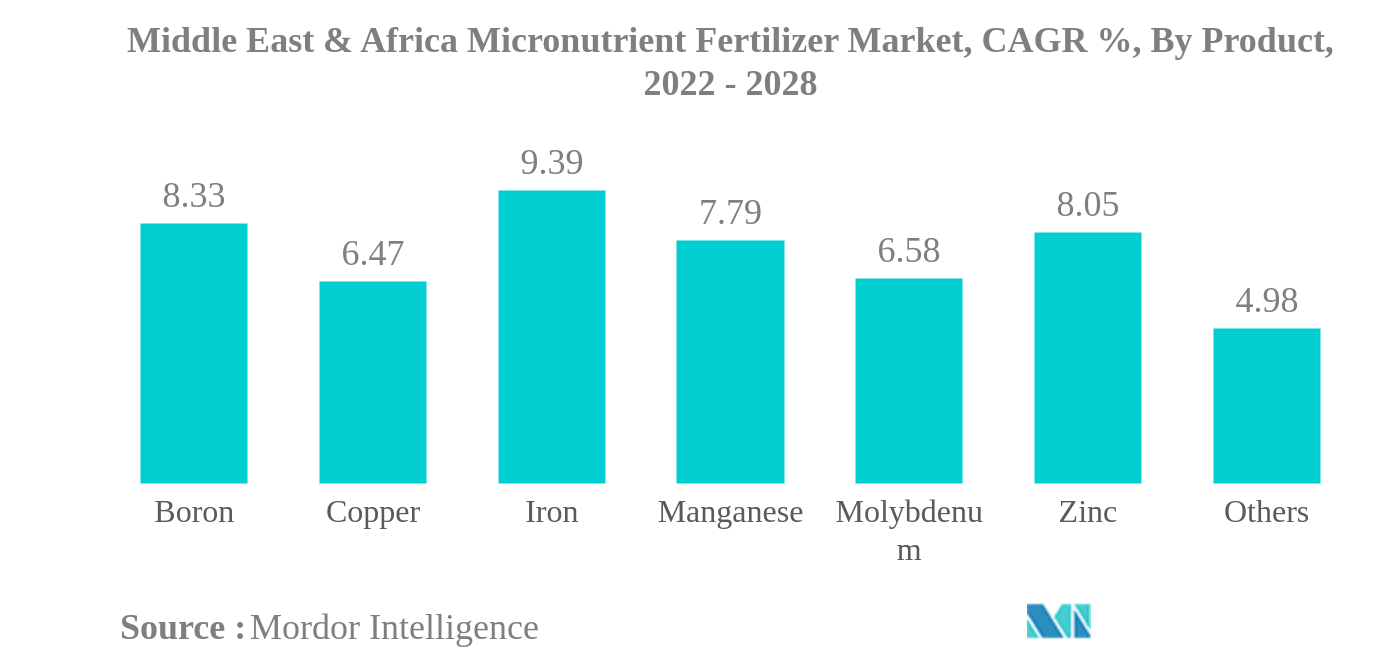
- Largest Segment by Type - Zinc : Many Soils of Middle east and Africa are deficient to Zinc, and its application is proven to increase the crop yields and grain size, making it the most consumed micronutrient
- Fastest growing segment by Type - Iron : The alkaline soils with high pH and degrading health and quality of soils are making them deficient in Iron thus increasing the demand for high-yield crop production.
- Largest Segment by Crop Type - Field Crops : Cultivation of field crops accounts for more than 90% of the total agricultural land in the region and accounts for highest consumption of 87.6% of the micronutrient fertilizes.
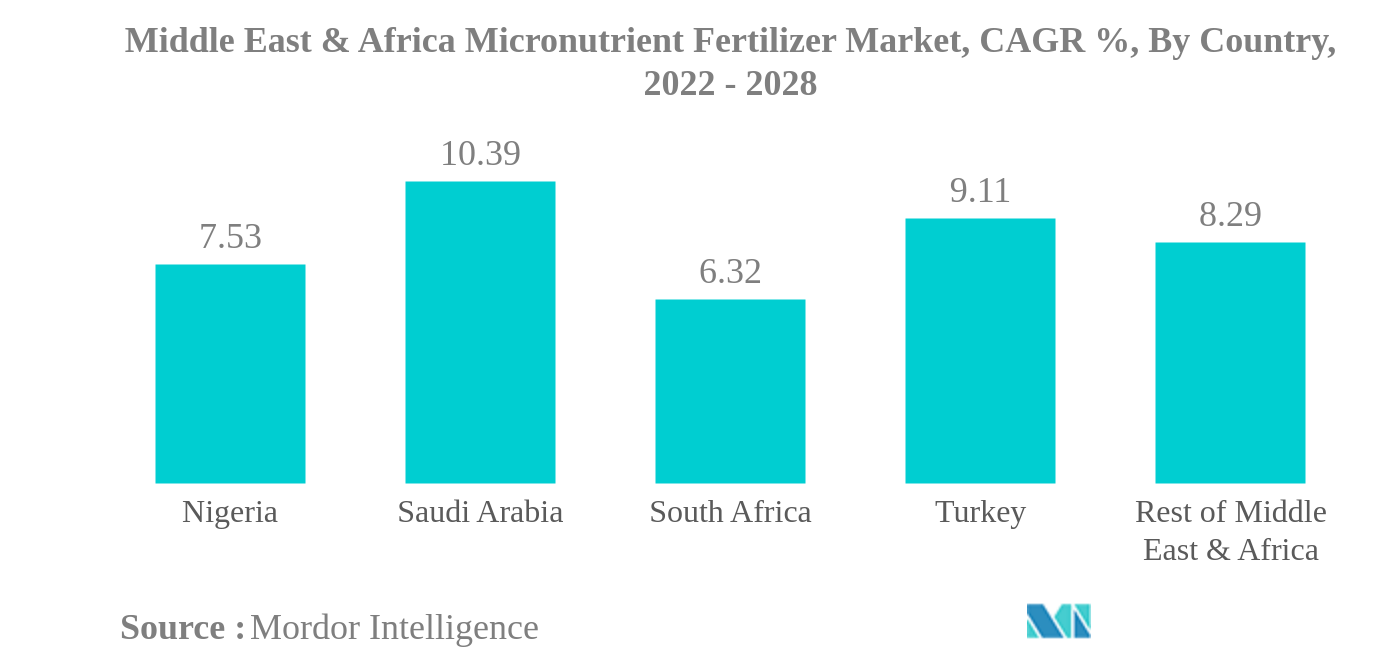
- Largest segment by Country - Nigeria : Nigeria has large agricultural area in the region, it acccounts for about 35% of the total crop area in the region and has some of the largest fertilizer production units.
MEA Micronutrient Fertilizer Market Trends
This section covers the major market trends shaping the MEA Micronutrient Fertilizer Market according to our research experts:
Zinc is the largest segment by Product.
- The overall micronutrient market in the region is estimated to grow, registering a CAGR of 4.7% during the forecast period. Micronutrient deficiency is widespread across the region, with iron and zinc deficiencies becoming a rising concern for plant health. This results in an increasing demand for micronutrient fertilizers to promote plant growth.
- Iron and zinc dominated the market with 49% and 21% of the market value in 2021, respectively. Soil deficiencies of the micronutrients that are essential for plant growth can lead to lower crop yields. During the past decade, soil micronutrient deficiencies have been noticed primarily for iron and zinc and, to a lesser extent, boron (9%) and manganese(12%).
- Micronutrient deficiencies are frequently observed in intensively-grown cereals, oilseeds, pulses, and vegetable crops in the region. Hence, in order to obtain quality products and better yields, farmers tend to adopt the use of micronutrients in their crops, such as field crops, which was the largest market for micronutrients in 2021, accounting for 88.0% of the market value.
- The increasing micronutrient deficiency in the soil seems to be one of the major factors causing a decline in yields. The African soils are also deficient in secondary and micronutrients, such as sulfur, zinc, boron, and copper. Supplying these nutrients through balanced fertilizers helps to boost yields intensely while sustaining the soil, which is anticipated to drive the market during the forecast period.
Nigeria is the largest segment by Country.
- The Middle East & African micronutrient fertilizer market accounts for about 2.5% of the global micronutrient fertilizer market, valued at about 997.5 million USD in 2021. Despite water scarcity and higher temperatures, many countries in the region are dependent on agriculture. Nigeria, Saudi Arabia, and Egypt are some of the major agricultural producers in the region.
- Nigeria is the largest agricultural producer in the region. According to FAO, Nigeria had 70.8 million hectares of agricultural land area, with maize, cassava, guinea corn, yam beans, millet, and rice being the major crops in 2019. Nigeria accounted for 44.46% of the Middle East & African micronutrient fertilizers market in 2021.
- The Rest of Middle East & Africa segment is one of the largest markets for micronutrient fertilizers in the region. It accounted for about 50.32% of the micronutrient fertilizer market value in the region, valued at about USD 501.94 million in 2021. The major agricultural producers in the Rest of Middle East & Africa are Egypt, Algeria, Morocco, and Iraq.
- Among micronutrient fertilizers, zinc is the mostly applied micronutrient throughout the region, as zinc deficiency is a severe problem in the region, particularly in countries like Turkey, Nigeria, and Saudi Arabia. Zinc alone accounts for about 49% of the total micronutrient fertilizer market value, valued at about USD 492.43 million in 2021.
- The deficiency of micronutrients in the overall agriculture area drives the micronutrient fertilizer market in the region.
MEA Micronutrient Fertilizer Industry Overview
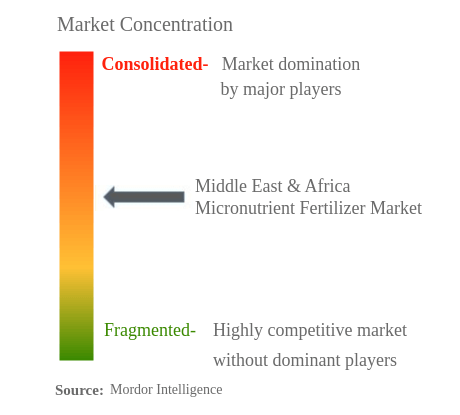
The Middle East & Africa Micronutrient Fertilizer Market is moderately consolidated, with the top five companies occupying 47.58%. The major players in this market are Gavilon South Africa, ICL GROUP LTD, Kynoch Fertilizer, Unikeyterra Chemical and Yara International ASA, (sorted alphabetically).
MEA Micronutrient Fertilizer Market Leaders
Gavilon South Africa
ICL GROUP LTD
Kynoch Fertilizer
Unikeyterra Chemical
Yara International ASA,
*Disclaimer: Major Players sorted in no particular order
MEA Micronutrient Fertilizer Market News
- April 2019: Kynoch announced Mergers & Acquisitions of Profert Fertilizer a major role player in the granular and liquid fertilizer industry. This transaction will give Kynoch access to new markets and additional production resources, ultimately contributing to their motto of enhancing efficiency through innovation.
- March 2019: Kynoch Fertilizer, a leading plant nutrient producer and distributor, announced the Mergers & Acquisitions of Sidi Parani to build a substantial position in the fertilizer market in South Africa and Africa.
- February 2017: Yara opened a USD 2.3 million-liquid fertilizer plant in Malmesbury, South Africa. With this investment, the firm expanded its production capacity to exploit the agricultural potential of South Africa and become the leading crop nutrition company in the country.
MEA Micronutrient Fertilizer Market Report - Table of Contents
1. EXECUTIVE SUMMARY & KEY FINDINGS
2. REPORT OFFERS
3. INTRODUCTION
3.1. Study Assumptions & Market Definition
3.2. Scope of the Study
3.3. Research Methodology
4. KEY INDUSTRY TRENDS
4.1. Acreage Of Major Crop Types
4.2. Average Nutrient Application Rates
4.3. Regulatory Framework
4.4. Value Chain & Distribution Channel Analysis
5. MARKET SEGMENTATION
5.1. Product
5.1.1. Boron
5.1.2. Copper
5.1.3. Iron
5.1.4. Manganese
5.1.5. Molybdenum
5.1.6. Zinc
5.1.7. Others
5.2. Application Mode
5.2.1. Fertigation
5.2.2. Foliar
5.2.3. Soil
5.3. Crop Type
5.3.1. Field Crops
5.3.2. Horticultural Crops
5.3.3. Turf & Ornamental
5.4. Country
5.4.1. Nigeria
5.4.2. Saudi Arabia
5.4.3. South Africa
5.4.4. Turkey
5.4.5. Rest Of Middle East & Africa
6. COMPETITIVE LANDSCAPE
6.1. Key Strategic Moves
6.2. Market Share Analysis
6.3. Company Landscape
6.4. Company Profiles
6.4.1. Azra Group AS
6.4.2. Gavilon South Africa
6.4.3. ICL GROUP LTD
6.4.4. Kynoch Fertilizer
6.4.5. Profert
6.4.6. Unikeyterra Chemical
6.4.7. Yara International ASA,
7. KEY STRATEGIC QUESTIONS FOR FERTILIZER CEOS
8. APPENDIX
8.1. Global Overview
8.1.1. Overview
8.1.2. Porter's Five Forces Framework
8.1.3. Global Value Chain Analysis
8.1.4. Market Dynamics (DROs)
8.2. Sources & References
8.3. List of Tables & Figures
8.4. Primary Insights
8.5. Data Pack
8.6. Glossary of Terms
List of Tables & Figures
- Figure 1:
- MIDDLE EAST & AFRICA MARKET, AREA YOY GROWTH RATE, 2016 - 2021
- Figure 2:
- MIDDLE EAST & AFRICA MARKET, AREA YOY GROWTH RATE, 2016 - 2021
- Figure 3:
- MIDDLE EAST & AFRICA MARKET, VOLUME YOY GROWTH RATE, 2021 - 2021
- Figure 4:
- MIDDLE EAST & AFRICA MARKET, VOLUME YOY GROWTH RATE, 2021 - 2021
- Figure 5:
- MIDDLE EAST & AFRICA MICRONUTRIENT FERTILIZER MARKET, VOLUME, METRIC TON, 2016 - 2028
- Figure 6:
- MIDDLE EAST & AFRICA MICRONUTRIENT FERTILIZER MARKET, VALUE, USD, 2016 - 2028
- Figure 7:
- MIDDLE EAST & AFRICA MICRONUTRIENT FERTILIZER MARKET, BY PRODUCT, VOLUME, METRIC TON, 2016 - 2028
- Figure 8:
- MIDDLE EAST & AFRICA MICRONUTRIENT FERTILIZER MARKET, BY PRODUCT, VALUE, USD, 2016 - 2028
- Figure 9:
- MIDDLE EAST & AFRICA MICRONUTRIENT FERTILIZER MARKET, VOLUME SHARE(%), BY PRODUCT, 2016 - 2028
- Figure 10:
- MIDDLE EAST & AFRICA MICRONUTRIENT FERTILIZER MARKET, VALUE SHARE(%), BY PRODUCT, 2016 - 2028
- Figure 11:
- MIDDLE EAST & AFRICA MICRONUTRIENT FERTILIZER MARKET, BY PRODUCT, BORON, METRIC TON, 2016 - 2028
- Figure 12:
- MIDDLE EAST & AFRICA MICRONUTRIENT FERTILIZER MARKET, BY PRODUCT, BORON, USD, 2016 - 2028
- Figure 13:
- MIDDLE EAST & AFRICA MICRONUTRIENT FERTILIZER MARKET, VALUE SHARE(%), BY CROP TYPE, 2016 - 2028
- Figure 14:
- MIDDLE EAST & AFRICA MICRONUTRIENT FERTILIZER MARKET, BY PRODUCT, COPPER, METRIC TON, 2016 - 2028
- Figure 15:
- MIDDLE EAST & AFRICA MICRONUTRIENT FERTILIZER MARKET, BY PRODUCT, COPPER, USD, 2016 - 2028
- Figure 16:
- MIDDLE EAST & AFRICA MICRONUTRIENT FERTILIZER MARKET, VALUE SHARE(%), BY CROP TYPE, 2016 - 2028
- Figure 17:
- MIDDLE EAST & AFRICA MICRONUTRIENT FERTILIZER MARKET, BY PRODUCT, IRON, METRIC TON, 2016 - 2028
- Figure 18:
- MIDDLE EAST & AFRICA MICRONUTRIENT FERTILIZER MARKET, BY PRODUCT, IRON, USD, 2016 - 2028
- Figure 19:
- MIDDLE EAST & AFRICA MICRONUTRIENT FERTILIZER MARKET, VALUE SHARE(%), BY CROP TYPE, 2016 - 2028
- Figure 20:
- MIDDLE EAST & AFRICA MICRONUTRIENT FERTILIZER MARKET, BY PRODUCT, MANGANESE, METRIC TON, 2016 - 2028
- Figure 21:
- MIDDLE EAST & AFRICA MICRONUTRIENT FERTILIZER MARKET, BY PRODUCT, MANGANESE, USD, 2016 - 2028
- Figure 22:
- MIDDLE EAST & AFRICA MICRONUTRIENT FERTILIZER MARKET, VALUE SHARE(%), BY CROP TYPE, 2016 - 2028
- Figure 23:
- MIDDLE EAST & AFRICA MICRONUTRIENT FERTILIZER MARKET, BY PRODUCT, MOLYBDENUM, METRIC TON, 2016 - 2028
- Figure 24:
- MIDDLE EAST & AFRICA MICRONUTRIENT FERTILIZER MARKET, BY PRODUCT, MOLYBDENUM, USD, 2016 - 2028
- Figure 25:
- MIDDLE EAST & AFRICA MICRONUTRIENT FERTILIZER MARKET, VALUE SHARE(%), BY CROP TYPE, 2016 - 2028
- Figure 26:
- MIDDLE EAST & AFRICA MICRONUTRIENT FERTILIZER MARKET, BY PRODUCT, ZINC, METRIC TON, 2016 - 2028
- Figure 27:
- MIDDLE EAST & AFRICA MICRONUTRIENT FERTILIZER MARKET, BY PRODUCT, ZINC, USD, 2016 - 2028
- Figure 28:
- MIDDLE EAST & AFRICA MICRONUTRIENT FERTILIZER MARKET, VALUE SHARE(%), BY CROP TYPE, 2016 - 2028
- Figure 29:
- MIDDLE EAST & AFRICA MICRONUTRIENT FERTILIZER MARKET, BY PRODUCT, OTHERS, METRIC TON, 2016 - 2028
- Figure 30:
- MIDDLE EAST & AFRICA MICRONUTRIENT FERTILIZER MARKET, BY PRODUCT, OTHERS, USD, 2016 - 2028
- Figure 31:
- MIDDLE EAST & AFRICA MICRONUTRIENT FERTILIZER MARKET, VALUE SHARE(%), BY CROP TYPE, 2016 - 2028
- Figure 32:
- MIDDLE EAST & AFRICA MICRONUTRIENT FERTILIZER MARKET, BY APPLICATION MODE, VOLUME, METRIC TON, 2016 - 2028
- Figure 33:
- MIDDLE EAST & AFRICA MICRONUTRIENT FERTILIZER MARKET, BY APPLICATION MODE, VALUE, USD, 2016 - 2028
- Figure 34:
- MIDDLE EAST & AFRICA MICRONUTRIENT FERTILIZER MARKET, VOLUME SHARE(%), BY APPLICATION MODE, 2016 - 2028
- Figure 35:
- MIDDLE EAST & AFRICA MICRONUTRIENT FERTILIZER MARKET, VALUE SHARE(%), BY APPLICATION MODE, 2016 - 2028
- Figure 36:
- MIDDLE EAST & AFRICA MICRONUTRIENT FERTILIZER MARKET, BY APPLICATION MODE, FERTIGATION, METRIC TON, 2016 - 2028
- Figure 37:
- MIDDLE EAST & AFRICA MICRONUTRIENT FERTILIZER MARKET, BY APPLICATION MODE, FERTIGATION, USD, 2016 - 2028
- Figure 38:
- MIDDLE EAST & AFRICA MICRONUTRIENT FERTILIZER MARKET, VALUE SHARE(%), BY CROP TYPE, 2016 - 2028
- Figure 39:
- MIDDLE EAST & AFRICA MICRONUTRIENT FERTILIZER MARKET, BY APPLICATION MODE, FOLIAR, METRIC TON, 2016 - 2028
- Figure 40:
- MIDDLE EAST & AFRICA MICRONUTRIENT FERTILIZER MARKET, BY APPLICATION MODE, FOLIAR, USD, 2016 - 2028
- Figure 41:
- MIDDLE EAST & AFRICA MICRONUTRIENT FERTILIZER MARKET, VALUE SHARE(%), BY CROP TYPE, 2016 - 2028
- Figure 42:
- MIDDLE EAST & AFRICA MICRONUTRIENT FERTILIZER MARKET, BY APPLICATION MODE, SOIL, METRIC TON, 2016 - 2028
- Figure 43:
- MIDDLE EAST & AFRICA MICRONUTRIENT FERTILIZER MARKET, BY APPLICATION MODE, SOIL, USD, 2016 - 2028
- Figure 44:
- MIDDLE EAST & AFRICA MICRONUTRIENT FERTILIZER MARKET, VALUE SHARE(%), BY CROP TYPE, 2016 - 2028
- Figure 45:
- MIDDLE EAST & AFRICA MICRONUTRIENT FERTILIZER MARKET, BY CROP TYPE, VOLUME, METRIC TON, 2016 - 2028
- Figure 46:
- MIDDLE EAST & AFRICA MICRONUTRIENT FERTILIZER MARKET, BY CROP TYPE, VALUE, USD, 2016 - 2028
- Figure 47:
- MIDDLE EAST & AFRICA MICRONUTRIENT FERTILIZER MARKET, VOLUME SHARE(%), BY CROP TYPE, 2016 - 2028
- Figure 48:
- MIDDLE EAST & AFRICA MICRONUTRIENT FERTILIZER MARKET, VALUE SHARE(%), BY CROP TYPE, 2016 - 2028
- Figure 49:
- MIDDLE EAST & AFRICA MICRONUTRIENT FERTILIZER MARKET, BY CROP TYPE, FIELD CROPS, METRIC TON, 2016 - 2028
- Figure 50:
- MIDDLE EAST & AFRICA MICRONUTRIENT FERTILIZER MARKET, BY CROP TYPE, FIELD CROPS, USD, 2016 - 2028
- Figure 51:
- MIDDLE EAST & AFRICA MICRONUTRIENT FERTILIZER MARKET, VALUE SHARE(%), BY PRODUCT, 2016 - 2028
- Figure 52:
- MIDDLE EAST & AFRICA MICRONUTRIENT FERTILIZER MARKET, BY CROP TYPE, HORTICULTURAL CROPS, METRIC TON, 2016 - 2028
- Figure 53:
- MIDDLE EAST & AFRICA MICRONUTRIENT FERTILIZER MARKET, BY CROP TYPE, HORTICULTURAL CROPS, USD, 2016 - 2028
- Figure 54:
- MIDDLE EAST & AFRICA MICRONUTRIENT FERTILIZER MARKET, VALUE SHARE(%), BY PRODUCT, 2016 - 2028
- Figure 55:
- MIDDLE EAST & AFRICA MICRONUTRIENT FERTILIZER MARKET, BY CROP TYPE, TURF & ORNAMENTAL, METRIC TON, 2016 - 2028
- Figure 56:
- MIDDLE EAST & AFRICA MICRONUTRIENT FERTILIZER MARKET, BY CROP TYPE, TURF & ORNAMENTAL, USD, 2016 - 2028
- Figure 57:
- MIDDLE EAST & AFRICA MICRONUTRIENT FERTILIZER MARKET, VALUE SHARE(%), BY PRODUCT, 2016 - 2028
- Figure 58:
- MIDDLE EAST & AFRICA MICRONUTRIENT FERTILIZER MARKET, BY COUNTRY, VOLUME, METRIC TON, 2016 - 2028
- Figure 59:
- MIDDLE EAST & AFRICA MICRONUTRIENT FERTILIZER MARKET, BY COUNTRY, VALUE, USD, 2016 - 2028
- Figure 60:
- MIDDLE EAST & AFRICA MICRONUTRIENT FERTILIZER MARKET, VOLUME SHARE(%), BY COUNTRY, 2016 - 2028
- Figure 61:
- MIDDLE EAST & AFRICA MICRONUTRIENT FERTILIZER MARKET, VALUE SHARE(%), BY COUNTRY, 2016 - 2028
- Figure 62:
- MIDDLE EAST & AFRICA MICRONUTRIENT FERTILIZER MARKET, BY COUNTRY, NIGERIA, METRIC TON, 2016 - 2028
- Figure 63:
- MIDDLE EAST & AFRICA MICRONUTRIENT FERTILIZER MARKET, BY COUNTRY, NIGERIA, USD, 2016 - 2028
- Figure 64:
- MIDDLE EAST & AFRICA MICRONUTRIENT FERTILIZER MARKET, VALUE SHARE(%), BY CROP TYPE, 2016 - 2028
- Figure 65:
- MIDDLE EAST & AFRICA MICRONUTRIENT FERTILIZER MARKET, BY COUNTRY, SAUDI ARABIA, METRIC TON, 2016 - 2028
- Figure 66:
- MIDDLE EAST & AFRICA MICRONUTRIENT FERTILIZER MARKET, BY COUNTRY, SAUDI ARABIA, USD, 2016 - 2028
- Figure 67:
- MIDDLE EAST & AFRICA MICRONUTRIENT FERTILIZER MARKET, VALUE SHARE(%), BY CROP TYPE, 2016 - 2028
- Figure 68:
- MIDDLE EAST & AFRICA MICRONUTRIENT FERTILIZER MARKET, BY COUNTRY, SOUTH AFRICA, METRIC TON, 2016 - 2028
- Figure 69:
- MIDDLE EAST & AFRICA MICRONUTRIENT FERTILIZER MARKET, BY COUNTRY, SOUTH AFRICA, USD, 2016 - 2028
- Figure 70:
- MIDDLE EAST & AFRICA MICRONUTRIENT FERTILIZER MARKET, VALUE SHARE(%), BY CROP TYPE, 2016 - 2028
- Figure 71:
- MIDDLE EAST & AFRICA MICRONUTRIENT FERTILIZER MARKET, BY COUNTRY, TURKEY, METRIC TON, 2016 - 2028
- Figure 72:
- MIDDLE EAST & AFRICA MICRONUTRIENT FERTILIZER MARKET, BY COUNTRY, TURKEY, USD, 2016 - 2028
- Figure 73:
- MIDDLE EAST & AFRICA MICRONUTRIENT FERTILIZER MARKET, VALUE SHARE(%), BY CROP TYPE, 2016 - 2028
- Figure 74:
- MIDDLE EAST & AFRICA MICRONUTRIENT FERTILIZER MARKET, BY COUNTRY, REST OF MIDDLE EAST & AFRICA, METRIC TON, 2016 - 2028
- Figure 75:
- MIDDLE EAST & AFRICA MICRONUTRIENT FERTILIZER MARKET, BY COUNTRY, REST OF MIDDLE EAST & AFRICA, USD, 2016 - 2028
- Figure 76:
- MIDDLE EAST & AFRICA MICRONUTRIENT FERTILIZER MARKET, VALUE SHARE(%), BY CROP TYPE, 2016 - 2028
- Figure 77:
- MIDDLE EAST & AFRICA MICRONUTRIENT FERTILIZER MARKET, MOST ACTIVE COMPANIES, BY NUMBER OF STRATEGIC MOVES, 2018 - 2021
- Figure 78:
- MIDDLE EAST & AFRICA MICRONUTRIENT FERTILIZER MARKET, MOST ADOPTED STRATEGIES, 2018 - 2021
- Figure 79:
- MIDDLE EAST & AFRICA MICRONUTRIENT FERTILIZER MARKET SHARE(%), BY MAJOR PLAYERS, 2021
MEA Micronutrient Fertilizer Industry Segmentation
Boron, Copper, Iron, Manganese, Molybdenum, Zinc, Others are covered as segments by Product. Fertigation, Foliar, Soil are covered as segments by Application Mode. Field Crops, Horticultural Crops, Turf & Ornamental are covered as segments by Crop Type. Nigeria, Saudi Arabia, South Africa, Turkey are covered as segments by Country.| Product | |
| Boron | |
| Copper | |
| Iron | |
| Manganese | |
| Molybdenum | |
| Zinc | |
| Others |
| Application Mode | |
| Fertigation | |
| Foliar | |
| Soil |
| Crop Type | |
| Field Crops | |
| Horticultural Crops | |
| Turf & Ornamental |
| Country | |
| Nigeria | |
| Saudi Arabia | |
| South Africa | |
| Turkey | |
| Rest Of Middle East & Africa |
Market Definition
- AVERAGE NUTRIENT APPLICATION RATE - This refers to the average volume of nutrient consumed per hectare of farmland in each country.
- CROP TYPES COVERED - Field Crops: Cereals, Pulses, Oilseeds, Fiber Crops, and Forage Crops, Horticulture: Fruits, Vegetables, Plantation Crops and Spices, Turf Grass and Ornamentals
- MARKET ESTIMATION LEVEL - Market Estimations for various types of fertilizers has been done at the product-level and not at the nutrient-level.
- NUTRIENT TYPES COVERED - Micronutients: Zn, Mn, Cu, Fe, Mo, B, and Others
Research Methodology
Mordor Intelligence follows a four-step methodology in all our reports.
- Step-1: Identify Key Variables: In order to build a robust forecasting methodology, the variables and factors identified in Step-1 are tested against available historical market numbers. Through an iterative process, the variables required for market forecast are set and the model is built on the basis of these variables.
- Step-2: Build a Market Model: Market-size estimations for the forecast years are in nominal terms. Inflation is not a part of the pricing, and the average selling price (ASP) is kept constant throughout the forecast period for each country.
- Step-3: Validate and Finalize: In this important step, all market numbers, variables and analyst calls are validated through an extensive network of primary research experts from the market studied. The respondents are selected across levels and functions to generate a holistic picture of the market studied.
- Step-4: Research Outputs: Syndicated Reports, Custom Consulting Assignments, Databases & Subscription Platforms


