Rare Earth Elements Market Size
| Study Period | 2019-2029 |
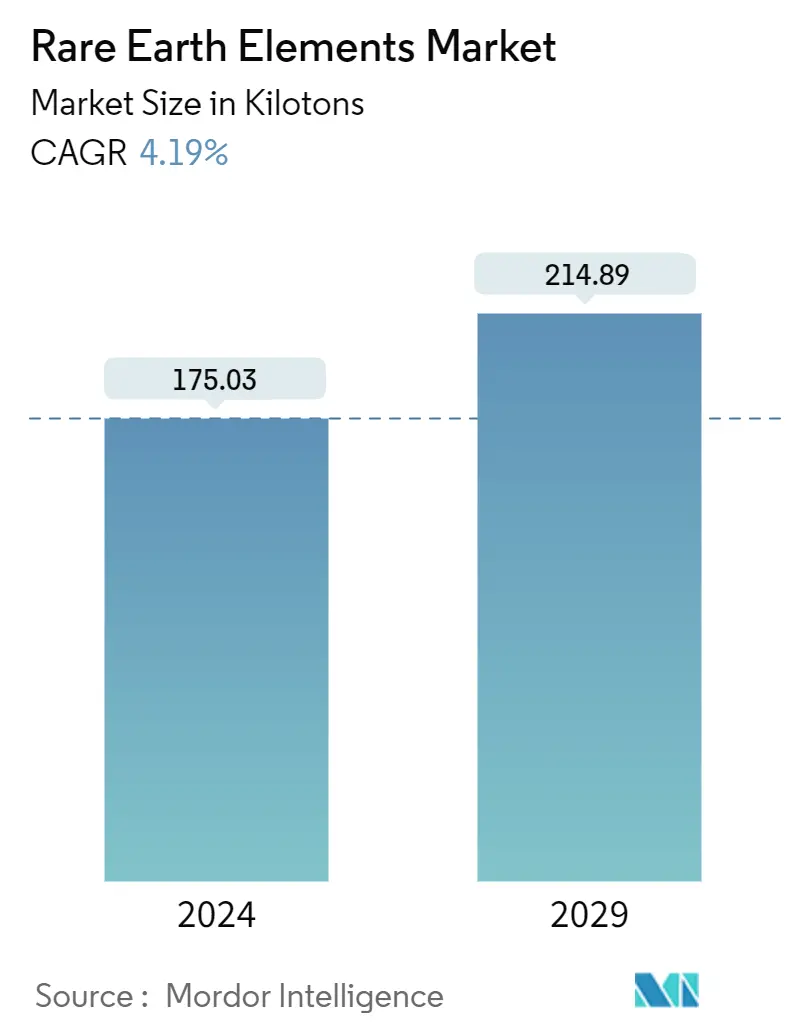
| Market Volume (2024) | 175.03 kilotons |
| Market Volume (2029) | 214.89 kilotons |
| CAGR (2024 - 2029) | 4.19 % |
| Fastest Growing Market | Asia-Pacific |
| Largest Market | Asia-Pacific |
Major Players
*Disclaimer: Major Players sorted in no particular order |
Need a report that reflects how COVID-19 has impacted this market and its growth?
Rare Earth Elements Market Analysis
The Rare Earth Elements Market size is estimated at 175.03 kilotons in 2024, and is expected to reach 214.89 kilotons by 2029, growing at a CAGR of 4.19% during the forecast period (2024-2029).
COVID-19 negatively impacted the demand for rare earth elements as the global demand witnessed a slowdown following stringent containment restrictions for a long time. However, the situation gradually improved in 2021 with the global economy's revival and industrial activities' resumption.
- The factors driving the market's growth are the high demand from emerging economies and dependency on "Green Technology" on rare Earth elements.
- On the flip side, an inconsistent supply of rare earth elements may act as a barrier to the market's growth.
- The increasing scandium usage in aerospace applications will likely provide opportunities for the market during the forecast period.
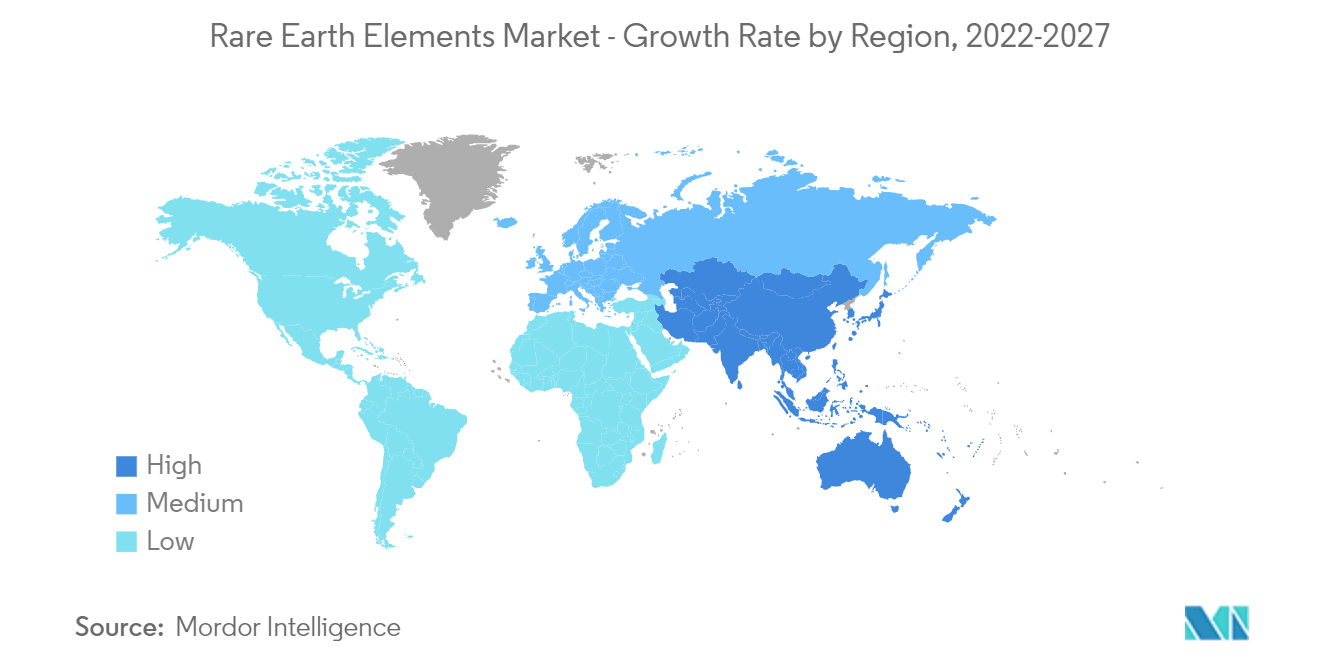
- Asia-Pacific dominated the global market, owing to the increasing production of rare Earth metals and rising demand from industries such as consumer electronics.
Rare Earth Elements Market Trends
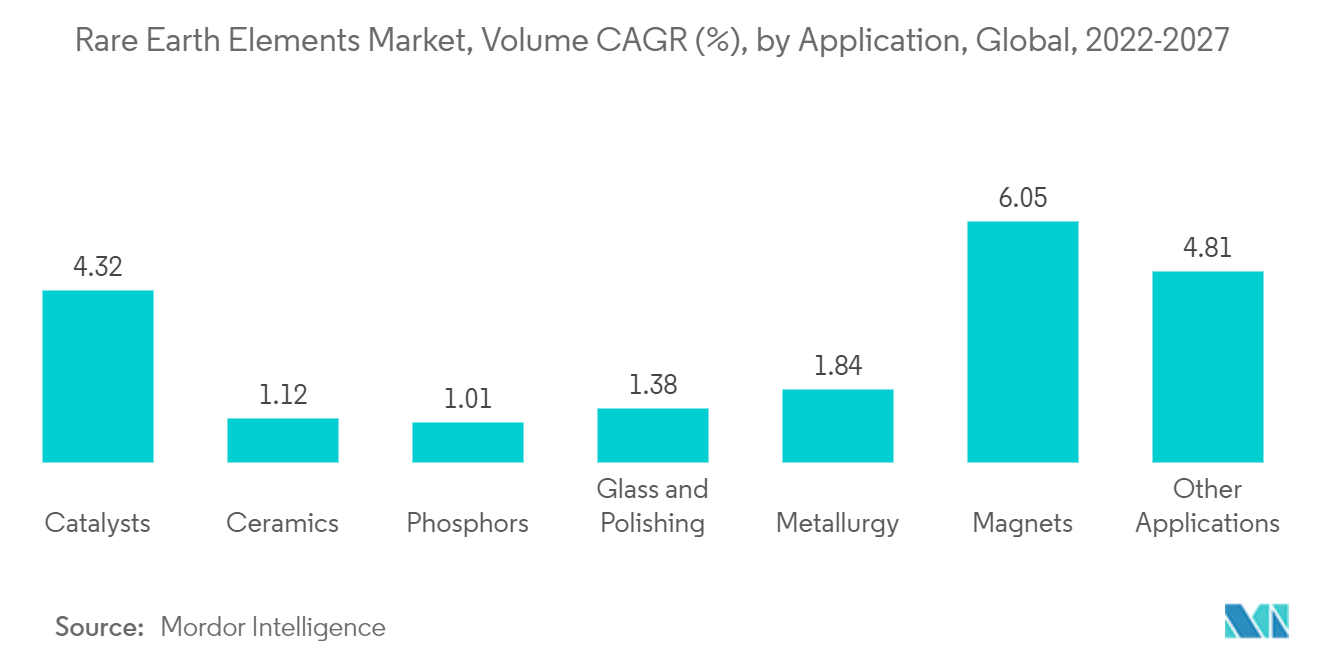
Increasing Demand for Magnets
- Magnets stand to be one of the largest applications for rare earth elements. Magnets find extensive applications in various industries, such as electronics, automotive, power generation, and medical.
- Magnets are used in computer hard drives, microwave power tubes, anti-lock brakes, automotive parts, disk drive motors, frictionless bearings, power generation, magnetic refrigeration, microphones and speakers, communication systems, and MRI.
- Industries such as automotive, electronics, and healthcare have witnessed innovation and development, driving the demand for magnets.
- In 2021, approximately 85% of automakers were using neodymium-incorporated permanent magnet motors, and there are projections that the automotive demand for rare earth will rise by 25% in 2022.
- Magnets used for EVs and wind turbines are neodymium, praseodymium, and dysprosium, with samarium and cobalt as potential substitutes, which may further drive the market in the future.
- Additionally, magnets are used in medical equipment, such as MRI machines, pacemakers, sleep apnea machines, and insulin pumps. The healthcare industry has seen considerable investments in Asia-Pacific, the Middle East, and Africa.
- Hence, all such trends are expected to drive the demand for magnets, which is further projected to increase the demand for rare earth elements in the coming years.
The Asia-Pacific Region is Expected to Dominate the Market
- The Asia-Pacific region dominated the global market share. With increasing investments in the healthcare industry and the rising ceramic demand and production, the consumption of rare earth elements is projected to increase noticeably in the region.
- Most of the world's supply of these high-value rare earth elements originates from China, making the global rare earth elements market supply sensitive to changes in China's manufacturing sector. In 2021, 78% of the worldwide production of rare earth elements came from China, as per data from the US Geological Survey.
- According to OICA, the total number of motor vehicles produced in 2021 in China and India was 26.08 million and 4.39 million units, respectively. Thus, motor vehicle production in China grew by 3% and 30% in India compared to the previous year.
- Asia Pacific has been the electronics production base of the world, with investments coming in from several companies establishing their presence in countries like India, Vietnam, and Japan, as the COVID-19 pandemic exposed the supply chain problems with China.
- Rare earth elements contribute a total value of nearly USD 200 billion to the Indian economy. India has the world's fifth-largest reserves of rare earth elements, roughly twice as much as Australia. Still, it imports most of its occasional Earth needs in finished form from its geopolitical rival, China.
- Japan is looking forward to increasing its stockpiles of rare earth minerals. Furthermore, the country is expected to help domestic companies to obtain stakes in overseas mines and to process raw materials into the valuable minerals required for next-generation vehicles, communications equipment, and other cutting-edge technologies. According to UN Comtrade data, Japan slashed rare earth supplies from China from over 90% of imports to 58% within a decade. It aims to bring that below 50% by 2025.
- Furthermore, the demand and production of ceramics are the highest in Asia-Pacific. The increasing ceramic demand from industries such as aerospace and defense, energy, healthcare, and consumer goods is driving the production of ceramics in the region.
- Hence, such market trends will significantly impact the rare Earth elements market in the coming years.
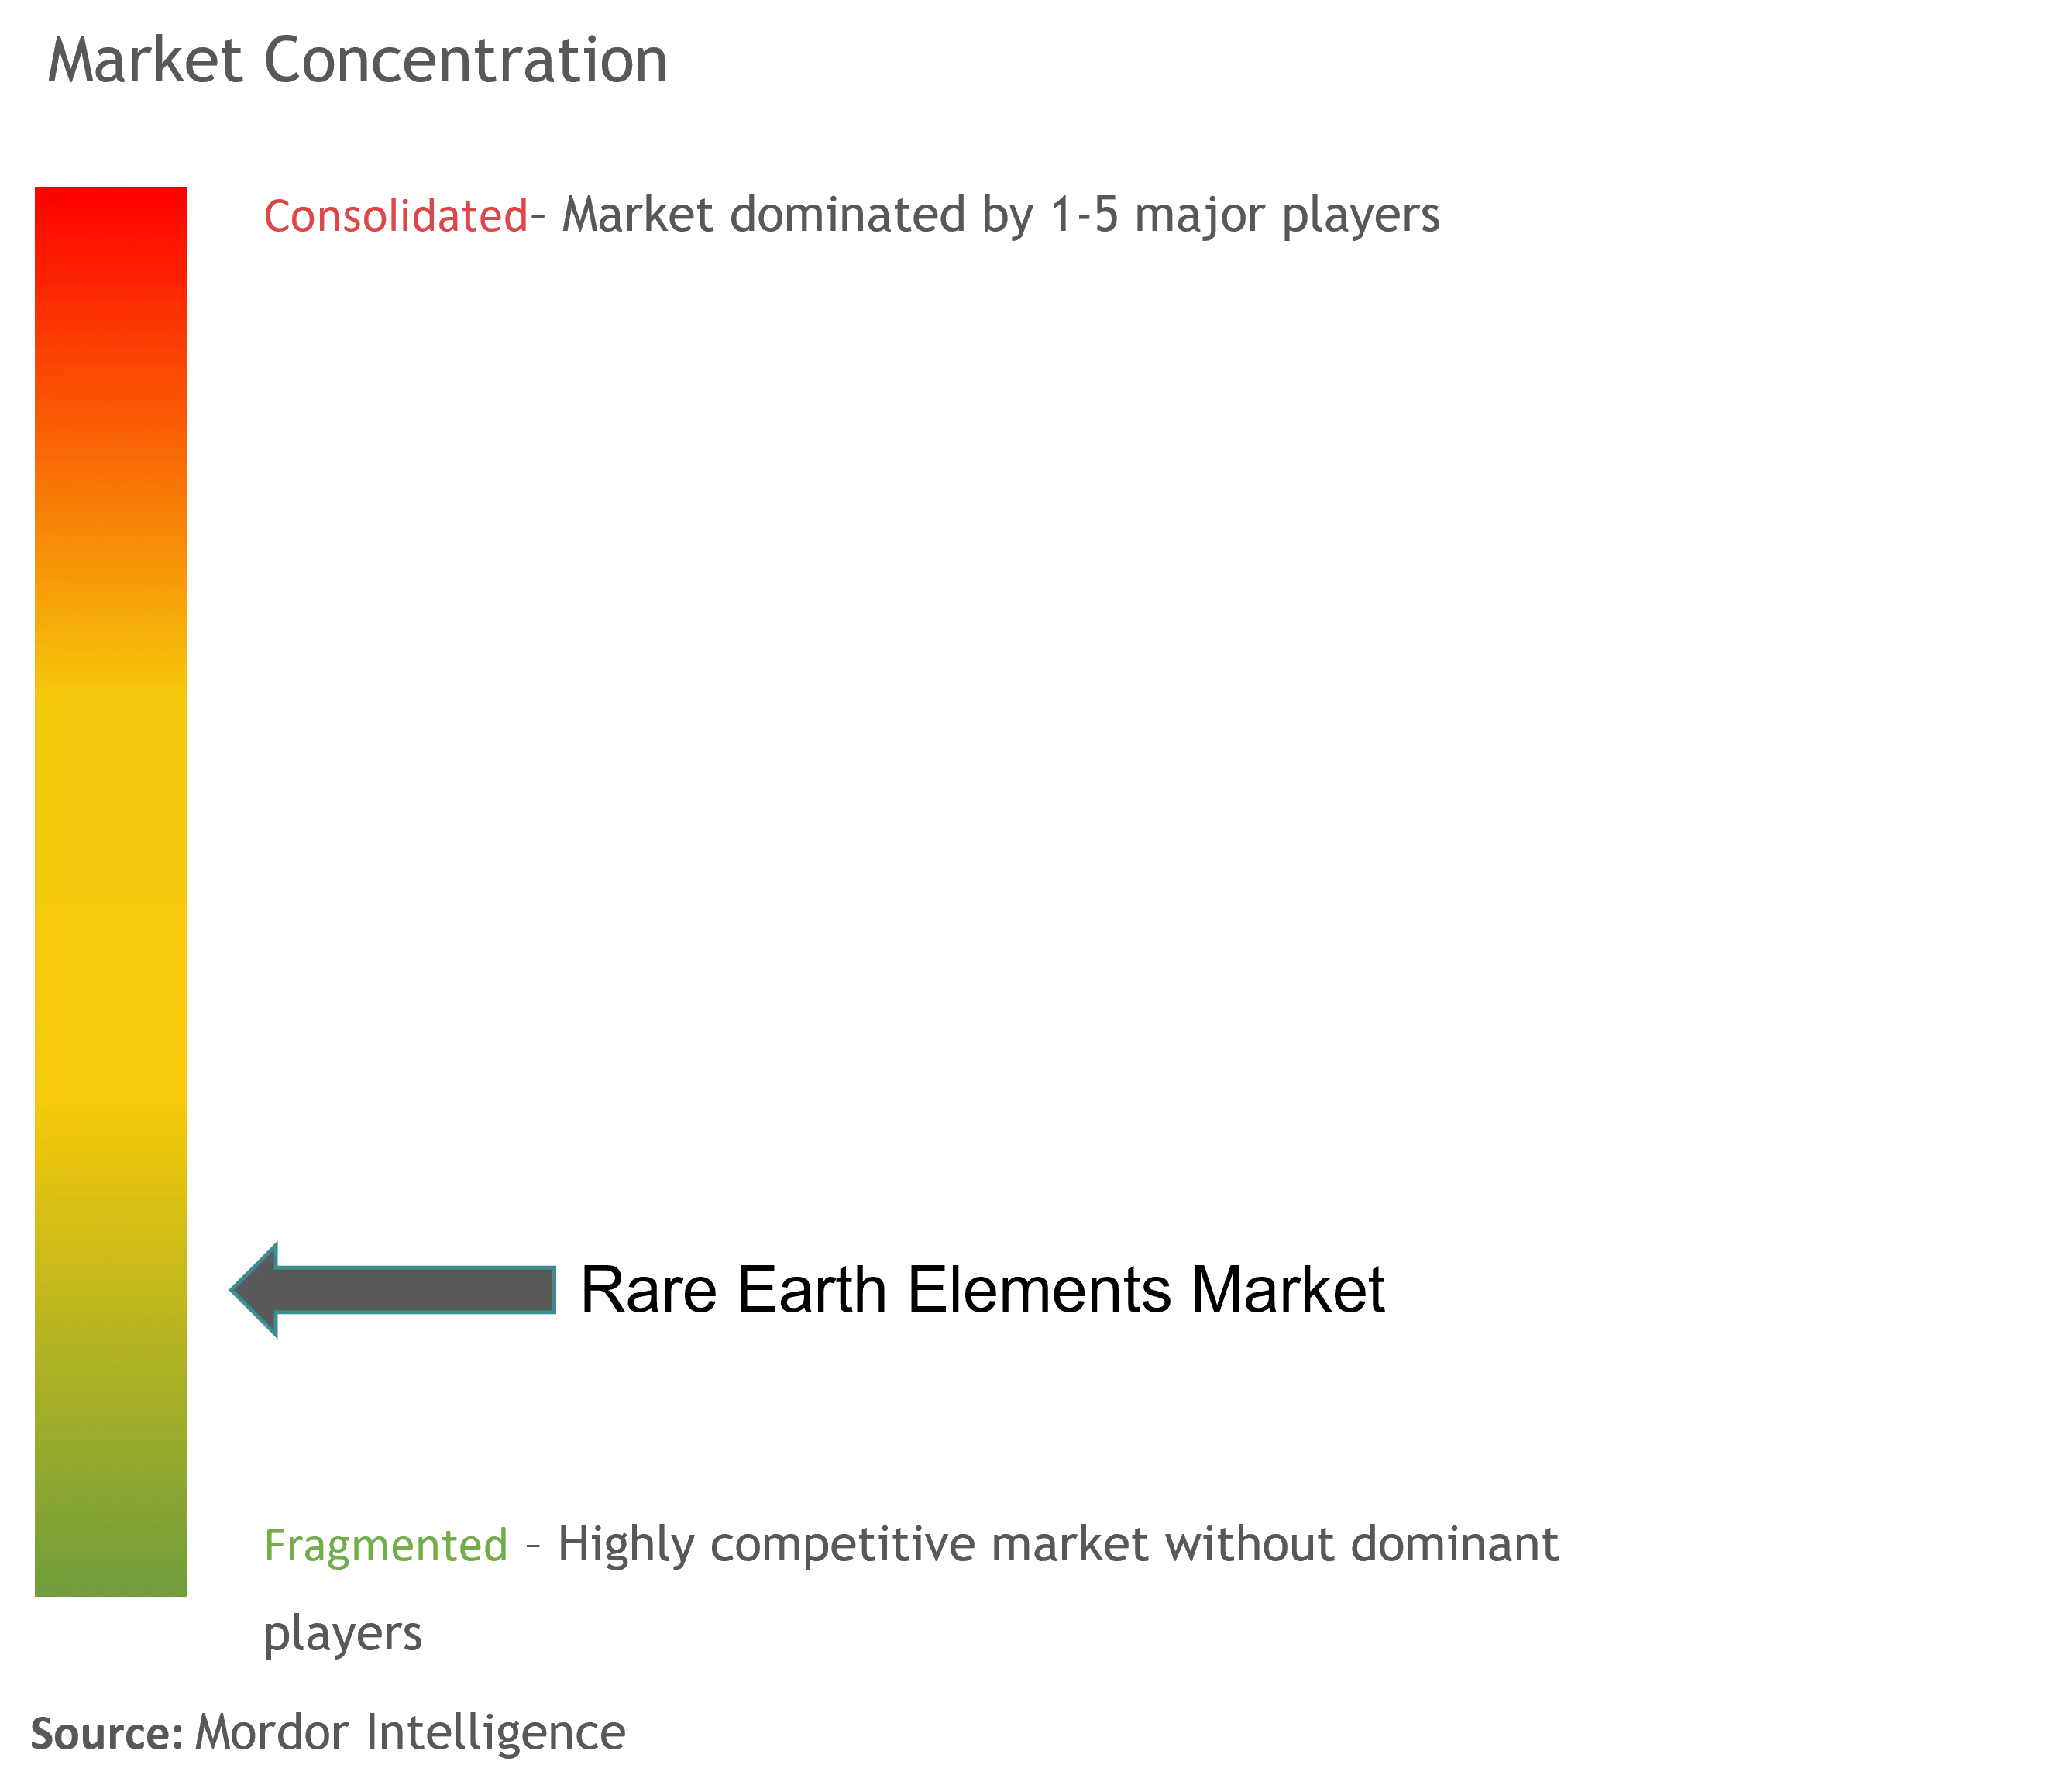
Rare Earth Elements Industry Overview
The rare Earth elements market is fragmented, with numerous players holding insignificant shares to affect the market dynamics individually. Some prominent players in the market include (not in any particular order) Lynas Rare Earths Ltd, Minmetals Land Limited, Aluminum Corporation of China Ltd, Iluka Resources Limited, and Rare Element Resources Limited, among others.
Rare Earth Elements Market Leaders
Iluka Resources Limited
Lynas Rare Earths, Ltd.
Minmetals Land Limited
Rare Elements Resources Ltc.
Aluminum Corporation of China Ltd.
*Disclaimer: Major Players sorted in no particular order
Rare Earth Elements Market News
- August 2022: Australia's Lynas Rare Earths Ltd unveiled a plan to expand capacity at its Western Australia-based Mt Weld mine having deposits of neodymium (Nd) and praseodymium (Pr). The company anticipates expansion work to begin by early 2023, with full operation planned for 2024.
- April 2022: Iluka Resources Ltd announced an investment worth USD 1.2 billion for developing the Eneabba Phase 3 rare earth refinery in Western Australia for the dedicated production of rare Earth oxides. The investment aims to make Iluka a strategic hub for the downstream processing of Australia's rare earth resources.
Rare Earth Elements Market Report - Table of Contents
1. INTRODUCTION
1.1 Study Assumptions
1.2 Scope of the Study
2. RESEARCH METHODOLOGY
3. EXECUTIVE SUMMARY
4. MARKET DYNAMICS
4.1 Drivers
4.1.1 High Demand from Emerging Economies
4.1.2 Dependency of 'Green Technology' on Rare Earth Elements
4.2 Restraints
4.2.1 Inconsistent Supply of Rare Earth Elements
4.3 Industry Value Chain Analysis
4.4 Porter's Five Forces Analysis
4.4.1 Bargaining Power of Suppliers
4.4.2 Bargaining Power of Consumers
4.4.3 Threat of New Entrants
4.4.4 Threat of Substitute Products and Services
4.4.5 Degree of Competition
5. MARKET SEGMENTATION (Market Size in Volume)
5.1 Element
5.1.1 Cerium
5.1.1.1 Oxide
5.1.1.2 Sulfide
5.1.1.3 Other Elements
5.1.2 Neodymium
5.1.2.1 Alloy
5.1.3 Lanthanum
5.1.3.1 Alloy
5.1.3.2 Oxide
5.1.3.3 Other Elements
5.1.4 Dysprosium
5.1.5 Terbium
5.1.6 Yttrium
5.1.7 Scandium
5.1.8 Other Elements
5.2 Application
5.2.1 Catalysts
5.2.2 Ceramics
5.2.3 Phosphors
5.2.4 Glass and Polishing
5.2.5 Metallurgy
5.2.6 Magnets
5.2.7 Other Applications
5.3 Geography
5.3.1 Asia-Pacific
5.3.1.1 China
5.3.1.2 India
5.3.1.3 Japan
5.3.1.4 South Korea
5.3.1.5 Rest of Asia-Pacific
5.3.2 North America
5.3.2.1 United States
5.3.2.2 Canada
5.3.2.3 Mexico
5.3.3 Europe
5.3.3.1 Germany
5.3.3.2 United Kingdom
5.3.3.3 France
5.3.3.4 Italy
5.3.3.5 Rest of Europe
5.3.4 South America
5.3.4.1 Brazil
5.3.4.2 Argentina
5.3.4.3 Rest of South America
5.3.5 Middle East and Africa
5.3.5.1 Saudi Arabia
5.3.5.2 South Africa
5.3.5.3 Rest of Middle East and Africa
6. COMPETITIVE LANDSCAPE
6.1 Mergers and Acquisitions, Joint Ventures, Collaborations, and Agreements
6.2 Market Ranking Analysis
6.3 Strategies Adopted by Leading Players
6.4 Company Profiles
6.4.1 Aluminum Corporation of China Ltd
6.4.2 ARAFURA RESOURCES
6.4.3 Avalon Advanced Materials Inc.
6.4.4 Minmetals Land Limited
6.4.5 China Nonferrous Metal Industry's Foreign Engineering and Construction Co. Ltd
6.4.6 Eutectix
6.4.7 Iluka Resources Limited
6.4.8 Lynas Rare Earths Ltd
6.4.9 MEDALLION RESOURCES LTD
6.4.10 NORTHERN MINERALS
6.4.11 Peak Resources
6.4.12 Rare Element Resources Ltd
6.4.13 Rio Tinto
6.4.14 Shin-Etsu Chemical Co. Ltd
6.4.15 Ucore Rare Metals Inc.
6.4.16 Xiamen Tungsten Co. Ltd
- *List Not Exhaustive
7. MARKET OPPORTUNITIES AND FUTURE TRENDS
7.1 Increasing Scandium Usage in Aerospace Applications
Rare Earth Elements Industry Segmentation
Rare Earth elements are used in loudspeakers, telescope lenses, studio lighting, and computer hard drives to make them smaller and more efficient. They are used in screens and displays as they can produce different colors. Rare Earth elements usually have high electrical conductivity, naturally occurring together in minerals. They are the strongest magnets available today.
The market is segmented by element, application, and geography. By element, the market is segmented into cerium, neodymium, lanthanum, dysprosium, terbium, yttrium and scandium, and other elements. By application, the market is segmented into catalysts, ceramics, phosphors, glass and polishing, metallurgy, magnets, and other applications. The report also covers the market sizes and forecasts for the rare earth elements market in 15 countries across the major regions. For each segment, the market sizing and forecasts have been done based on volume (ton).
| Element | |||||
| |||||
| |||||
| |||||
| Dysprosium | |||||
| Terbium | |||||
| Yttrium | |||||
| Scandium | |||||
| Other Elements |
| Application | |
| Catalysts | |
| Ceramics | |
| Phosphors | |
| Glass and Polishing | |
| Metallurgy | |
| Magnets | |
| Other Applications |
| Geography | |||||||
| |||||||
| |||||||
| |||||||
| |||||||
|
Rare Earth Elements Market Research FAQs
How big is the Rare Earth Elements Market?
The Rare Earth Elements Market size is expected to reach 175.03 kilotons in 2024 and grow at a CAGR of 4.19% to reach 214.89 kilotons by 2029.
What is the current Rare Earth Elements Market size?
In 2024, the Rare Earth Elements Market size is expected to reach 175.03 kilotons.
Who are the key players in Rare Earth Elements Market?
Iluka Resources Limited, Lynas Rare Earths, Ltd., Minmetals Land Limited, Rare Elements Resources Ltc. and Aluminum Corporation of China Ltd. are the major companies operating in the Rare Earth Elements Market.
Which is the fastest growing region in Rare Earth Elements Market?
Asia-Pacific is estimated to grow at the highest CAGR over the forecast period (2024-2029).
Which region has the biggest share in Rare Earth Elements Market?
In 2024, the Asia-Pacific accounts for the largest market share in Rare Earth Elements Market.
What years does this Rare Earth Elements Market cover, and what was the market size in 2023?
In 2023, the Rare Earth Elements Market size was estimated at 167.70 kilotons. The report covers the Rare Earth Elements Market historical market size for years: 2019, 2020, 2021, 2022 and 2023. The report also forecasts the Rare Earth Elements Market size for years: 2024, 2025, 2026, 2027, 2028 and 2029.
What are the factors driving the Rare Earth Elements Market?
The factors driving the Rare Earth Elements Market are a) Miniaturization and increased functionality of electronic devices requiring rare earth elements b) Increasing focus on recycling and responsible sourcing of rare earth elements
Rare Earth Elements Industry Report
The rare earth metals market, particularly in the Asia-Pacific region and China, is projected to experience significant growth due to the increasing use of rare-earth elements in various applications, including the production of permanent magnets, consumer durables such as tablets, laptops, and smartphones, and electric vehicles. However, market growth could be hindered by the high cost of these minerals and the monopoly of China-based manufacturers. Opportunities for recycling and reuse of rare-earth metals present a potential secondary source of supply and positive environmental impact. Mordor Intelligence™ Industry Reports provide statistics for the Rare Earth Elements market share, size, and revenue growth rate, including a market forecast outlook and a historical overview. A sample of this industry analysis is available as a PDF download.
