Biopesticides Market Size

| Icons | Lable | Value |
|---|---|---|
|
|
Study Period | 2017 - 2029 |
|
|
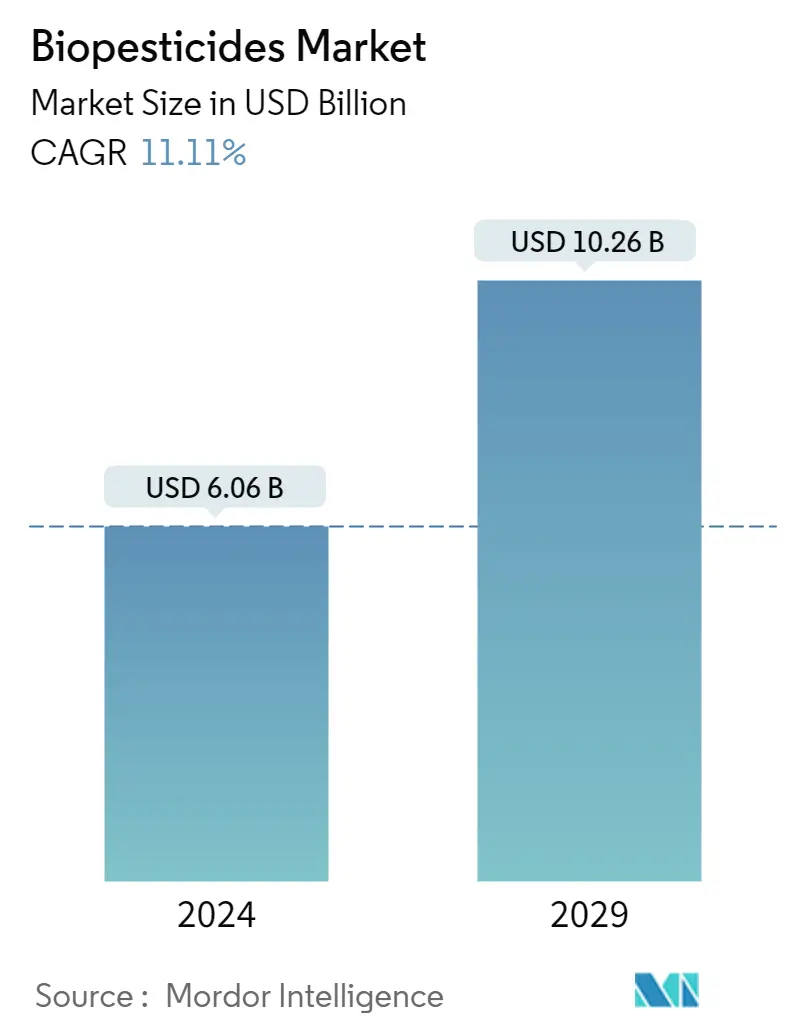
Market Size (2024) | USD 6.06 Billion |
|
|
Market Size (2029) | USD 10.26 Billion |
|
|
Largest Share by Form | Biofungicides |
|
|
CAGR (2024 - 2029) | 11.11 % |
|
|
Largest Share by Region | North America |
Major Players |
||
|
|
||
|
*Disclaimer: Major Players sorted in no particular order |
Biopesticides Market Analysis
The Biopesticides Market size is estimated at USD 6.06 billion in 2024, and is expected to reach USD 10.26 billion by 2029, growing at a CAGR of 11.11% during the forecast period (2024-2029).
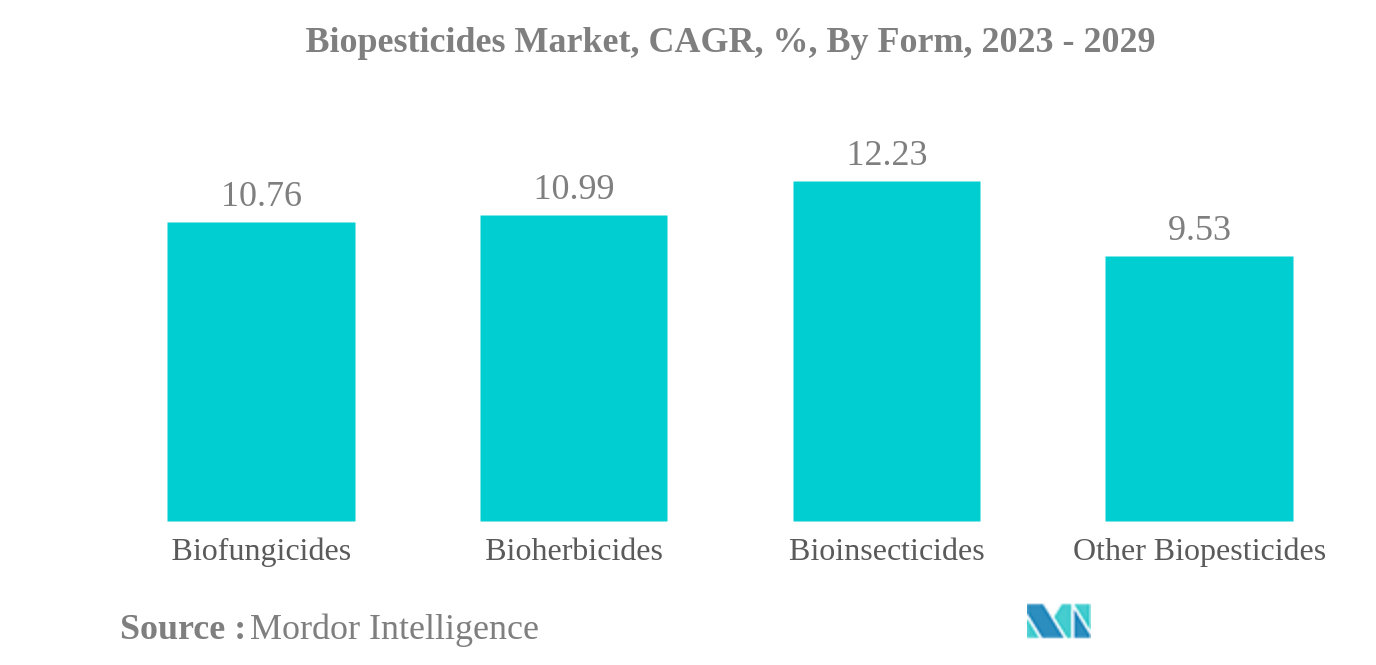
- Biofungicides is the Largest Form. Commercial bio-fungicides available in the market provide protection against various pathogens such as Pythium, Rhizoctonia, Fusarium, Sclerotinia, Thielaviopsis, and Botrytis
- Bioinsecticides is the Fastest-growing Form. The application of Bioinsecticides in different pest-infested crops has significantly increased the mortality of harmful insects and decreased their progeny number.
- Row Crops is the Largest Crop Type. Rice, wheat, corn, soybean, sorghum, and barley are the major organic row crops produced and their dominanance in biopesticide consumption is due to the large organic area.
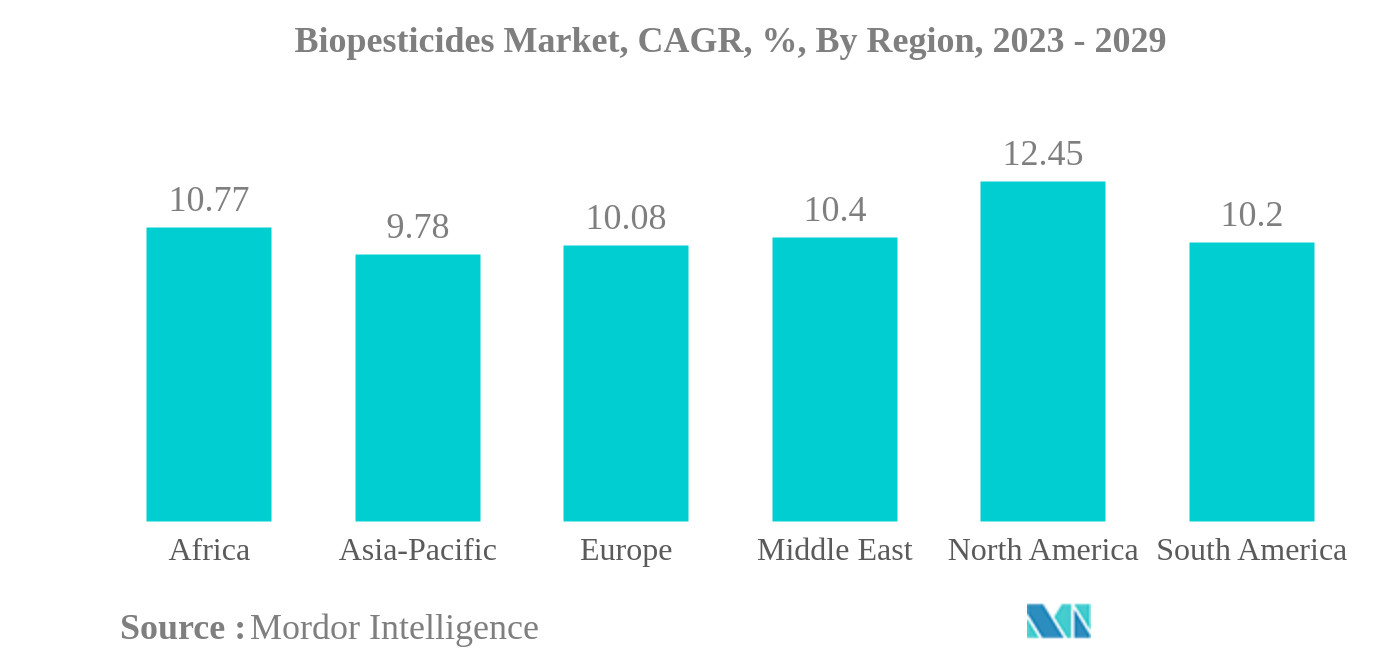
- North America is the Largest Region. The growing area under cultivation of organic crops and high adaption of biological solutions by the farmers of the region has made it the large consumer of biopesticides globally.
Biopesticides Market Trends
This section covers the major market trends shaping the Biopesticides Market according to our research experts:
Biofungicides is the largest Form
- Biopesticides are made from natural materials such as animals, plants, bacteria, and certain minerals. They are used to control pests in an environmentally friendly way by harnessing natural mechanisms of control. Biopesticides are often selective, and they target specific pests, thereby reducing the impact on non-target species and the environment. Biopesticides are also typically less toxic to humans and animals, and they break down more quickly in the environment.
- Biofungicides are the most popularly used biopesticides. They held a market share of 47.6% in 2022. Bacillus, Trichoderma, Streptomyces, and Pseudomonas are the most commercially used species of microorganisms in agriculture. These biofungicides effectively act against pathogens, such as Pythium, Rhizoctonia, Fusarium, Sclerotinia, Thielaviopsis, Botrytis, and powdery mildew.
- Bioinsecticides accounted for 27.9% of the global biopesticides market in 2022. There are several pests that cause devastating losses to specific crops in each season, which can be effectively controlled by using target-specific bioinsecticides. For instance, cotton is an important cash crop grown globally. The cotton bollworm pest affects the yield of cotton plants, irrespective of the region. Bacillus thuringiensis, a commercially important bioinsecticide, is known to effectively control this devastating pest that can cause potential yield losses of 30-90%.
- The effectiveness of biopesticides in controlling target-specific pests and diseases with no harm to the environment and animals is expected to drive the global market for biopesticides. The biopesticides market is estimated to register a CAGR of 11% during the forecast period (2023-2029).
North America is the largest Region
- Biopesticides are used to control pests in an eco-friendly way by harnessing natural control mechanisms. Biopesticides are often selective and target specific pests, reducing the impact on non-target species and the environment. Asia-Pacific and North America were the most biopesticides-consuming regions in 2022.
- The Asia-Pacific region, which is home to large agricultural countries like China and India, has seen significant growth in organic farming. This growth has been driven by rising demand for sustainable and healthier food options and increased awareness about the harmful effects of conventional pesticides. The organic crop area in the region increased from 3.1 million hectares in 2017 to 3.6 million hectares in 2021, representing a growth of 15.5% during the period.
- North America is the second most biopesticides-consuming region, and it had a share of 38.5% in 2021. The demand for organic food in the region is growing rapidly. The average per capita spending on organic food products in North America was recorded as USD 109.7 in 2021. Farmers of the region are adapting to new biological technologies at a faster pace. The trend toward sustainable agriculture is expected to drive the usage of biopesticides in the region.
- Government initiatives and promotion of organic farming in different regions further intensify this trend of sustainable approaches. For instance, the European Commission has unveiled an action plan to increase the organic area in the member countries to occupy 25.0% of the region's agricultural land area by 2030. Government authorities in South American countries like Peru and Argentina have banned the usage of chemical pesticides, thus driving the South American biopesticides market.
Biopesticides Industry Overview
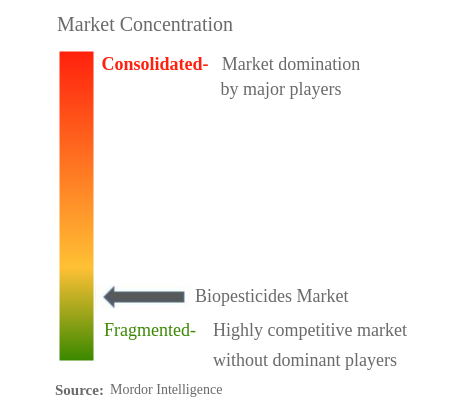
The Biopesticides Market is fragmented, with the top five companies occupying 6.03%. The major players in this market are Corteva Agriscience, Gujarat State Fertilizers & Chemicals Ltd, Koppert Biological Systems Inc., Marrone Bio Innovations Inc. and Valent Biosciences LLC (sorted alphabetically).
Biopesticides Market Leaders
Corteva Agriscience
Gujarat State Fertilizers & Chemicals Ltd
Koppert Biological Systems Inc.
Marrone Bio Innovations Inc.
Valent Biosciences LLC
*Disclaimer: Major Players sorted in no particular order
Biopesticides Market News
- October 2022: Seipasa launched its new advanced biofungicidal product, "Fungisei," in France, after getting registered phytosaniritarily by the European Commission.
- September 2022: Corteva Agriscience signed an agreement to acquire Symborg, a biologicals-based company, as a part of its strategy to expand its biologicals portfolio. The move was aimed at helping Corteva Agriscience in achieving its aim to become a global leader in the agricultural biologicals market.
- June 2022: Certis Biologicals and Novozymes, two leading agricultural biotechnology companies, collaborated to develop new technologies for highly effective fungal disease control. This collaboration will provide new solutions to row crop growers.
Biopesticides Market Report - Table of Contents
EXECUTIVE SUMMARY & KEY FINDINGS
REPORT OFFERS
1. INTRODUCTION
1.1. Study Assumptions & Market Definition
1.2. Scope of the Study
1.3. Research Methodology
2. KEY INDUSTRY TRENDS
2.1. Area Under Organic Cultivation
2.2. Per Capita Spending On Organic Products
2.3. Regulatory Framework
2.4. Value Chain & Distribution Channel Analysis
3. MARKET SEGMENTATION
3.1. Form
3.1.1. Biofungicides
3.1.2. Bioherbicides
3.1.3. Bioinsecticides
3.1.4. Other Biopesticides
3.2. Crop Type
3.2.1. Cash Crops
3.2.2. Horticultural Crops
3.2.3. Row Crops
3.3. Region
3.3.1. Africa
3.3.1.1. By Country
3.3.1.1.1. Egypt
3.3.1.1.2. Nigeria
3.3.1.1.3. South Africa
3.3.1.1.4. Rest of Africa
3.3.2. Asia-Pacific
3.3.2.1. By Country
3.3.2.1.1. Australia
3.3.2.1.2. China
3.3.2.1.3. India
3.3.2.1.4. Indonesia
3.3.2.1.5. Japan
3.3.2.1.6. Philippines
3.3.2.1.7. Thailand
3.3.2.1.8. Vietnam
3.3.2.1.9. Rest of Asia-Pacific
3.3.3. Europe
3.3.3.1. By Country
3.3.3.1.1. France
3.3.3.1.2. Germany
3.3.3.1.3. Italy
3.3.3.1.4. Netherlands
3.3.3.1.5. Russia
3.3.3.1.6. Spain
3.3.3.1.7. Turkey
3.3.3.1.8. United Kingdom
3.3.3.1.9. Rest of Europe
3.3.4. Middle East
3.3.4.1. By Country
3.3.4.1.1. Iran
3.3.4.1.2. Saudi Arabia
3.3.4.1.3. Rest of Middle East
3.3.5. North America
3.3.5.1. By Country
3.3.5.1.1. Canada
3.3.5.1.2. Mexico
3.3.5.1.3. United States
3.3.5.1.4. Rest of North America
3.3.6. South America
3.3.6.1. By Country
3.3.6.1.1. Argentina
3.3.6.1.2. Brazil
3.3.6.1.3. Rest of South America
4. COMPETITIVE LANDSCAPE
4.1. Key Strategic Moves
4.2. Market Share Analysis
4.3. Company Landscape
4.4. Company Profiles
4.4.1. Andermatt Group AG
4.4.2. Atlántica Agrícola
4.4.3. Biolchim SPA
4.4.4. Bioworks Inc.
4.4.5. Certis USA LLC
4.4.6. Corteva Agriscience
4.4.7. Gujarat State Fertilizers & Chemicals Ltd
4.4.8. Henan Jiyuan Baiyun Industry Co. Ltd
4.4.9. IPL Biologicals Limited
4.4.10. Koppert Biological Systems Inc.
4.4.11. Lallemand Inc.
4.4.12. Marrone Bio Innovations Inc.
4.4.13. Seipasa SA
4.4.14. T Stanes and Company Limited
4.4.15. Valent Biosciences LLC
5. KEY STRATEGIC QUESTIONS FOR AGRICULTURAL BIOLOGICALS CEOS
6. APPENDIX
6.1. Global Overview
6.1.1. Overview
6.1.2. Porter's Five Forces Framework
6.1.3. Global Value Chain Analysis
6.1.4. Market Dynamics (DROs)
6.2. Sources & References
6.3. List of Tables & Figures
6.4. Primary Insights
6.5. Data Pack
6.6. Glossary of Terms
List of Tables & Figures
- Figure 1:
- GLOBAL BIOPESTICIDES MARKET, AREA UNDER ORGANIC CULTIVATION, HECTARES, 2017 - 2022
- Figure 2:
- GLOBAL BIOPESTICIDES MARKET, PER CAPITA SPENDING ON ORGANIC PRODUCTS, USD, 2017 - 2022
- Figure 3:
- GLOBAL BIOPESTICIDES MARKET, VOLUME, METRIC TON, 2017 - 2029
- Figure 4:
- GLOBAL BIOPESTICIDES MARKET, VALUE, USD, 2017 - 2029
- Figure 5:
- GLOBAL BIOPESTICIDES MARKET, BY FORM, VOLUME, METRIC TON, 2017 - 2029
- Figure 6:
- GLOBAL BIOPESTICIDES MARKET, BY FORM, VALUE, USD, 2017 - 2029
- Figure 7:
- GLOBAL BIOPESTICIDES MARKET, VOLUME SHARE(%), BY FORM, 2017 - 2029
- Figure 8:
- GLOBAL BIOPESTICIDES MARKET, VALUE SHARE(%), BY FORM, 2017 - 2029
- Figure 9:
- GLOBAL BIOPESTICIDES MARKET, BY FORM, VOLUME, METRIC TON, 2017 - 2029
- Figure 10:
- GLOBAL BIOPESTICIDES MARKET, BY FORM, VALUE, USD, 2017 - 2029
- Figure 11:
- GLOBAL BIOPESTICIDES MARKET, VALUE SHARE(%), BY CROP TYPE, 2022 - 2029
- Figure 12:
- GLOBAL BIOPESTICIDES MARKET, BY FORM, VOLUME, METRIC TON, 2017 - 2029
- Figure 13:
- GLOBAL BIOPESTICIDES MARKET, BY FORM, VALUE, USD, 2017 - 2029
- Figure 14:
- GLOBAL BIOPESTICIDES MARKET, VALUE SHARE(%), BY CROP TYPE, 2022 - 2029
- Figure 15:
- GLOBAL BIOPESTICIDES MARKET, BY FORM, VOLUME, METRIC TON, 2017 - 2029
- Figure 16:
- GLOBAL BIOPESTICIDES MARKET, BY FORM, VALUE, USD, 2017 - 2029
- Figure 17:
- GLOBAL BIOPESTICIDES MARKET, VALUE SHARE(%), BY CROP TYPE, 2022 - 2029
- Figure 18:
- GLOBAL BIOPESTICIDES MARKET, BY FORM, VOLUME, METRIC TON, 2017 - 2029
- Figure 19:
- GLOBAL BIOPESTICIDES MARKET, BY FORM, VALUE, USD, 2017 - 2029
- Figure 20:
- GLOBAL BIOPESTICIDES MARKET, VALUE SHARE(%), BY CROP TYPE, 2022 - 2029
- Figure 21:
- GLOBAL BIOPESTICIDES MARKET, BY CROP TYPE, VOLUME, METRIC TON, 2017 - 2029
- Figure 22:
- GLOBAL BIOPESTICIDES MARKET, BY CROP TYPE, VALUE, USD, 2017 - 2029
- Figure 23:
- GLOBAL BIOPESTICIDES MARKET, VOLUME SHARE(%), BY CROP TYPE, 2017 - 2029
- Figure 24:
- GLOBAL BIOPESTICIDES MARKET, VALUE SHARE(%), BY CROP TYPE, 2017 - 2029
- Figure 25:
- GLOBAL BIOPESTICIDES MARKET, BY CROP TYPE, VOLUME, METRIC TON, 2017 - 2029
- Figure 26:
- GLOBAL BIOPESTICIDES MARKET, BY CROP TYPE, VALUE, USD, 2017 - 2029
- Figure 27:
- GLOBAL BIOPESTICIDES MARKET, VALUE SHARE(%), BY FORM, 2022 - 2029
- Figure 28:
- GLOBAL BIOPESTICIDES MARKET, BY CROP TYPE, VOLUME, METRIC TON, 2017 - 2029
- Figure 29:
- GLOBAL BIOPESTICIDES MARKET, BY CROP TYPE, VALUE, USD, 2017 - 2029
- Figure 30:
- GLOBAL BIOPESTICIDES MARKET, VALUE SHARE(%), BY FORM, 2022 - 2029
- Figure 31:
- GLOBAL BIOPESTICIDES MARKET, BY CROP TYPE, VOLUME, METRIC TON, 2017 - 2029
- Figure 32:
- GLOBAL BIOPESTICIDES MARKET, BY CROP TYPE, VALUE, USD, 2017 - 2029
- Figure 33:
- GLOBAL BIOPESTICIDES MARKET, VALUE SHARE(%), BY FORM, 2022 - 2029
- Figure 34:
- GLOBAL BIOPESTICIDES MARKET, BY REGION, VOLUME, METRIC TON, 2017 - 2029
- Figure 35:
- GLOBAL BIOPESTICIDES MARKET, BY REGION, VALUE, USD, 2017 - 2029
- Figure 36:
- GLOBAL BIOPESTICIDES MARKET, VOLUME SHARE(%), BY REGION, 2017 - 2029
- Figure 37:
- GLOBAL BIOPESTICIDES MARKET, VALUE SHARE(%), BY REGION, 2017 - 2029
- Figure 38:
- GLOBAL BIOPESTICIDES MARKET, BY COUNTRY, VOLUME, METRIC TON, 2017 - 2029
- Figure 39:
- GLOBAL BIOPESTICIDES MARKET, BY COUNTRY, VALUE, USD, 2017 - 2029
- Figure 40:
- GLOBAL BIOPESTICIDES MARKET, VOLUME SHARE(%), BY COUNTRY, 2017 - 2029
- Figure 41:
- GLOBAL BIOPESTICIDES MARKET, VALUE SHARE(%), BY COUNTRY, 2017 - 2029
- Figure 42:
- GLOBAL BIOPESTICIDES MARKET, BY COUNTRY, VOLUME, METRIC TON, 2017 - 2029
- Figure 43:
- GLOBAL BIOPESTICIDES MARKET, BY COUNTRY, VALUE, USD, 2017 - 2029
- Figure 44:
- GLOBAL BIOPESTICIDES MARKET, VALUE SHARE(%), BY FORM, 2022 - 2029
- Figure 45:
- GLOBAL BIOPESTICIDES MARKET, BY COUNTRY, VOLUME, METRIC TON, 2017 - 2029
- Figure 46:
- GLOBAL BIOPESTICIDES MARKET, BY COUNTRY, VALUE, USD, 2017 - 2029
- Figure 47:
- GLOBAL BIOPESTICIDES MARKET, VALUE SHARE(%), BY FORM, 2022 - 2029
- Figure 48:
- GLOBAL BIOPESTICIDES MARKET, BY COUNTRY, VOLUME, METRIC TON, 2017 - 2029
- Figure 49:
- GLOBAL BIOPESTICIDES MARKET, BY COUNTRY, VALUE, USD, 2017 - 2029
- Figure 50:
- GLOBAL BIOPESTICIDES MARKET, VALUE SHARE(%), BY FORM, 2022 - 2029
- Figure 51:
- GLOBAL BIOPESTICIDES MARKET, BY COUNTRY, VOLUME, METRIC TON, 2017 - 2029
- Figure 52:
- GLOBAL BIOPESTICIDES MARKET, BY COUNTRY, VALUE, USD, 2017 - 2029
- Figure 53:
- GLOBAL BIOPESTICIDES MARKET, VALUE SHARE(%), BY FORM, 2022 - 2029
- Figure 54:
- GLOBAL BIOPESTICIDES MARKET, BY COUNTRY, VOLUME, METRIC TON, 2017 - 2029
- Figure 55:
- GLOBAL BIOPESTICIDES MARKET, BY COUNTRY, VALUE, USD, 2017 - 2029
- Figure 56:
- GLOBAL BIOPESTICIDES MARKET, VOLUME SHARE(%), BY COUNTRY, 2017 - 2029
- Figure 57:
- GLOBAL BIOPESTICIDES MARKET, VALUE SHARE(%), BY COUNTRY, 2017 - 2029
- Figure 58:
- GLOBAL BIOPESTICIDES MARKET, BY COUNTRY, VOLUME, METRIC TON, 2017 - 2029
- Figure 59:
- GLOBAL BIOPESTICIDES MARKET, BY COUNTRY, VALUE, USD, 2017 - 2029
- Figure 60:
- GLOBAL BIOPESTICIDES MARKET, VALUE SHARE(%), BY FORM, 2022 - 2029
- Figure 61:
- GLOBAL BIOPESTICIDES MARKET, BY COUNTRY, VOLUME, METRIC TON, 2017 - 2029
- Figure 62:
- GLOBAL BIOPESTICIDES MARKET, BY COUNTRY, VALUE, USD, 2017 - 2029
- Figure 63:
- GLOBAL BIOPESTICIDES MARKET, VALUE SHARE(%), BY FORM, 2022 - 2029
- Figure 64:
- GLOBAL BIOPESTICIDES MARKET, BY COUNTRY, VOLUME, METRIC TON, 2017 - 2029
- Figure 65:
- GLOBAL BIOPESTICIDES MARKET, BY COUNTRY, VALUE, USD, 2017 - 2029
- Figure 66:
- GLOBAL BIOPESTICIDES MARKET, VALUE SHARE(%), BY FORM, 2022 - 2029
- Figure 67:
- GLOBAL BIOPESTICIDES MARKET, BY COUNTRY, VOLUME, METRIC TON, 2017 - 2029
- Figure 68:
- GLOBAL BIOPESTICIDES MARKET, BY COUNTRY, VALUE, USD, 2017 - 2029
- Figure 69:
- GLOBAL BIOPESTICIDES MARKET, VALUE SHARE(%), BY FORM, 2022 - 2029
- Figure 70:
- GLOBAL BIOPESTICIDES MARKET, BY COUNTRY, VOLUME, METRIC TON, 2017 - 2029
- Figure 71:
- GLOBAL BIOPESTICIDES MARKET, BY COUNTRY, VALUE, USD, 2017 - 2029
- Figure 72:
- GLOBAL BIOPESTICIDES MARKET, VALUE SHARE(%), BY FORM, 2022 - 2029
- Figure 73:
- GLOBAL BIOPESTICIDES MARKET, BY COUNTRY, VOLUME, METRIC TON, 2017 - 2029
- Figure 74:
- GLOBAL BIOPESTICIDES MARKET, BY COUNTRY, VALUE, USD, 2017 - 2029
- Figure 75:
- GLOBAL BIOPESTICIDES MARKET, VALUE SHARE(%), BY FORM, 2022 - 2029
- Figure 76:
- GLOBAL BIOPESTICIDES MARKET, BY COUNTRY, VOLUME, METRIC TON, 2017 - 2029
- Figure 77:
- GLOBAL BIOPESTICIDES MARKET, BY COUNTRY, VALUE, USD, 2017 - 2029
- Figure 78:
- GLOBAL BIOPESTICIDES MARKET, VALUE SHARE(%), BY FORM, 2022 - 2029
- Figure 79:
- GLOBAL BIOPESTICIDES MARKET, BY COUNTRY, VOLUME, METRIC TON, 2017 - 2029
- Figure 80:
- GLOBAL BIOPESTICIDES MARKET, BY COUNTRY, VALUE, USD, 2017 - 2029
- Figure 81:
- GLOBAL BIOPESTICIDES MARKET, VALUE SHARE(%), BY FORM, 2022 - 2029
- Figure 82:
- GLOBAL BIOPESTICIDES MARKET, BY COUNTRY, VOLUME, METRIC TON, 2017 - 2029
- Figure 83:
- GLOBAL BIOPESTICIDES MARKET, BY COUNTRY, VALUE, USD, 2017 - 2029
- Figure 84:
- GLOBAL BIOPESTICIDES MARKET, VALUE SHARE(%), BY FORM, 2022 - 2029
- Figure 85:
- GLOBAL BIOPESTICIDES MARKET, BY COUNTRY, VOLUME, METRIC TON, 2017 - 2029
- Figure 86:
- GLOBAL BIOPESTICIDES MARKET, BY COUNTRY, VALUE, USD, 2017 - 2029
- Figure 87:
- GLOBAL BIOPESTICIDES MARKET, VOLUME SHARE(%), BY COUNTRY, 2017 - 2029
- Figure 88:
- GLOBAL BIOPESTICIDES MARKET, VALUE SHARE(%), BY COUNTRY, 2017 - 2029
- Figure 89:
- GLOBAL BIOPESTICIDES MARKET, BY COUNTRY, VOLUME, METRIC TON, 2017 - 2029
- Figure 90:
- GLOBAL BIOPESTICIDES MARKET, BY COUNTRY, VALUE, USD, 2017 - 2029
- Figure 91:
- GLOBAL BIOPESTICIDES MARKET, VALUE SHARE(%), BY FORM, 2022 - 2029
- Figure 92:
- GLOBAL BIOPESTICIDES MARKET, BY COUNTRY, VOLUME, METRIC TON, 2017 - 2029
- Figure 93:
- GLOBAL BIOPESTICIDES MARKET, BY COUNTRY, VALUE, USD, 2017 - 2029
- Figure 94:
- GLOBAL BIOPESTICIDES MARKET, VALUE SHARE(%), BY FORM, 2022 - 2029
- Figure 95:
- GLOBAL BIOPESTICIDES MARKET, BY COUNTRY, VOLUME, METRIC TON, 2017 - 2029
- Figure 96:
- GLOBAL BIOPESTICIDES MARKET, BY COUNTRY, VALUE, USD, 2017 - 2029
- Figure 97:
- GLOBAL BIOPESTICIDES MARKET, VALUE SHARE(%), BY FORM, 2022 - 2029
- Figure 98:
- GLOBAL BIOPESTICIDES MARKET, BY COUNTRY, VOLUME, METRIC TON, 2017 - 2029
- Figure 99:
- GLOBAL BIOPESTICIDES MARKET, BY COUNTRY, VALUE, USD, 2017 - 2029
- Figure 100:
- GLOBAL BIOPESTICIDES MARKET, VALUE SHARE(%), BY FORM, 2022 - 2029
- Figure 101:
- GLOBAL BIOPESTICIDES MARKET, BY COUNTRY, VOLUME, METRIC TON, 2017 - 2029
- Figure 102:
- GLOBAL BIOPESTICIDES MARKET, BY COUNTRY, VALUE, USD, 2017 - 2029
- Figure 103:
- GLOBAL BIOPESTICIDES MARKET, VALUE SHARE(%), BY FORM, 2022 - 2029
- Figure 104:
- GLOBAL BIOPESTICIDES MARKET, BY COUNTRY, VOLUME, METRIC TON, 2017 - 2029
- Figure 105:
- GLOBAL BIOPESTICIDES MARKET, BY COUNTRY, VALUE, USD, 2017 - 2029
- Figure 106:
- GLOBAL BIOPESTICIDES MARKET, VALUE SHARE(%), BY FORM, 2022 - 2029
- Figure 107:
- GLOBAL BIOPESTICIDES MARKET, BY COUNTRY, VOLUME, METRIC TON, 2017 - 2029
- Figure 108:
- GLOBAL BIOPESTICIDES MARKET, BY COUNTRY, VALUE, USD, 2017 - 2029
- Figure 109:
- GLOBAL BIOPESTICIDES MARKET, VALUE SHARE(%), BY FORM, 2022 - 2029
- Figure 110:
- GLOBAL BIOPESTICIDES MARKET, BY COUNTRY, VOLUME, METRIC TON, 2017 - 2029
- Figure 111:
- GLOBAL BIOPESTICIDES MARKET, BY COUNTRY, VALUE, USD, 2017 - 2029
- Figure 112:
- GLOBAL BIOPESTICIDES MARKET, VALUE SHARE(%), BY FORM, 2022 - 2029
- Figure 113:
- GLOBAL BIOPESTICIDES MARKET, BY COUNTRY, VOLUME, METRIC TON, 2017 - 2029
- Figure 114:
- GLOBAL BIOPESTICIDES MARKET, BY COUNTRY, VALUE, USD, 2017 - 2029
- Figure 115:
- GLOBAL BIOPESTICIDES MARKET, VALUE SHARE(%), BY FORM, 2022 - 2029
- Figure 116:
- GLOBAL BIOPESTICIDES MARKET, BY COUNTRY, VOLUME, METRIC TON, 2017 - 2029
- Figure 117:
- GLOBAL BIOPESTICIDES MARKET, BY COUNTRY, VALUE, USD, 2017 - 2029
- Figure 118:
- GLOBAL BIOPESTICIDES MARKET, VOLUME SHARE(%), BY COUNTRY, 2017 - 2029
- Figure 119:
- GLOBAL BIOPESTICIDES MARKET, VALUE SHARE(%), BY COUNTRY, 2017 - 2029
- Figure 120:
- GLOBAL BIOPESTICIDES MARKET, BY COUNTRY, VOLUME, METRIC TON, 2017 - 2029
- Figure 121:
- GLOBAL BIOPESTICIDES MARKET, BY COUNTRY, VALUE, USD, 2017 - 2029
- Figure 122:
- GLOBAL BIOPESTICIDES MARKET, VALUE SHARE(%), BY FORM, 2022 - 2029
- Figure 123:
- GLOBAL BIOPESTICIDES MARKET, BY COUNTRY, VOLUME, METRIC TON, 2017 - 2029
- Figure 124:
- GLOBAL BIOPESTICIDES MARKET, BY COUNTRY, VALUE, USD, 2017 - 2029
- Figure 125:
- GLOBAL BIOPESTICIDES MARKET, VALUE SHARE(%), BY FORM, 2022 - 2029
- Figure 126:
- GLOBAL BIOPESTICIDES MARKET, BY COUNTRY, VOLUME, METRIC TON, 2017 - 2029
- Figure 127:
- GLOBAL BIOPESTICIDES MARKET, BY COUNTRY, VALUE, USD, 2017 - 2029
- Figure 128:
- GLOBAL BIOPESTICIDES MARKET, VALUE SHARE(%), BY FORM, 2022 - 2029
- Figure 129:
- GLOBAL BIOPESTICIDES MARKET, BY COUNTRY, VOLUME, METRIC TON, 2017 - 2029
- Figure 130:
- GLOBAL BIOPESTICIDES MARKET, BY COUNTRY, VALUE, USD, 2017 - 2029
- Figure 131:
- GLOBAL BIOPESTICIDES MARKET, VOLUME SHARE(%), BY COUNTRY, 2017 - 2029
- Figure 132:
- GLOBAL BIOPESTICIDES MARKET, VALUE SHARE(%), BY COUNTRY, 2017 - 2029
- Figure 133:
- GLOBAL BIOPESTICIDES MARKET, BY COUNTRY, VOLUME, METRIC TON, 2017 - 2029
- Figure 134:
- GLOBAL BIOPESTICIDES MARKET, BY COUNTRY, VALUE, USD, 2017 - 2029
- Figure 135:
- GLOBAL BIOPESTICIDES MARKET, VALUE SHARE(%), BY FORM, 2022 - 2029
- Figure 136:
- GLOBAL BIOPESTICIDES MARKET, BY COUNTRY, VOLUME, METRIC TON, 2017 - 2029
- Figure 137:
- GLOBAL BIOPESTICIDES MARKET, BY COUNTRY, VALUE, USD, 2017 - 2029
- Figure 138:
- GLOBAL BIOPESTICIDES MARKET, VALUE SHARE(%), BY FORM, 2022 - 2029
- Figure 139:
- GLOBAL BIOPESTICIDES MARKET, BY COUNTRY, VOLUME, METRIC TON, 2017 - 2029
- Figure 140:
- GLOBAL BIOPESTICIDES MARKET, BY COUNTRY, VALUE, USD, 2017 - 2029
- Figure 141:
- GLOBAL BIOPESTICIDES MARKET, VALUE SHARE(%), BY FORM, 2022 - 2029
- Figure 142:
- GLOBAL BIOPESTICIDES MARKET, BY COUNTRY, VOLUME, METRIC TON, 2017 - 2029
- Figure 143:
- GLOBAL BIOPESTICIDES MARKET, BY COUNTRY, VALUE, USD, 2017 - 2029
- Figure 144:
- GLOBAL BIOPESTICIDES MARKET, VALUE SHARE(%), BY FORM, 2022 - 2029
- Figure 145:
- GLOBAL BIOPESTICIDES MARKET, BY COUNTRY, VOLUME, METRIC TON, 2017 - 2029
- Figure 146:
- GLOBAL BIOPESTICIDES MARKET, BY COUNTRY, VALUE, USD, 2017 - 2029
- Figure 147:
- GLOBAL BIOPESTICIDES MARKET, VOLUME SHARE(%), BY COUNTRY, 2017 - 2029
- Figure 148:
- GLOBAL BIOPESTICIDES MARKET, VALUE SHARE(%), BY COUNTRY, 2017 - 2029
- Figure 149:
- GLOBAL BIOPESTICIDES MARKET, BY COUNTRY, VOLUME, METRIC TON, 2017 - 2029
- Figure 150:
- GLOBAL BIOPESTICIDES MARKET, BY COUNTRY, VALUE, USD, 2017 - 2029
- Figure 151:
- GLOBAL BIOPESTICIDES MARKET, VALUE SHARE(%), BY FORM, 2022 - 2029
- Figure 152:
- GLOBAL BIOPESTICIDES MARKET, BY COUNTRY, VOLUME, METRIC TON, 2017 - 2029
- Figure 153:
- GLOBAL BIOPESTICIDES MARKET, BY COUNTRY, VALUE, USD, 2017 - 2029
- Figure 154:
- GLOBAL BIOPESTICIDES MARKET, VALUE SHARE(%), BY FORM, 2022 - 2029
- Figure 155:
- GLOBAL BIOPESTICIDES MARKET, BY COUNTRY, VOLUME, METRIC TON, 2017 - 2029
- Figure 156:
- GLOBAL BIOPESTICIDES MARKET, BY COUNTRY, VALUE, USD, 2017 - 2029
- Figure 157:
- GLOBAL BIOPESTICIDES MARKET, VALUE SHARE(%), BY FORM, 2022 - 2029
- Figure 158:
- GLOBAL BIOPESTICIDES MARKET, MOST ACTIVE COMPANIES, BY NUMBER OF STRATEGIC MOVES, 2017-2022
- Figure 159:
- GLOBAL BIOPESTICIDES MARKET, MOST ADOPTED STRATEGIES, 2017-2022
- Figure 160:
- GLOBAL BIOPESTICIDES MARKET SHARE(%), BY MAJOR PLAYERS, 2022
Biopesticides Industry Segmentation
Biofungicides, Bioherbicides, Bioinsecticides are covered as segments by Form. Cash Crops, Horticultural Crops, Row Crops are covered as segments by Crop Type. Africa, Asia-Pacific, Europe, Middle East, North America, South America are covered as segments by Region.| Form | |
| Biofungicides | |
| Bioherbicides | |
| Bioinsecticides | |
| Other Biopesticides |
| Crop Type | |
| Cash Crops | |
| Horticultural Crops | |
| Row Crops |
| Region | |||||||||||||
| |||||||||||||
| |||||||||||||
| |||||||||||||
| |||||||||||||
| |||||||||||||
|
Market Definition
- AVERAGE DOSAGE RATE - This refers to the average volume of biopesticides applied per hectare of farmland in the respective region/country.
- CROP TYPE - Row Crops: Cereals, Pulses, Oilseeds, and Forage Crops Horticulture: Fruits, and Vegetables, Cash Crops: Plantation Crops and Spices.
- FUNCTIONS - Biopesticides
- MARKET ESTIMATION LEVEL - Market Estimations for various types of biopesticides has been done at the product-level.
Research Methodology
Mordor Intelligence follows a four-step methodology in all our reports.
- Step-1: Identify Key Variables: In order to build a robust forecasting methodology, the variables and factors identified in Step-1 are tested against available historical market numbers. Through an iterative process, the variables required for market forecast are set and the model is built on the basis of these variables.
- Step-2: Build a Market Model: Market-size estimations for the forecast years are in nominal terms. Inflation is not a part of the pricing, and the average selling price (ASP) is kept constant throughout the forecast period.
- Step-3: Validate and Finalize: In this important step, all market numbers, variables and analyst calls are validated through an extensive network of primary research experts from the market studied. The respondents are selected across levels and functions to generate a holistic picture of the market studied.
- Step-4: Research Outputs: Syndicated Reports, Custom Consulting Assignments, Databases & Subscription Platforms.


