UAE Power Market Size
| Study Period | 2020 - 2029 |
| Base Year For Estimation | 2023 |
| Forecast Data Period | 2024 - 2029 |
| Historical Data Period | 2020 - 2022 |
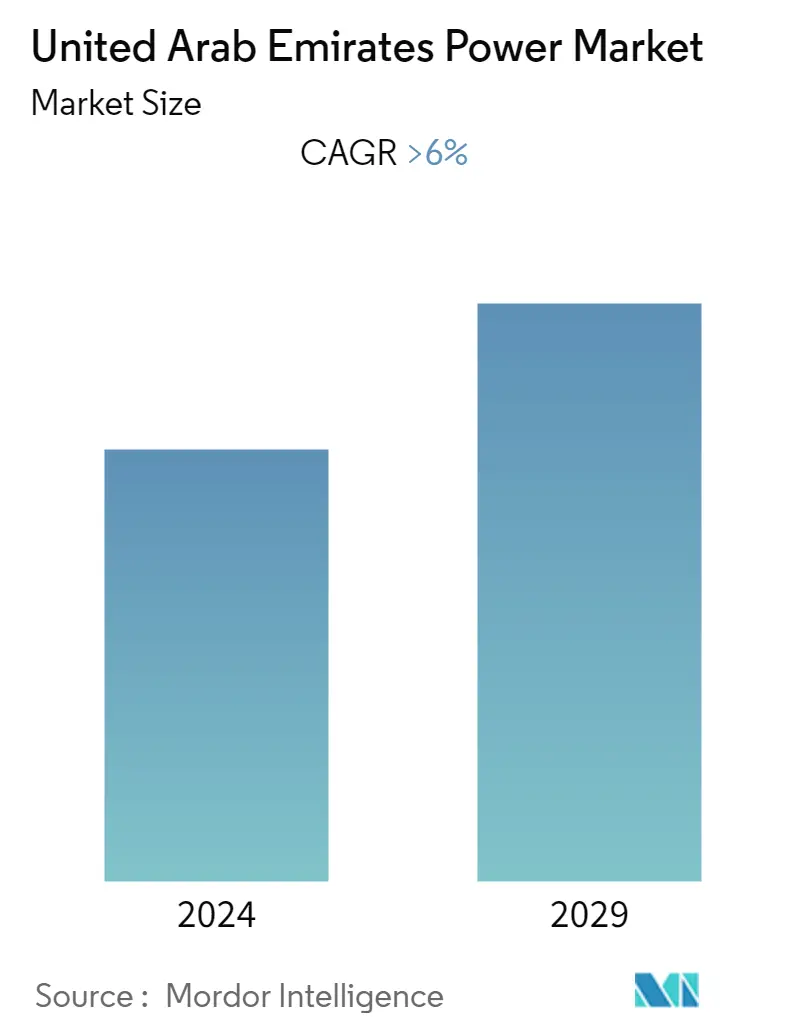
| CAGR | > 6.00 % |
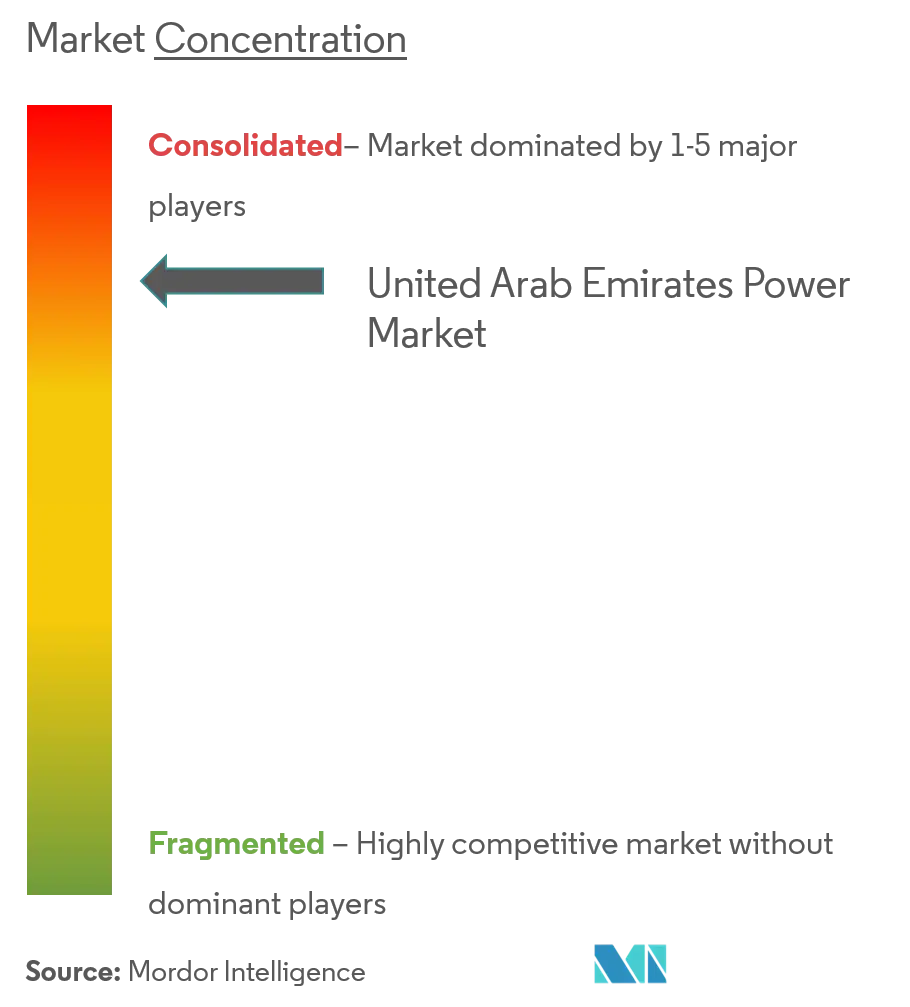
| Market Concentration | Medium |
Major Players
*Disclaimer: Major Players sorted in no particular order |
Need a report that reflects how COVID-19 has impacted this market and its growth?
UAE Power Market Analysis
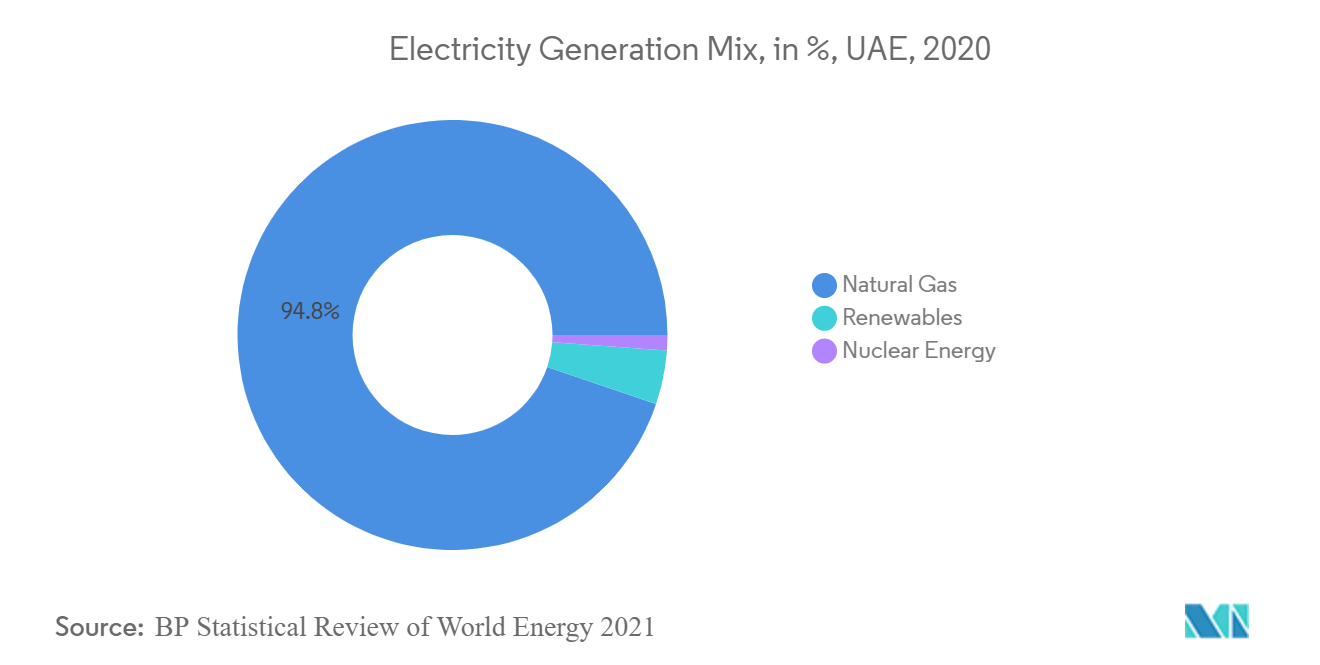
The UAE power market is expected to register a CAGR of more than 6% during the forecast period, 2022-2027. The COVID-19 pandemic led to a decline in electricity consumption in 2020, which led to a slowdown in the market. However, this effect is expected to be short-term, and the market is expected to grow during the forecast period. The energy mix for electricity generation is dominated by natural gas, which constitutes almost around 95% of the energy mix. Further, with the upcoming natural gas-fired projects, the market is likely to grow during the forecast period. However, the lack of privatization in the power sector in the northern Emirates is expected to restrain the development of the power sector in the coming years.
- The thermal energy segment has maintained its dominance in the country in recent years, and it is expected to continue to do so during the forecast period.
- Nuclear and waste-to-energy projects are gradually gaining momentum in the country, apart from solar power, which, in turn, is expected to create an ample opportunity for the power sector as new projects.
- The United Arab Emirates has one of the most advanced power sectors in the region, with distinct structures and government policies that are favorable. The country has several upcoming renewable energy projects, which are expected to drive the power market in the country.
UAE Power Market Trends
This section covers the major market trends shaping the UAE Power Market according to our research experts:
The Thermal Segment is Expected to Dominate the Market
- The natural-gas-fired thermal power production is expected to have the highest share during the forecast period due to the upcoming natural-gas-based power projects.
- The share of natural gas in the electricity mix of the United Arab Emirates was around 95% in 2020. According to the International Energy Agency, the natural gas share in the total primary energy supply was around 85% in 2019. This was due to the huge natural gas reserves held by the country, which stood at around 209.7 trillion cubic feet as of 2020.
- In December 2021, Mitsubishi Power shipped three M701JAC gas turbines to the Fujairah F3 gas-fired power plant in the United Arab Emirates. The project is believed to be the largest gas turbine combined cycle (GTCC) facility in the UAE, equipped with combined cycle technology. The power plant using this highly efficient gas turbine is expected to be operational by 2023.
- The Al-Layyah Power plant in Sharjah, UAE, is a clear demonstration of the demand for natural-gas-fired power plants in the country. The 1.02GW combined cycle power plant (CCPP) is an expansion of the Layyah power plant and is currently in the construction phase at the site. The plant is expected to be commissioned by July 2022.
- Owing to such developments, it can be predicted that the natural gas-fired thermal power generation segment will have a significant share in the near future.
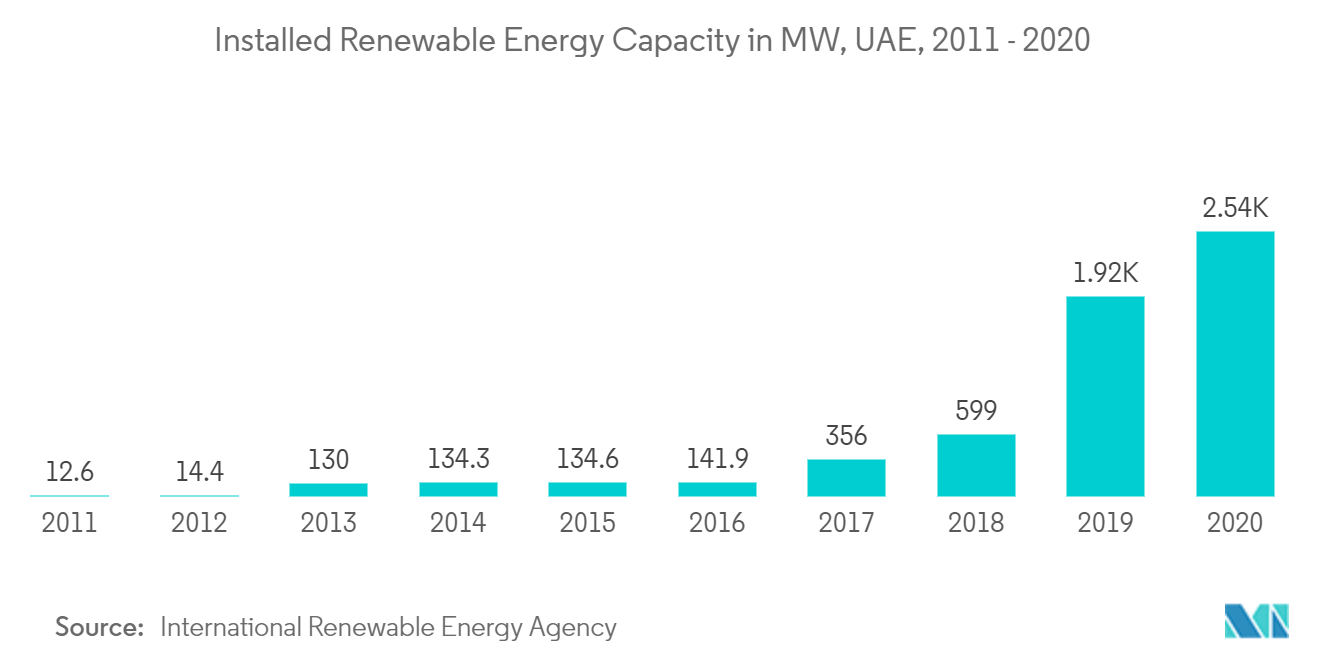
Growth in the Renewable Energy Sector is Expected to Drive the Market
- The United Arab Emirates has undertaken significant strides over the past several years and is leading the region's drive toward renewable energy, particularly in the solar sector. To meet the rising demand, the country has embarked on a challenging mission to increase energy security, diversify its energy sources, and increase the share of solar in its power mix.
- The UAE has proven that it holds some of the best solar resources in the world while supporting economic and regulatory policies that have helped its clean energy program excel. A contributing factor is an access to affordable finance.
- In addition to conventional project financing, the sector is seeing financial innovation to help facilitate and provide the investments required in the long term, including the AED 100 billion Dubai Green Fund, which will support the Shams Dubai initiative, a program aimed at facilitating the installation of rooftop solar panels.
- Additionally, 'UAE Energy Strategy 2050' targets to increase the contribution of clean energy in the overall national energy mix of the country to 50% by 2050, resulting in savings of approximately USD 190 billion of overall energy costs. As for its global efforts in this field and driven by its commitment to climate change mitigation, the UAE also announced the joining of the International Solar Alliance, which aims to help developing countries harness 1,000 GW of solar by 2030.
- Therefore, with the targets and policies set in place, the renewable energy sector in the UAE is expected to witness significant growth over the forecast period.
UAE Power Industry Overview
The UAE power market is moderately consolidated. Some of the key players are Abu Dhabi National Energy Company PJSC (TAQA), ACWA Power Company, Abu Dhabi Transmission & Despatch Company (Transco), Dubai Electricity and Water Authority (DEWA), and Honeywell International Inc.
UAE Power Market Leaders
Abu Dhabi National Energy Company PJSC (TAQA)
Abu Dhabi Transmission & Despatch Company (Transco)
Dubai Electricity and Water Authority (DEWA)
Honeywell International Inc
ACWA Power Company
*Disclaimer: Major Players sorted in no particular order
UAE Power Market News
- In May 2021, Dubai Electricity and Water Authority (DEWA) inaugurated six electricity transmission substations in Dubai. The project was completed with an investment of AED 1.1 billion. The substations include a 400 kilovolt (kV) substation at the Mohammed bin Rashid Al Maktoum Solar Park and five 132 kV substations in other areas in Dubai.
- In December 2020, the United Arab Emirates commissioned its first Barakah Nuclear Energy Plant, which successfully reached 100% of the reactor power capacity for Unit 1 of the facility during testing.
UAE Power Market Report - Table of Contents
1. INTRODUCTION
1.1 Scope of the Study
1.2 Market Definition
1.3 Study Assumptions
2. RESEARCH METHODOLOGY
3. EXECUTIVE SUMMARY
4. MARKET OVERVIEW
4.1 Introduction
4.2 Utility Power Installed Capacity, by Source, in Mega Watt, 2010-2020
4.3 Electricity Generation and Consumption Forecast, in Terawatt Hours, UAE, till 2027
4.4 Recent Trends and Developments
4.5 Government Policies and Regulations
4.6 Market Dynamics
4.6.1 Drivers
4.6.2 Restraints
4.7 Supply Chain Analysis
4.8 PESTLE Analysis
5. MARKET SEGMENTATION
5.1 Generation - Source
5.1.1 Thermal
5.1.2 Renewable
5.1.3 Other Sources
5.2 Transmission and Distribution
6. COMPETITIVE LANDSCAPE
6.1 Mergers and Acquisitions, Joint Ventures, Collaborations, and Agreements
6.2 Strategies Adopted by Leading Players
6.3 Company Profiles
6.3.1 Abu Dhabi National Energy Company PJSC (TAQA)
6.3.2 ACWA Power Company
6.3.3 Abu Dhabi Transmission & Despatch Company (Transco)
6.3.4 Dubai Electricity and Water Authority (DEWA)
6.3.5 Honeywell International Inc.
- *List Not Exhaustive
7. MARKET OPPORTUNITIES AND FUTURE TRENDS
UAE Power Industry Segmentation
The UAE power market report includes:
| Generation - Source | |
| Thermal | |
| Renewable | |
| Other Sources |
UAE Power Market Research FAQs
What is the current United Arab Emirates Power Market size?
The United Arab Emirates Power Market is projected to register a CAGR of greater than 6% during the forecast period (2024-2029)
Who are the key players in United Arab Emirates Power Market?
Abu Dhabi National Energy Company PJSC (TAQA) , Abu Dhabi Transmission & Despatch Company (Transco) , Dubai Electricity and Water Authority (DEWA) , Honeywell International Inc and ACWA Power Company are the major companies operating in the United Arab Emirates Power Market.
What years does this United Arab Emirates Power Market cover?
The report covers the United Arab Emirates Power Market historical market size for years: 2020, 2021, 2022 and 2023. The report also forecasts the United Arab Emirates Power Market size for years: 2024, 2025, 2026, 2027, 2028 and 2029.
UAE Power Industry Report
Statistics for the 2024 UAE Power market share, size and revenue growth rate, created by Mordor Intelligence™ Industry Reports. UAE Power analysis includes a market forecast outlook to 2029 and historical overview. Get a sample of this industry analysis as a free report PDF download.
