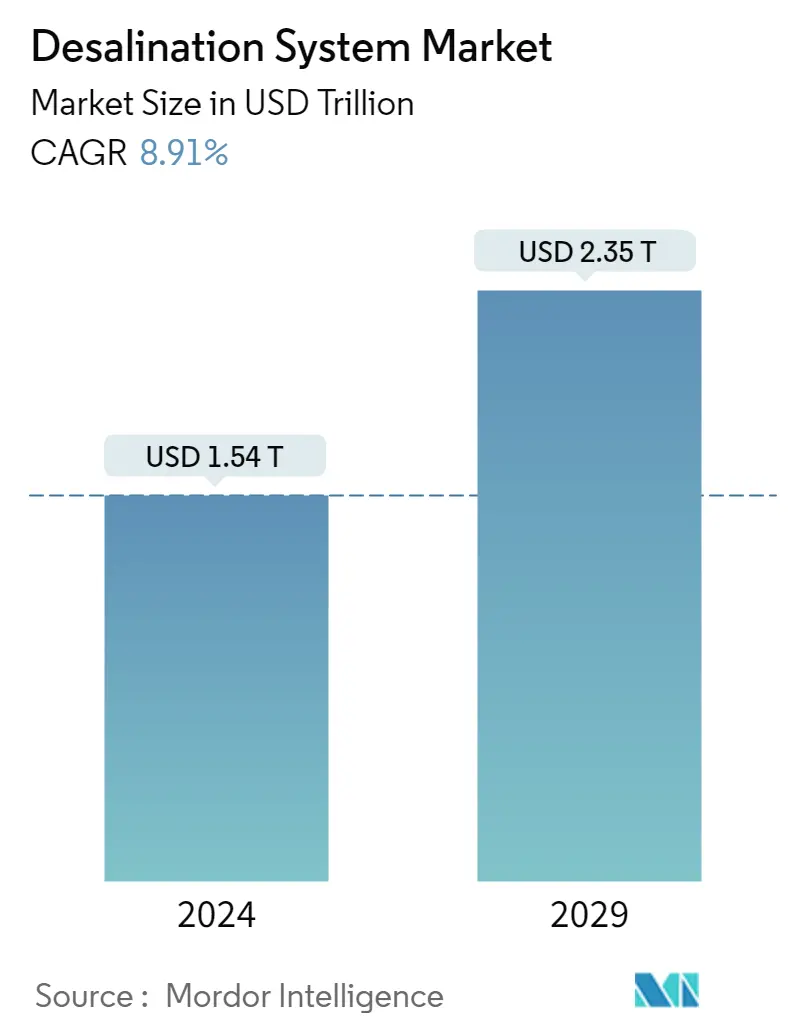
Desalination System Market Size
| Study Period | 2019 - 2029 |
| Market Size (2024) | USD 1.54 Trillion |
| Market Size (2029) | USD 2.35 Trillion |
| CAGR (2024 - 2029) | 8.91 % |
| Fastest Growing Market | Middle East and Africa |
| Largest Market | Middle East and Africa |
Major Players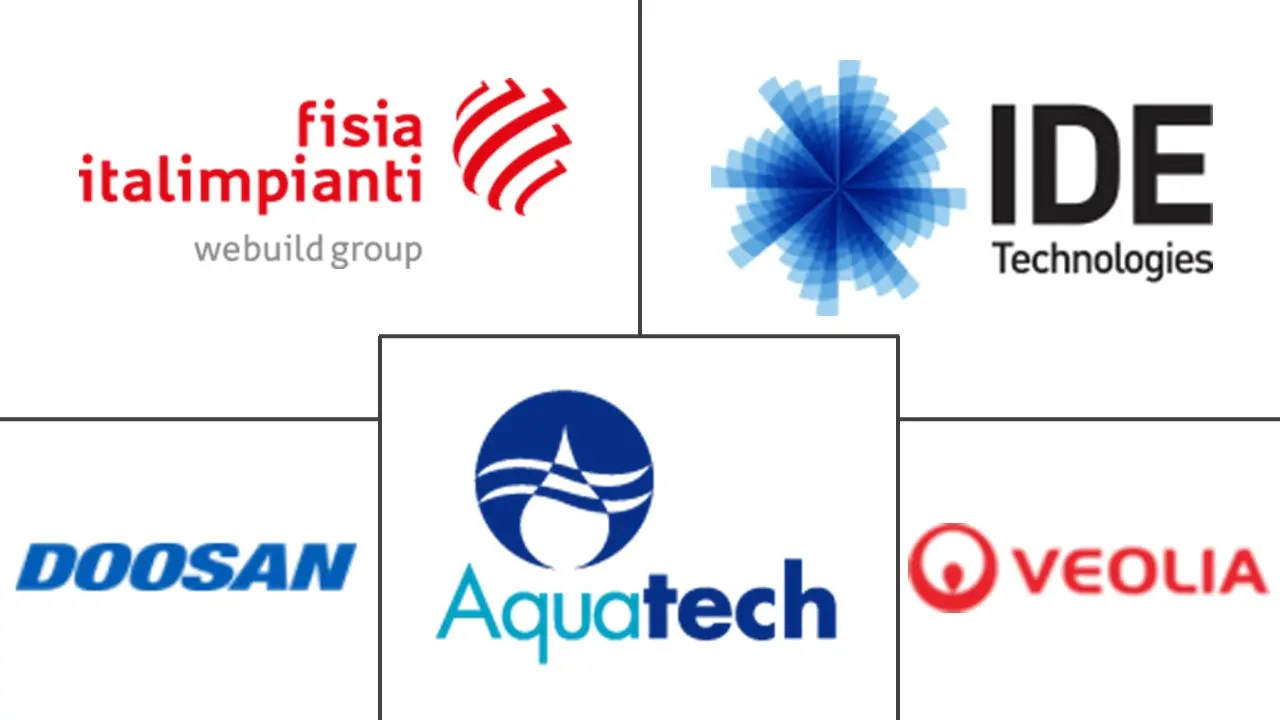
*Disclaimer: Major Players sorted in no particular order |
Need a report that reflects how COVID-19 has impacted this market and its growth?
Desalination System Market Analysis
The Desalination System Market size is estimated at USD 1.54 trillion in 2024, and is expected to reach USD 2.35 trillion by 2029, growing at a CAGR of 8.91% during the forecast period (2024-2029).
The desalination market was negatively impacted by COVID-19 as it restricted the operating activities of several industries, including the power and petrochemical industries. Implementing stringent lockdown measures led to a halt of industrial operations. However, the sector has been recovering well since restrictions were lifted. The growing industrial activities supported by restored supply chains and operating rates, growing residential and commercial spaces, and increasing population have been registering the positive demand for desalination systems.
- Over the short term, increasing demand from the Middle East and North Africa due to the lack of fresh water supply and the growing demand for desalinated water for industrial purposes are the major factors driving the growth of the market studied.
- However, RO membrane fouling and environmental repercussions of desalination are the key factors anticipated to restrain the growth of the target industry over the forecast period.
- Nevertheless, the rising number of upcoming desalination projects is likely to create lucrative growth opportunities for the global market soon.
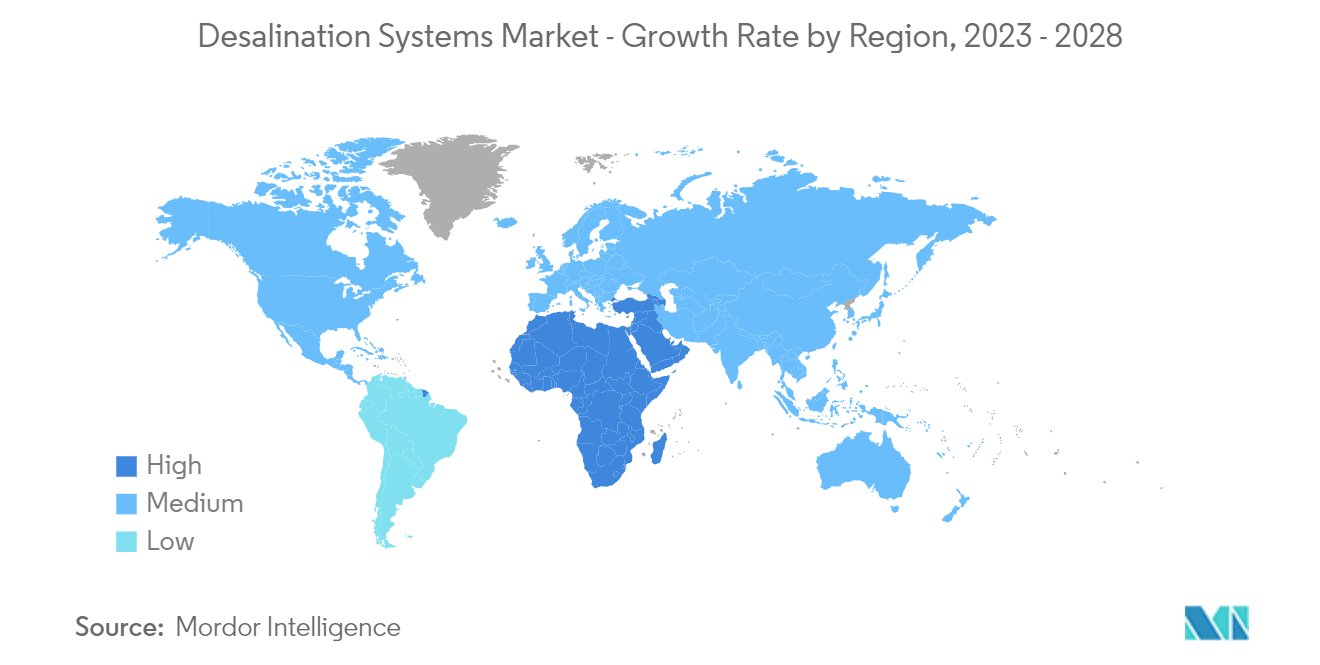
- The Middle East and Africa emerged as the largest market for desalination systems due to the growing demand for desalinated water from various countries for industrial applications.
Desalination System Market Trends
Municipal Application to Dominate the Market
- Municipal application accounts for the highest percentage of desalination systems in installed plants. The world is in need of fresh water, and 97% of the water on earth is salted, with an average salinity of 3.5%, which is way too high for drinking, industry, or agriculture.
- Water is fundamental to life, yet sustainable freshwater resources are increasingly limited in quantity and quality. Population growth, changing water consumption patterns, and climate change threaten freshwater sources.
- The majority of the existing plants are handled by municipal departments in various countries. For instance, the Middle East & Africa get their fresh water supply from desalination plants. Over 90% of the water supply is supplied by municipal corporations in these regions.
- A Memorandum of Understanding (MoU) was signed between Morocco’s government and the OCP group in 2023, aiming to provide the cities of Safi, El Jadida, and neighboring regions with drinkable water using seawater desalination.
- According to a statement from the Ministry of Logistics and Water, operations in the Safi seawater desalination plant have commenced. The plan has an ambitious aim of producing approximately 10 million cubic meters of drinking water in the year 2023.
- In India, in 2023, in a bid to meet Mumbai’s burgeoning water demand, the Brihanmumbai Municipal Corporation (BMC) has rolled out tenders on the ambitious desalination plant project.
- The project is at an estimated cost of INR 13,028 crore (USD 1582.358 million). The civic body seeks to design and build the project over the course of the next three years. The data furnished by the civic body shows that while the estimated cost for the first phase of the project is INR 5,625 crore (USD 683.2 million), the second phase, which seeks to expand the plant to a capacity of 400 MLD, is estimated at INR 7,404 crore (USD 899.2 million).
- Therefore, all the above-mentioned factors help in the growth of desalination systems for municipal application.
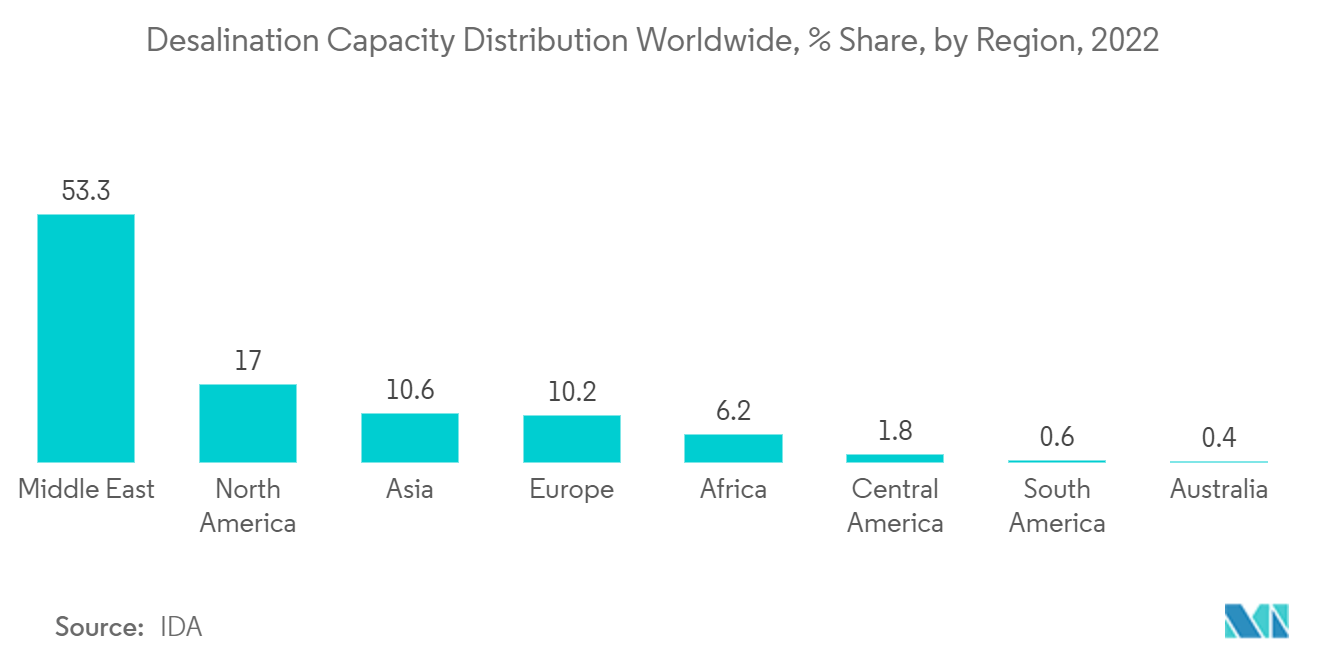
Middle East and Africa Dominates the Market
- The Middle East and Africa emerged as the largest market for desalination systems. The demand for desalination systems in the region is mainly due to the growing demand for desalinized water for drinking and industrial and agricultural use.
- In addition to this, growing population, rapid urbanization, and limited availability of surface water have increased in countries such as Saudi Arabia, UAE, Egypt, Iran, Kuwait, Oman, and South Africa, among others; this has, in turn, increased the consumption of fresh water, which is driving the demand for desalination systems in the region.
- Saudi Arabia is classified as one of the most water-scarce nations on the planet. Saudi Arabia is among the world’s largest consumers of water, next to the United States and Canada, with daily water consumption of 250 liters per capita.
- To meet the demand, Saudi Arabia has become the largest producer of desalinated water worldwide, accounting for 25% of the global supply. It is home to the world’s largest desalination plants.
- In March 2022, Saudi Arabia announced more than 60 water projects worth SAR 35 billion (USD 9.33 billion) that will strengthen the Kingdom’s position as the world’s largest water desalination market, as reported at the 3rd MENA Desalination Projects Forum 2022.
- After completion, these projects are expected to increase the desalination capacity to 7.5 million cubic meters of water per day by 2027, from 2.54 cubic meters per day in 2021, nearly tripling the capacity in six years.
- Recently, Algeria has faced severe drought due to the decrease in rainfall in the country over the last decade, which is between 30% and 40%, which made the policymakers expand plans of desalination to meet the daily needs of both households and industrial applications.
- Algeria is home to Africa’s largest desalination plant, the HammaSeawater Desalination Plant, with a freshwater production capacity of 200,000 cubic meters per day.
- In October 2022, the Emirates Water and Electricity Company (EWEC) received proposals from three companies for the development of a seawater desalination plant in Abu Dhabi. Spanish infrastructure group Acciona, France’s Engie, and GS Inimah have shown interest in building the Shuweihatplant, which will supply up to 70 million imperial gallons daily in Abu Dhabi's Al Dhafra region.
- Thus, all the factors mentioned above impact the demand for desalination systems in the Middle East and Africa region.
Desalination System Industry Overview
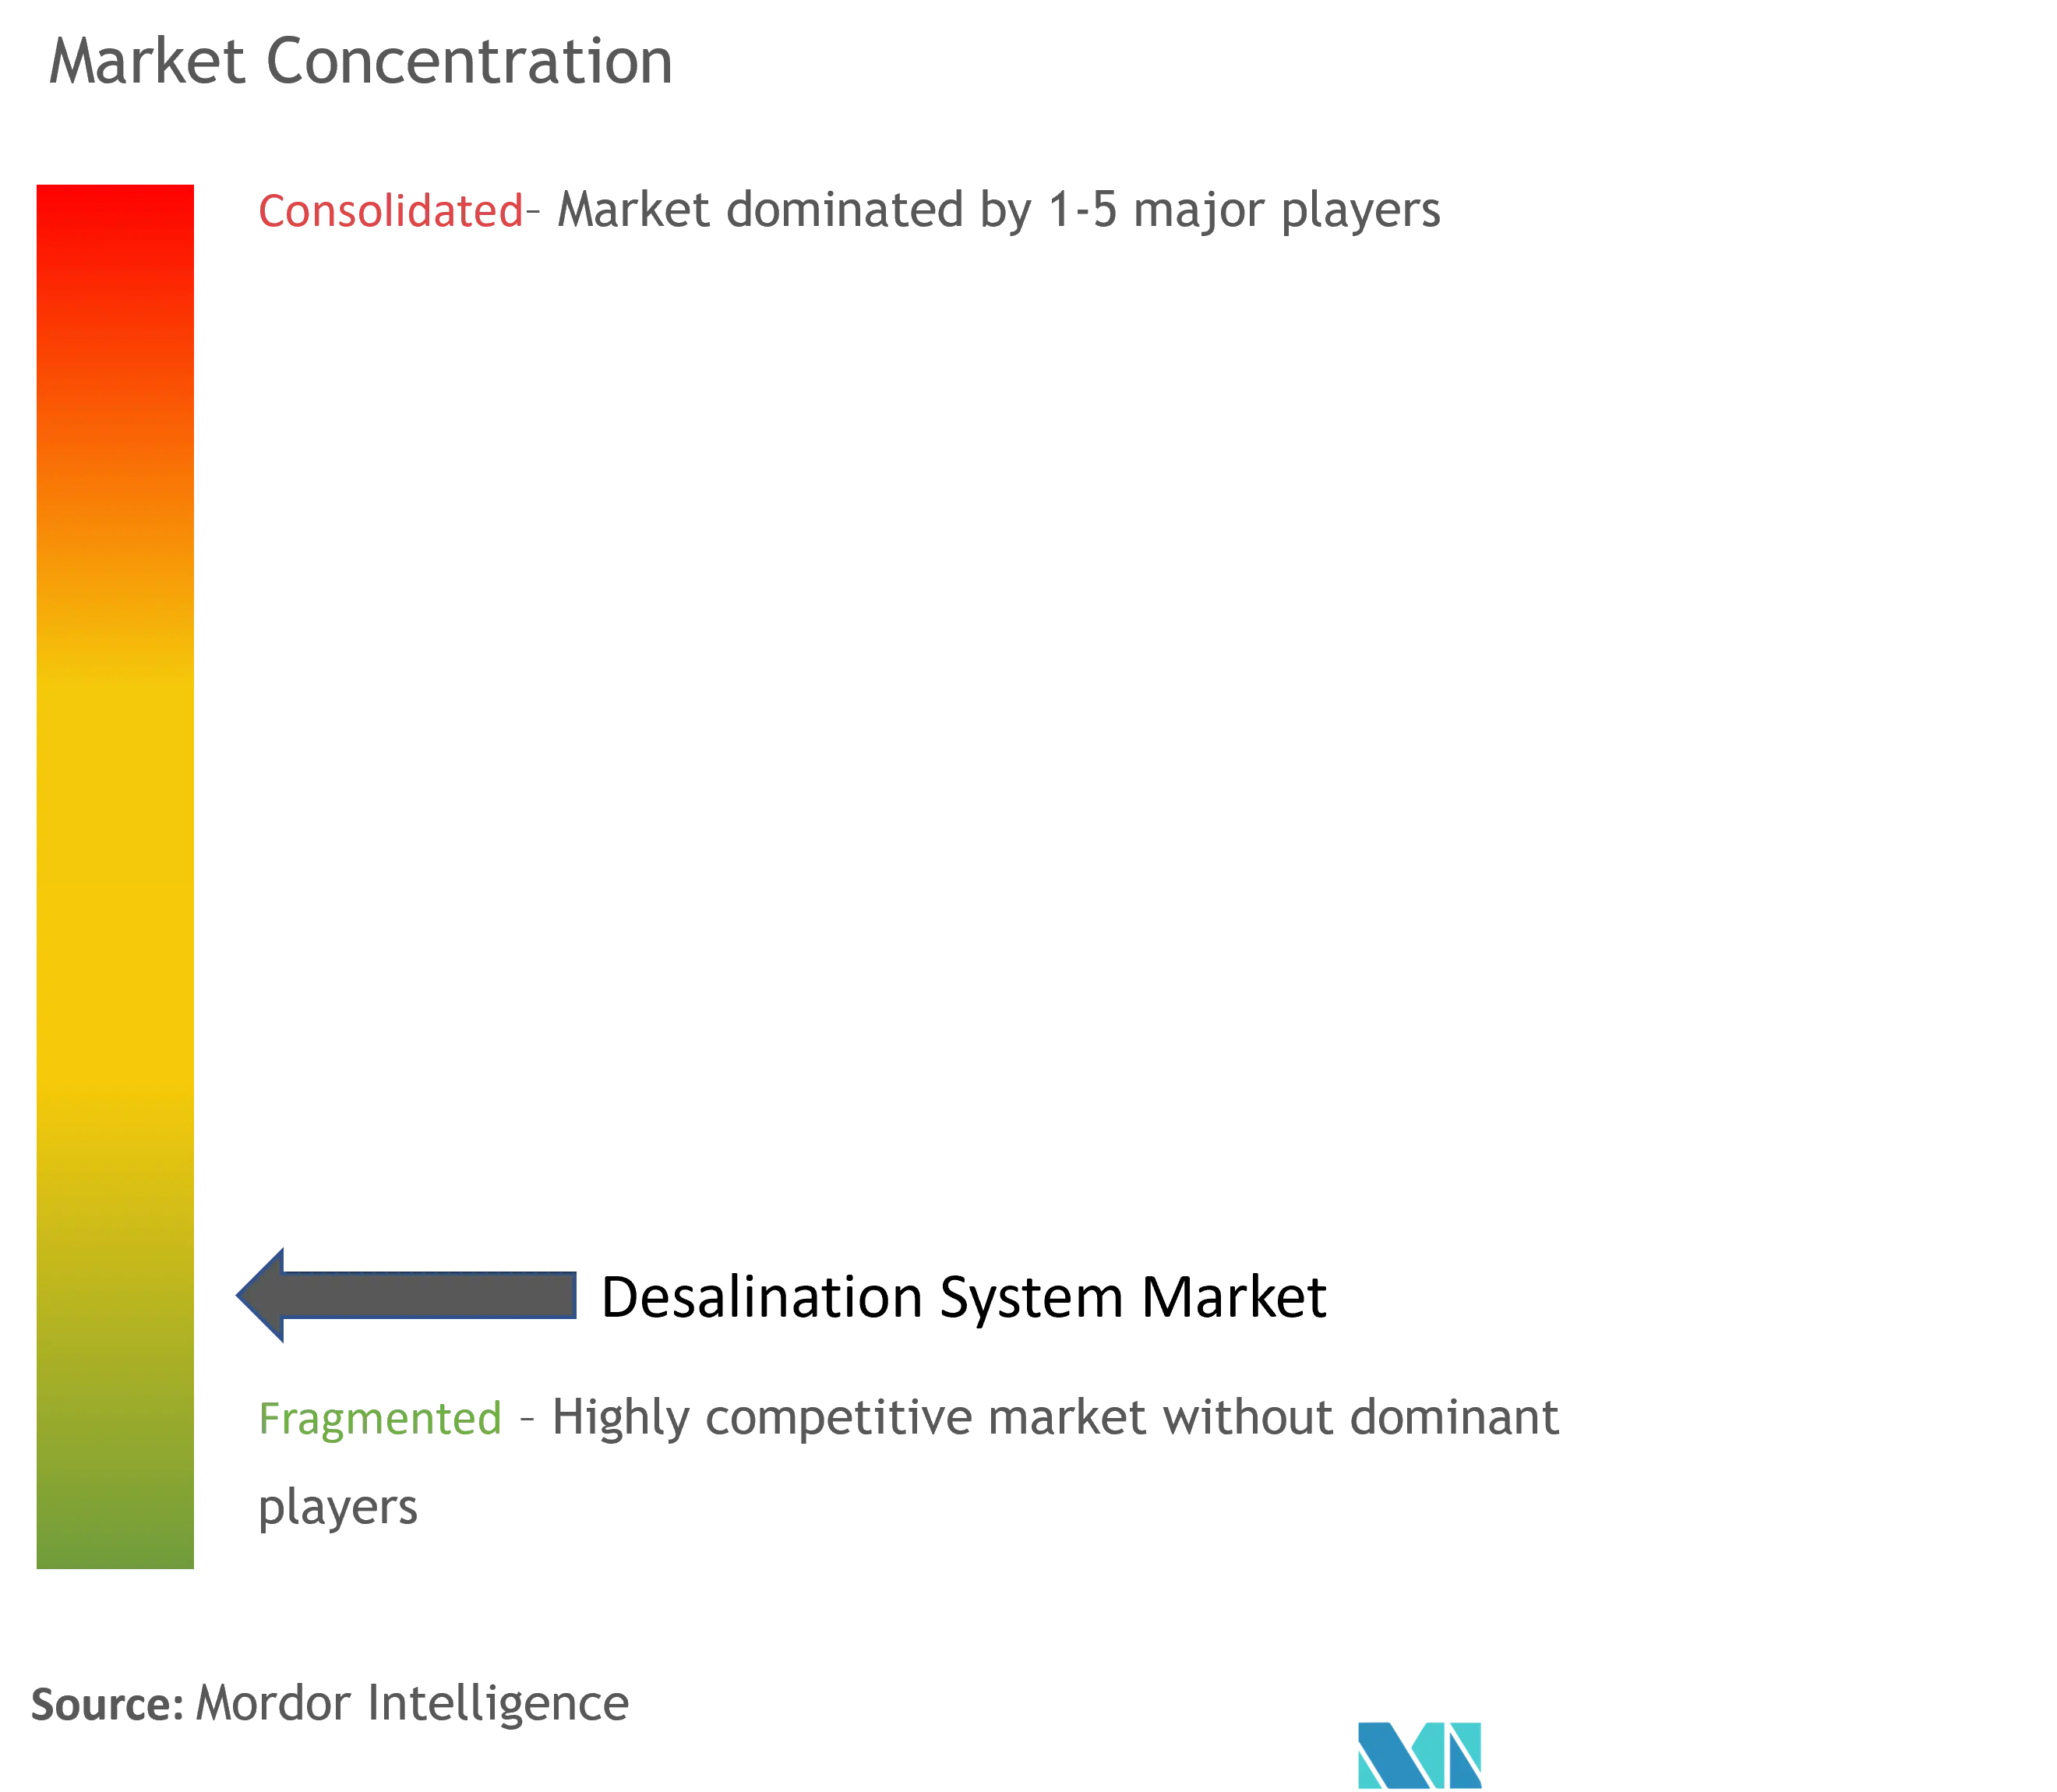
The desalination system market is highly fragmented. The major players (not in any particular order) include Veolia, Doosan Enerbility, Aquatech International LLC, Fisia Italimpianti S.p.A., and IDE, among others.
Desalination System Market Leaders
Veolia
Doosan Enerbility
Aquatech International LLC
Fisia Italimpianti S.p.A.
IDE
*Disclaimer: Major Players sorted in no particular order
Desalination System Market News
- April 2022: Veolia Water Technologies, a subsidiary of the Veolia group and leading specialist in water treatment announced the Asia-Pacific launch of the Barrel, an integrated plug-and-play reverse osmosis (RO) technology. The Barrel produces fresh water that complies with all water quality regulations while meeting the demands and expectations of the desalination market.
- August 2022: Doosan Enerbility signed a contract with Shuaibah Three Water Desalination Co., a special purpose company established by ACWA Power, to construct the Shuaibah 3 seawater desalination plant to build a seawater desalination plant worth JPY 840 billion (USD 633 billion) in Saudi Arabia. This project involves building a reverse osmosis (RO) seawater desalination plant about 110 km south of Jeddah City.
Desalination System Market Report - Table of Contents
1. INTRODUCTION
1.1 Study Assumptions
1.2 Scope of the Study
2. RESEARCH METHODOLOGY
3. EXECUTIVE SUMMARY
4. MARKET DYNAMICS
4.1 Drivers
4.1.1 Increasing Demand from Middle East and North Africa
4.1.2 Growing Demand of Desalinated Water for Industrial Purposes
4.2 Restraints
4.2.1 RO Membrane Fouling
4.2.2 Environmental Repercussions of Desalination
4.3 Industry Value Chain Analysis
4.4 Porter's Five Forces Analysis
4.4.1 Bargaining Power of Suppliers
4.4.2 Bargaining Power of Consumers
4.4.3 Threat of New Entrants
4.4.4 Threat of Substitute Products and Services
4.4.5 Degree of Competition
5. MARKET SEGMENTATION (Market Size in Value)
5.1 Technology of Separation
5.1.1 Thermal Technology
5.1.1.1 Multi-stage Flash Distillation (MSF)
5.1.1.2 Multi-effect Distillation (MED)
5.1.1.3 Vapor Compression Distillation
5.1.2 Membrane Technology
5.1.2.1 Electrodialysis (ED)
5.1.2.2 Electrodialysis Reversal (EDR)
5.1.2.3 Reverse Osmosis (RO)
5.1.2.4 Other Membrane Technologies
5.2 Application
5.2.1 Municipal
5.2.2 Industrial
5.3 Geography
5.3.1 Asia-Pacific
5.3.1.1 China
5.3.1.2 India
5.3.1.3 Japan
5.3.1.4 Rest of Asia-Pacific
5.3.2 North America
5.3.2.1 United States
5.3.2.2 Mexico
5.3.3 Europe
5.3.3.1 Germany
5.3.3.2 United Kingdom
5.3.3.3 Spain
5.3.3.4 Rest of Europe
5.3.4 South America
5.3.4.1 Brazil
5.3.4.2 Chile
5.3.4.3 Rest of South America
5.3.5 Middle-East and Africa
5.3.5.1 Saudi Arabia
5.3.5.2 Algeria
5.3.5.3 United Arab Emirates
5.3.5.4 Egypt
5.3.5.5 Rest of Middle-East and Africa
6. COMPETITIVE LANDSCAPE
6.1 Mergers and Acquisitions, Joint Ventures, Collaborations, and Agreements
6.2 Market Ranking Analysis
6.3 Strategies Adopted by Leading Players
6.4 Company Profiles
6.4.1 ACCIONA
6.4.2 Aquatech International LLC
6.4.3 Biwater Holdings Limited
6.4.4 Coxabengoa
6.4.5 Dupont
6.4.6 Doosan Enerbility
6.4.7 Evoqua Water Technologies LLC
6.4.8 Fisia Italimpianti S.p.A.
6.4.9 IDE Water Technologies
6.4.10 Metito
6.4.11 Ocean Oasis
6.4.12 Veolia
- *List Not Exhaustive
7. MARKET OPPORTUNITIES AND FUTURE TRENDS
7.1 Upcoming Desalination Projects
7.2 Other Opportunities
Desalination System Industry Segmentation
The purpose of a desalination system is to clean or purify brackish water or seawater and supply water with total dissolved solids. The desalination system includes several technologies, among which reverse osmosis is largely used for the purification process.
The technology of separation, application, and geography segments the desalination system market. By the technology of separation, the market is segmented into thermal technology (multi-stage flash distillation (MSF), multi-effect distillation (MED), and vapor compression distillation) and membrane technology (electrodialysis (ED), electrodialysis reversal (EDR), reverse osmosis (RO), and other membrane technologies (nanofiltration, ultrafiltration, and microfiltration)). By application, the market is segmented into municipal, industrial, and other applications (leather, defense). The report also covers the size and forecasts for the desalination system market in 14 countries across major regions.
For each segment, the market sizing and forecasts have been done based on revenue (USD).
| Technology of Separation | ||||||
| ||||||
|
| Application | |
| Municipal | |
| Industrial |
| Geography | |||||||
| |||||||
| |||||||
| |||||||
| |||||||
|
Desalination System Market Research Faqs
How big is the Desalination System Market?
The Desalination System Market size is expected to reach USD 1.54 trillion in 2024 and grow at a CAGR of 8.91% to reach USD 2.35 trillion by 2029.
What is the current Desalination System Market size?
In 2024, the Desalination System Market size is expected to reach USD 1.54 trillion.
Who are the key players in Desalination System Market?
Veolia, Doosan Enerbility, Aquatech International LLC, Fisia Italimpianti S.p.A. and IDE are the major companies operating in the Desalination System Market.
Which is the fastest growing region in Desalination System Market?
Middle East and Africa is estimated to grow at the highest CAGR over the forecast period (2024-2029).
Which region has the biggest share in Desalination System Market?
In 2024, the Middle East and Africa accounts for the largest market share in Desalination System Market.
What years does this Desalination System Market cover, and what was the market size in 2023?
In 2023, the Desalination System Market size was estimated at USD 1.41 trillion. The report covers the Desalination System Market historical market size for years: 2019, 2020, 2021, 2022 and 2023. The report also forecasts the Desalination System Market size for years: 2024, 2025, 2026, 2027, 2028 and 2029.
Desalination System Industry Report
Statistics for the 2024 Desalination System market share, size and revenue growth rate, created by Mordor Intelligence™ Industry Reports. Desalination System analysis includes a market forecast outlook to for 2024 to 2029 and historical overview. Get a sample of this industry analysis as a free report PDF download.
