Market Overview
| Study Period | 2017 - 2030 |
| Base Year For Estimation | 2024 |
| Forecast Data Period | 2025 - 2030 |
| Market Size (2025) | USD 176.7 Billion |
| Market Size (2030) | USD 240.5 Billion |
| Growth Rate (2025 - 2030) | 6.36% CAGR |
| Market Concentration | Low |
Major Players*Disclaimer: Major Players sorted in no particular order Image © Mordor Intelligence. Reuse requires attribution under CC BY 4.0. |
|

Asia-Pacific Fertilizers Market Analysis
The Asia-Pacific Fertilizers Market size is estimated at 176.7 billion USD in 2025, and is expected to reach 240.5 billion USD by 2030, growing at a CAGR of 6.36% during the forecast period (2025-2030).
The Asia-Pacific fertilizer industry plays a pivotal role in the region's agricultural landscape, with agriculture employing one-fifth of the population and occupying more than half of the available land. The sector has witnessed significant transformation through technological advancements in fertilizer production and application methods, particularly in precision farming techniques. Modern agricultural practices have evolved to incorporate data-driven decision-making for optimal plant nutrients management, leading to more efficient fertilizer usage. The integration of smart farming technologies has enabled farmers to apply fertilizers more precisely, reducing waste and environmental impact while maximizing crop yields.
The industry has experienced substantial structural changes in production and trade dynamics. China, emerging as a global powerhouse, currently accounts for 25% of global fertilizer production, establishing itself as a crucial player in the international market. This dominance has reshaped regional supply chains and influenced pricing mechanisms across the Asia-Pacific region. The industry has also witnessed a significant shift toward sustainable and environmentally conscious production methods, with fertilizer manufacturers investing in green technologies and cleaner production processes.
The market landscape is characterized by evolving agricultural practices and changing crop patterns. A notable expansion of 10.5 million hectares in cultivation area between 2017 and 2022 has fundamentally altered the demand dynamics for agricultural nutrients. The industry has responded by developing specialized products tailored to specific crop requirements and soil conditions. Innovation in fertilizer formulations has become a key focus area, with manufacturers developing enhanced efficiency fertilizers that provide better nutrient absorption rates and reduced environmental impact.
The sector faces significant supply chain restructuring, particularly evident in countries like India, which depends heavily on imports for its agricultural inputs needs, requiring 25% of its urea, 55% of its phosphorus, and 100% of its potash from international markets. This dependency has led to the emergence of new trade partnerships and strategic alliances among countries in the region. The industry has witnessed increased investments in domestic production capabilities and infrastructure development to reduce import dependencies. Fertilizer manufacturers are establishing regional manufacturing hubs and distribution networks to ensure stable supply chains and better market penetration.
Asia-Pacific Fertilizers Market Trends
The increase in cultivation area is attributed to the growing domestic and export demand
- Field crop cultivation dominates the Asia-Pacific region, accounting for more than 95% of the total crop area. Rice, wheat, and corn are the major field crops produced in the region, together accounting for about 38% of the total crop area in 2022. The rising area under cultivation is expected to increase the need for fertilizer usage in the country.
- The Asia-Pacific region, which includes China, India, Pakistan, and Australia, is among the world's largest wheat producers. China and India are also the world's largest wheat producers and consumers. Wheat is one of the major staple foods of this region, driving the increase in demand and consumption. Notably, the area under wheat cultivation increased by 638.6 thousand ha from 2018 to 2022. In 2022, China accounted for the production of 138 million metric tons of wheat, making it the largest wheat producer in the world, and India recorded wheat production of 103 million metric tons.
- Rice is the largest cultivated field crop in the region. Its cultivation alone accounted for about 16.44% of the total agricultural land in 2022. Rice is the staple food of Asia and most parts of the Pacific region. China was projected to produce 147 million tons of rice, and India was expected to harvest 124 million tons of rice in 2022. India was also expected to consume 109 million tons while exporting a world-leading 19.5 million tons.
- The surge in both domestic and international demand for field crops has prompted an expansion in the cultivation area dedicated to these crops. This significant increase in cultivated land is expected to have a direct and positive impact on the Asia-Pacific fertilizer market throughout the 2023-2030 period.

Understand The Key Trends Shaping This Market
Download PDF
About 28% of nitrous oxide emissions from cropland globally are from Chinese agricultural lands
- The average application rate of primary nutrients (nitrogen, potassium, and phosphorus) in field crops in China stood at 129.1 kg/ha in 2022. Nitrogen dominated the mix, accounting for 58.5%, followed by potassium at 25.3% and phosphorus at 16.1%. The primary nutrients are predominantly applied through soil-based methods. In 2022, conventional soil-based primary macronutrient fertilizers held a commanding 69.2% share of the primary macronutrient fertilizer market.
- Asia witnesses a significant demand for primary nutrients, especially nitrogen and potassium fertilizers, owing to the prevalent deficiencies in these nutrients in the region's soils. Notably, the Asia-Pacific region, with its vast land area and population, leads the global agrochemical production and consumption. China's agricultural lands alone contribute to about 28% of the world's nitrous oxide emissions from croplands.
- Among field crops, wheat recorded the highest average primary nutrient application rate at 214.9 kg/ha in 2022. Nitrogen took the lead among primary nutrients, with an average application rate of 448.5 kg/ha. This high nitrogen demand is attributed to its crucial role in plant metabolism, as well as its presence in chlorophyll and amino acids.
- The contamination of surface and groundwater with nitrogen and phosphorus has been linked to inadequate guidance on fertilizer application rates and the potential for excessive crop yields. However, there is a noticeable shift toward the adoption of highly efficient fertilizers.

OTHER KEY INDUSTRY TRENDS COVERED IN THE REPORT
- Micro and sprinkler irrigation systems has made horticultural crop cultivation more convenient in Asia-Pacific
- The deficiency of boron, zinc, manganese, and molybdenum is extremely common in cruciferous vegetables
- Sandy soils and heavy dark clay soils are most likely to show secondary micronutrient deficiencies
- India, China, Pakistan, Bangladesh, and Indonesia collectively accounted for 80% of agricultural irrigation usage in Asia-Pacific in 2022
- Rapeseed/canola accounted for the highest average nutrient application rate of 9.2 kg/hectare in 2022
- China and Bangladesh exhibit an average primary macronutrient application rate in vegetable crops that surpasses the Asia-Pacific average by 1.60%
- Salinity is the primary factor behind the declining calcium and magnesium content in Asia-Pacific, which exhibits higher salinity levels than soils in other parts of the world
Segment Analysis: Type
Straight Fertilizers Segment in Asia-Pacific Fertilizers Market
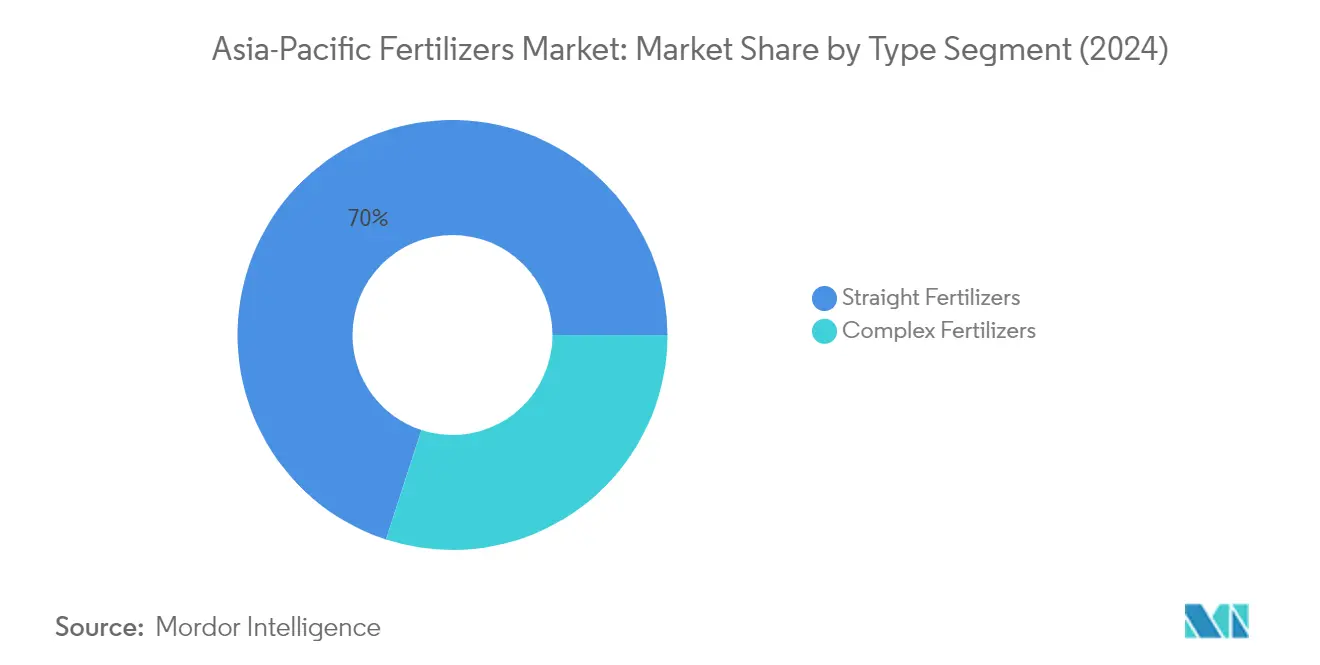
Straight fertilizers dominate the Asia-Pacific fertilizers market, commanding approximately 70% of the total market value in 2024. These solid fertilizers, which provide a single nutrient to crops, are particularly popular due to their cost-effectiveness and ability to address specific nutrient deficiencies in soil. The segment's dominance is primarily driven by the widespread use of nitrogenous fertilizers, which account for nearly 52% of straight fertilizers, followed by phosphatic fertilizers at 27%. The segment is also experiencing the fastest growth trajectory, projected to expand at around 6% CAGR through 2029, driven by increasing adoption in field crops and the rising need for targeted nutrient application in precision farming practices. The growth is further supported by government subsidies on single-nutrient fertilizers in major agricultural economies like India and China, along with the segment's ability to offer farmers greater flexibility in nutrient management and cost optimization.
Complex Fertilizers Segment in Asia-Pacific Fertilizers Market
Compound fertilizers, which supply multiple nutrients simultaneously, represent the remaining segment of the Asia-Pacific fertilizers market. These fertilizers are gaining traction among farmers seeking comprehensive nutrient solutions in a single application. The segment's value proposition lies in its ability to provide balanced nutrition, reduce application costs, and improve overall fertilizer use efficiency. Complex fertilizers are particularly popular in horticultural applications and high-value crops where precise nutrient ratios are crucial for optimal yield and quality. The segment's growth is supported by increasing awareness about balanced crop nutrition and the development of innovative formulations tailored to specific crop requirements.
Segment Analysis: Form
Conventional Segment in Asia-Pacific Fertilizers Market
The conventional fertilizers segment continues to dominate the Asia-Pacific fertilizers market, commanding approximately 89% market share in 2024. This substantial market presence is primarily attributed to the widespread adoption and cost-effectiveness of conventional fertilizers compared to their specialty fertilizers counterparts. The segment's dominance is particularly evident in field crops, which account for about 85% of conventional fertilizer usage. Primary nutrients, especially nitrogen-based fertilizers, constitute around 69% of the conventional fertilizer market, highlighting their crucial role in maintaining soil fertility and crop yields. The segment's strong position is further reinforced by well-established distribution networks, government subsidies, and farmers' familiarity with traditional application methods.
Specialty Segment in Asia-Pacific Fertilizers Market
The specialty fertilizers segment is emerging as the fastest-growing category in the Asia-Pacific fertilizers market, with projections indicating robust growth through 2024-2029. This growth is driven by increasing awareness about advanced fertilization techniques and the rising adoption of precision farming practices. Within the specialty segment, liquid fertilizers lead with approximately 56% share, followed by water-soluble fertilizers at 42%. The segment's expansion is particularly notable in China and India, which together account for over 84% of the regional specialty fertilizers market. Factors such as the growing emphasis on sustainable agriculture, rising demand for high-value crops, and increasing adoption of modern irrigation systems are propelling the segment's growth trajectory.
Segment Analysis: Application Mode
Soil Application Segment in Asia-Pacific Fertilizers Market
Soil application continues to dominate the Asia-Pacific fertilizers market, commanding approximately 89% of the total market value in 2024. This traditional method of fertilizer application remains the most widely adopted approach due to its cost-effectiveness and simplicity, requiring minimal specialized equipment. The segment's prominence is particularly evident in conventional fertilizer applications, where it accounts for nearly all applications of primary macronutrients. Soil-based fertilizers, valued at around USD 149 billion, demonstrate strong market presence especially in field crops, which constitute about 70% of total conventional soil-based fertilizer consumption. The method's popularity is further reinforced by its effectiveness in improving root system development and ensuring equal dispersion of nutrients across the soil surface, making it particularly beneficial during the initial growth stages of various crops.
Fertigation Segment in Asia-Pacific Fertilizers Market
The fertigation segment is emerging as the fastest-growing application method in the Asia-Pacific fertilizers market, projected to expand at approximately 6.5% through 2029. This growth is primarily driven by the increasing adoption of advanced irrigation systems and the method's superior efficiency in nutrient delivery. Fertigation's rising popularity can be attributed to its ability to reduce fertilizer usage by 20-40% compared to traditional methods, while simultaneously improving nutrient absorption rates through direct application at the root zone. The segment's growth is particularly pronounced in horticultural crops, where mechanized irrigation systems facilitate efficient fertigation application. The method's ability to minimize nutrient leaching and ensure uniform distribution of fertilizers throughout the growing season is attracting increased adoption among modern farmers seeking improved resource efficiency.
Remaining Segments in Application Mode
The foliar application method represents a crucial segment in the Asia-Pacific fertilizers market, offering unique advantages in specific agricultural scenarios. This method is particularly effective for delivering micronutrients and addressing immediate nutrient deficiencies, as it allows for direct absorption through plant leaves. Foliar application has gained significant traction in scenarios where soil conditions limit nutrient uptake or when rapid correction of nutrient deficiencies is required. The method's precision in targeting specific plant parts and its effectiveness in supplementing soil-based nutrition programs make it an essential component of integrated fertilizer application strategies, especially in high-value crops and during critical growth stages where immediate nutrient absorption is crucial.
Asia-Pacific Fertilizers Market Geography Segment Analysis
Asia-Pacific Fertilizers Market in China
China stands as the cornerstone of the Asia-Pacific Fertilizers Market, commanding approximately 33% of the total market share in 2024. The country's dominance is underpinned by its vast agricultural landscape and intensive farming practices. China's fertilizer market is characterized by a strong focus on nitrogen-based fertilizers, particularly urea, which plays a crucial role in supporting its extensive rice and wheat cultivation. The government's emphasis on food security and agricultural self-sufficiency continues to drive fertilizer demand. The country has also witnessed a significant shift towards more efficient fertilizer applications, with an increasing adoption of precision farming techniques. Additionally, China's robust distribution network, comprising thousands of retailers and wholesalers, ensures widespread availability of fertilizers across its agricultural regions. The market is further strengthened by domestic production capabilities, with several large-scale manufacturing facilities operating throughout the country.
Asia-Pacific Fertilizers Market in India
India's fertilizer market is poised for remarkable growth, with projections indicating a robust expansion at approximately 6% CAGR from 2024 to 2029. The country's fertilizer sector is undergoing a significant transformation, driven by increasing adoption of balanced nutrient application practices and growing awareness about soil health management. The government's continued support through subsidies and various agricultural development programs has been instrumental in shaping the market dynamics. India's fertilizer industry is witnessing a gradual shift towards specialty fertilizers, particularly in high-value crop segments. The country's diverse agro-climatic conditions and varying soil types necessitate a wide range of fertilizer products, leading to a highly diversified market. The implementation of direct benefit transfer schemes has improved the efficiency of fertilizer distribution and reduced market distortions. Furthermore, the increasing focus on organic and bio-fertilizers reflects a growing awareness of sustainable agricultural practices among Indian farmers.
Asia-Pacific Fertilizers Market in Japan
Japan's fertilizer market exemplifies technological sophistication and efficiency in nutrient management. The country's agricultural sector is characterized by intensive farming practices on limited arable land, necessitating highly efficient fertilizer usage. Japanese farmers have embraced precision agriculture techniques, incorporating smart farming technologies for optimal fertilizer application. The market shows a strong preference for specialty and controlled-release fertilizers, reflecting the country's focus on quality and environmental sustainability. Japan's stringent regulatory framework ensures high-quality standards in fertilizer production and application. The country's aging farmer population has led to increased mechanization and automation in fertilizer application methods. Additionally, Japan's research and development initiatives continue to drive innovations in fertilizer technology, particularly in areas of environmental protection and resource efficiency. The market also benefits from well-established distribution channels and strong technical support services for farmers. Notably, a leading Japanese fertilizer company is at the forefront of these advancements, contributing significantly to the market's growth.
Asia-Pacific Fertilizers Market in Other Countries
The fertilizer markets in other Asia-Pacific countries exhibit diverse characteristics shaped by their unique agricultural landscapes and economic conditions. Countries like Australia, Bangladesh, Indonesia, Pakistan, the Philippines, Thailand, and Vietnam each contribute significantly to the regional market dynamics. These markets are characterized by varying levels of agricultural modernization and different approaches to fertilizer usage. Several countries are focusing on reducing import dependency through domestic production capacity enhancement. The adoption of modern farming techniques and precision agriculture varies significantly across these nations. Environmental concerns and sustainability initiatives are increasingly influencing fertilizer choices in these markets. Government policies and subsidy programs play crucial roles in shaping market dynamics across these countries. Additionally, these markets are witnessing growing interest in specialty fertilizers and balanced nutrient management approaches, though adoption rates vary considerably based on local agricultural practices and economic conditions. The presence of Asia's largest fertilizer company and some of the largest fertilizer companies in the world further underscores the strategic importance of this region.
Get Analysis on Important Geographic Markets
Download PDF
Asia-Pacific Fertilizers Industry Overview
Top Companies in Asia-Pacific Fertilizers Market
The leading major fertilizer companies in the market are focusing on strategic initiatives to maintain their competitive edge. Product innovation has emerged as a key trend, with companies developing specialized fertilizer formulations tailored to specific crops and soil conditions. Operational agility is demonstrated through investments in advanced manufacturing facilities and distribution networks, enabling companies to respond swiftly to market demands. Strategic partnerships and collaborations with agricultural research institutions and technology providers are becoming increasingly common to enhance product development capabilities. Companies are also expanding their geographical presence through acquisitions and joint ventures, particularly in emerging agricultural markets. The emphasis on sustainable and environmentally friendly fertilizer solutions reflects the industry's adaptation to changing regulatory requirements and consumer preferences.
Market Structure Shows Regional Leadership Dynamics
The Asia-Pacific fertilizers market exhibits a fragmented structure with a mix of global conglomerates and regional specialists. Local players maintain strong positions in their respective markets through established distribution networks and a deep understanding of regional agricultural practices. The market is characterized by the presence of both vertically integrated fertilizer manufacturers controlling the entire value chain and specialized manufacturers focusing on specific product segments. The competitive dynamics vary significantly across different regions, with some markets dominated by state-owned enterprises while others feature more private sector participation.
The industry has witnessed significant consolidation activities, particularly in mature markets. Mergers and acquisitions are driven by the need to achieve economies of scale, expand product portfolios, and strengthen market presence in high-growth regions. Companies are increasingly pursuing strategic alliances to overcome entry barriers in new markets and access advanced technologies. The trend towards consolidation is particularly evident in specialty fertilizer segments, where technical expertise and research capabilities are crucial for success.
Innovation and Sustainability Drive Future Success
For incumbent companies to maintain and increase their market share, developing innovative and sustainable fertilizer solutions will be crucial. Success factors include investing in research and development to create products that improve nutrient efficiency and reduce environmental impact. Companies need to strengthen their distribution networks and develop digital platforms to enhance customer engagement and provide technical support. Building strong relationships with agricultural communities and offering comprehensive crop nutrition solutions rather than standalone products will be essential for maintaining a competitive advantage.
New entrants and challenger companies can gain ground by focusing on niche market segments and developing specialized products for specific crop types or regional conditions. Success will depend on building efficient supply chains and establishing strong relationships with local distributors. Companies must also navigate the complex regulatory landscape, particularly regarding environmental protection and product safety standards. The ability to adapt to changing agricultural practices, such as precision farming and sustainable agriculture, will be crucial for long-term success. Investment in digital technologies and sustainable manufacturing processes will become increasingly important for maintaining competitiveness. The role of agrichemicals and other agricultural inputs will be pivotal in supporting these advancements.
Asia-Pacific Fertilizers Market Leaders
-
Coromandel International Ltd.
-
ICL Group Ltd
-
Sinofert Holdings Limited
-
Xinyangfeng Agricultural Technology Co., Ltd.
-
Yara International ASA
- *Disclaimer: Major Players sorted in no particular order

Need More Details on Market Players and Competitors?
Download PDF
Asia-Pacific Fertilizers Market News
- January 2023: ICL has entered into a strategic partnership agreement with General Mills, in which it will be the supplier of strategic specialty phosphate solutions to General Mills. The long-term agreement will also focus on international expansion.
- May 2022: ICL launched three new NPK formulations of Solinure, a product with increased trace elements to optimize yields.
- May 2022: ICL signed an agreement with customers in India and China to supply 600,000 and 700,000 metric tons of potash, respectively, in 2022 at USD 590 per ton.
Free With This Report
Along with the report, We also offer a comprehensive and exhaustive data pack with 25+ graphs on area under cultivation and average application rate per hectare. The data pack includes Globe, North America, Europe, Asia-Pacific, South America, and Africa.


List of Tables & Figures
- Figure 1:
- CULTIVATION OF FIELD CROPS IN HECTARE, ASIA-PACIFIC, 2017 - 2022
- Figure 2:
- CULTIVATION OF HORTICULTURAL CROPS IN HECTARE, ASIA-PACIFIC, 2017 - 2022
- Figure 3:
- CONSUMPTION OF MICRONUTRIENTS BY FIELD CROPS IN KG/HECTARE, ASIA-PACIFIC, 2022
- Figure 4:
- CONSUMPTION OF MICRONUTRIENTS BY HORTICULTURAL CROPS IN KG/HECTARE, ASIA-PACIFIC, 2022
- Figure 5:
- CONSUMPTION OF PRIMARY NUTRIENTS BY FIELD CROPS IN KG/HECTARE, ASIA-PACIFIC, 2022
- Figure 6:
- CONSUMPTION OF PRIMARY NUTRIENTS BY HORTICULTURAL CROPS IN KG/HECTARE, ASIA-PACIFIC, 2022
- Figure 7:
- CONSUMPTION OF SECONDARY MACRONUTRIENTS BY FIELD CROPS IN KG/HECTARE, ASIA-PACIFIC, 2022
- Figure 8:
- CONSUMPTION OF SECONDARY MACRONUTRIENTS BY HORTICULTURAL CROPS IN KG/HECTARE, ASIA-PACIFIC, 2022
- Figure 9:
- AGRICULTURAL LAND EQUIPPED FOR IRRIGATION IN HECTARE, ASIA-PACIFIC, 2022
- Figure 10:
- FERTILIZER FERTILIZER CONSUMPTION IN METRIC TON, ASIA-PACIFIC, 2017 - 2030
- Figure 11:
- FERTILIZER FERTILIZER CONSUMPTION IN USD, ASIA-PACIFIC, 2017 - 2030
- Figure 12:
- FERTILIZER CONSUMPTION BY TYPE IN METRIC TON, ASIA-PACIFIC, 2017 - 2030
- Figure 13:
- FERTILIZER CONSUMPTION BY TYPE IN USD, ASIA-PACIFIC, 2017 - 2030
- Figure 14:
- FERTILIZER CONSUMPTION VOLUME BY TYPE IN %, ASIA-PACIFIC, 2017 VS 2023 VS 2030
- Figure 15:
- FERTILIZER CONSUMPTION VALUE BY TYPE IN %, ASIA-PACIFIC, 2017 VS 2023 VS 2030
- Figure 16:
- COMPLEX FERTILIZER CONSUMPTION IN METRIC TON, ASIA-PACIFIC, 2017 - 2030
- Figure 17:
- COMPLEX FERTILIZER CONSUMPTION IN USD, ASIA-PACIFIC, 2017 - 2030
- Figure 18:
- COMPLEX FERTILIZER CONSUMPTION VALUE BY CROP TYPE IN %, ASIA-PACIFIC, 2023 VS 2030
- Figure 19:
- STRAIGHT FERTILIZER CONSUMPTION BY NUTRIENT IN METRIC TON, ASIA-PACIFIC, 2017 - 2030
- Figure 20:
- STRAIGHT FERTILIZER CONSUMPTION BY NUTRIENT IN USD, ASIA-PACIFIC, 2017 - 2030
- Figure 21:
- STRAIGHT FERTILIZER CONSUMPTION VOLUME BY NUTRIENT IN %, ASIA-PACIFIC, 2017 VS 2023 VS 2030
- Figure 22:
- STRAIGHT FERTILIZER CONSUMPTION VALUE BY NUTRIENT IN %, ASIA-PACIFIC, 2017 VS 2023 VS 2030
- Figure 23:
- MICRONUTRIENTS FERTILIZER CONSUMPTION BY PRODUCT IN METRIC TON, ASIA-PACIFIC, 2017 - 2030
- Figure 24:
- MICRONUTRIENTS FERTILIZER CONSUMPTION BY PRODUCT IN USD, ASIA-PACIFIC, 2017 - 2030
- Figure 25:
- MICRONUTRIENTS FERTILIZER CONSUMPTION VOLUME BY PRODUCT IN %, ASIA-PACIFIC, 2017 VS 2023 VS 2030
- Figure 26:
- MICRONUTRIENTS FERTILIZER CONSUMPTION VALUE BY PRODUCT IN %, ASIA-PACIFIC, 2017 VS 2023 VS 2030
- Figure 27:
- BORON FERTILIZER CONSUMPTION IN METRIC TON, ASIA-PACIFIC, 2017 - 2030
- Figure 28:
- BORON FERTILIZER CONSUMPTION IN USD, ASIA-PACIFIC, 2017 - 2030
- Figure 29:
- BORON FERTILIZER CONSUMPTION VALUE BY CROP TYPE IN %, ASIA-PACIFIC, 2023 VS 2030
- Figure 30:
- COPPER FERTILIZER CONSUMPTION IN METRIC TON, ASIA-PACIFIC, 2017 - 2030
- Figure 31:
- COPPER FERTILIZER CONSUMPTION IN USD, ASIA-PACIFIC, 2017 - 2030
- Figure 32:
- COPPER FERTILIZER CONSUMPTION VALUE BY CROP TYPE IN %, ASIA-PACIFIC, 2023 VS 2030
- Figure 33:
- IRON FERTILIZER CONSUMPTION IN METRIC TON, ASIA-PACIFIC, 2017 - 2030
- Figure 34:
- IRON FERTILIZER CONSUMPTION IN USD, ASIA-PACIFIC, 2017 - 2030
- Figure 35:
- IRON FERTILIZER CONSUMPTION VALUE BY CROP TYPE IN %, ASIA-PACIFIC, 2023 VS 2030
- Figure 36:
- MANGANESE FERTILIZER CONSUMPTION IN METRIC TON, ASIA-PACIFIC, 2017 - 2030
- Figure 37:
- MANGANESE FERTILIZER CONSUMPTION IN USD, ASIA-PACIFIC, 2017 - 2030
- Figure 38:
- MANGANESE FERTILIZER CONSUMPTION VALUE BY CROP TYPE IN %, ASIA-PACIFIC, 2023 VS 2030
- Figure 39:
- MOLYBDENUM FERTILIZER CONSUMPTION IN METRIC TON, ASIA-PACIFIC, 2017 - 2030
- Figure 40:
- MOLYBDENUM FERTILIZER CONSUMPTION IN USD, ASIA-PACIFIC, 2017 - 2030
- Figure 41:
- MOLYBDENUM FERTILIZER CONSUMPTION VALUE BY CROP TYPE IN %, ASIA-PACIFIC, 2023 VS 2030
- Figure 42:
- ZINC FERTILIZER CONSUMPTION IN METRIC TON, ASIA-PACIFIC, 2017 - 2030
- Figure 43:
- ZINC FERTILIZER CONSUMPTION IN USD, ASIA-PACIFIC, 2017 - 2030
- Figure 44:
- ZINC FERTILIZER CONSUMPTION VALUE BY CROP TYPE IN %, ASIA-PACIFIC, 2023 VS 2030
- Figure 45:
- OTHERS FERTILIZER CONSUMPTION IN METRIC TON, ASIA-PACIFIC, 2017 - 2030
- Figure 46:
- OTHERS FERTILIZER CONSUMPTION IN USD, ASIA-PACIFIC, 2017 - 2030
- Figure 47:
- OTHERS FERTILIZER CONSUMPTION VALUE BY CROP TYPE IN %, ASIA-PACIFIC, 2023 VS 2030
- Figure 48:
- NITROGENOUS FERTILIZER CONSUMPTION BY PRODUCT IN METRIC TON, ASIA-PACIFIC, 2017 - 2030
- Figure 49:
- NITROGENOUS FERTILIZER CONSUMPTION BY PRODUCT IN USD, ASIA-PACIFIC, 2017 - 2030
- Figure 50:
- NITROGENOUS FERTILIZER CONSUMPTION VOLUME BY PRODUCT IN %, ASIA-PACIFIC, 2017 VS 2023 VS 2030
- Figure 51:
- NITROGENOUS FERTILIZER CONSUMPTION VALUE BY PRODUCT IN %, ASIA-PACIFIC, 2017 VS 2023 VS 2030
- Figure 52:
- AMMONIUM NITRATE FERTILIZER CONSUMPTION IN METRIC TON, ASIA-PACIFIC, 2017 - 2030
- Figure 53:
- AMMONIUM NITRATE FERTILIZER CONSUMPTION IN USD, ASIA-PACIFIC, 2017 - 2030
- Figure 54:
- AMMONIUM NITRATE FERTILIZER CONSUMPTION VALUE BY CROP TYPE IN %, ASIA-PACIFIC, 2023 VS 2030
- Figure 55:
- ANHYDROUS AMMONIA FERTILIZER CONSUMPTION IN METRIC TON, ASIA-PACIFIC, 2017 - 2030
- Figure 56:
- ANHYDROUS AMMONIA FERTILIZER CONSUMPTION IN USD, ASIA-PACIFIC, 2017 - 2030
- Figure 57:
- ANHYDROUS AMMONIA FERTILIZER CONSUMPTION VALUE BY CROP TYPE IN %, ASIA-PACIFIC, 2023 VS 2030
- Figure 58:
- UREA UREA FERTILIZER CONSUMPTION IN METRIC TON, ASIA-PACIFIC, 2017 - 2030
- Figure 59:
- UREA UREA FERTILIZER CONSUMPTION IN USD, ASIA-PACIFIC, 2017 - 2030
- Figure 60:
- UREA FERTILIZER CONSUMPTION VALUE BY CROP TYPE IN USD, ASIA-PACIFIC, 2017 - 2030
- Figure 61:
- OTHERS FERTILIZER CONSUMPTION IN METRIC TON, ASIA-PACIFIC, 2017 - 2030
- Figure 62:
- OTHERS FERTILIZER CONSUMPTION IN USD, ASIA-PACIFIC, 2017 - 2030
- Figure 63:
- OTHERS FERTILIZER CONSUMPTION VALUE BY CROP TYPE IN %, ASIA-PACIFIC, 2023 VS 2030
- Figure 64:
- PHOSPHATIC FERTILIZER CONSUMPTION BY PRODUCT IN METRIC TON, ASIA-PACIFIC, 2017 - 2030
- Figure 65:
- PHOSPHATIC FERTILIZER CONSUMPTION BY PRODUCT IN USD, ASIA-PACIFIC, 2017 - 2030
- Figure 66:
- PHOSPHATIC FERTILIZER CONSUMPTION VOLUME BY PRODUCT IN %, ASIA-PACIFIC, 2017 VS 2023 VS 2030
- Figure 67:
- PHOSPHATIC FERTILIZER CONSUMPTION VALUE BY PRODUCT IN %, ASIA-PACIFIC, 2017 VS 2023 VS 2030
- Figure 68:
- DAP FERTILIZER CONSUMPTION IN METRIC TON, ASIA-PACIFIC, 2017 - 2030
- Figure 69:
- DAP FERTILIZER CONSUMPTION IN USD, ASIA-PACIFIC, 2017 - 2030
- Figure 70:
- DAP FERTILIZER CONSUMPTION VALUE BY CROP TYPE IN %, ASIA-PACIFIC, 2023 VS 2030
- Figure 71:
- MAP FERTILIZER CONSUMPTION IN METRIC TON, ASIA-PACIFIC, 2017 - 2030
- Figure 72:
- MAP FERTILIZER CONSUMPTION IN USD, ASIA-PACIFIC, 2017 - 2030
- Figure 73:
- MAP FERTILIZER CONSUMPTION VALUE BY CROP TYPE IN %, ASIA-PACIFIC, 2023 VS 2030
- Figure 74:
- SSP FERTILIZER CONSUMPTION IN METRIC TON, ASIA-PACIFIC, 2017 - 2030
- Figure 75:
- SSP FERTILIZER CONSUMPTION IN USD, ASIA-PACIFIC, 2017 - 2030
- Figure 76:
- SSP FERTILIZER CONSUMPTION VALUE BY CROP TYPE IN %, ASIA-PACIFIC, 2023 VS 2030
- Figure 77:
- TSP FERTILIZER CONSUMPTION IN METRIC TON, ASIA-PACIFIC, 2017 - 2030
- Figure 78:
- TSP FERTILIZER CONSUMPTION IN USD, ASIA-PACIFIC, 2017 - 2030
- Figure 79:
- TSP FERTILIZER CONSUMPTION VALUE BY CROP TYPE IN %, ASIA-PACIFIC, 2023 VS 2030
- Figure 80:
- OTHERS FERTILIZER CONSUMPTION IN METRIC TON, ASIA-PACIFIC, 2017 - 2030
- Figure 81:
- OTHERS FERTILIZER CONSUMPTION IN USD, ASIA-PACIFIC, 2017 - 2030
- Figure 82:
- OTHERS FERTILIZER CONSUMPTION VALUE BY CROP TYPE IN %, ASIA-PACIFIC, 2023 VS 2030
- Figure 83:
- POTASSIC FERTILIZER CONSUMPTION BY PRODUCT IN METRIC TON, ASIA-PACIFIC, 2017 - 2030
- Figure 84:
- POTASSIC FERTILIZER CONSUMPTION BY PRODUCT IN USD, ASIA-PACIFIC, 2017 - 2030
- Figure 85:
- POTASSIC FERTILIZER CONSUMPTION VOLUME BY PRODUCT IN %, ASIA-PACIFIC, 2017 VS 2023 VS 2030
- Figure 86:
- POTASSIC FERTILIZER CONSUMPTION VALUE BY PRODUCT IN %, ASIA-PACIFIC, 2017 VS 2023 VS 2030
- Figure 87:
- MOP FERTILIZER CONSUMPTION IN METRIC TON, ASIA-PACIFIC, 2017 - 2030
- Figure 88:
- MOP FERTILIZER CONSUMPTION IN USD, ASIA-PACIFIC, 2017 - 2030
- Figure 89:
- MOP FERTILIZER CONSUMPTION VALUE BY CROP TYPE IN %, ASIA-PACIFIC, 2023 VS 2030
- Figure 90:
- SOP FERTILIZER CONSUMPTION IN METRIC TON, ASIA-PACIFIC, 2017 - 2030
- Figure 91:
- SOP FERTILIZER CONSUMPTION IN USD, ASIA-PACIFIC, 2017 - 2030
- Figure 92:
- SOP FERTILIZER CONSUMPTION VALUE BY CROP TYPE IN %, ASIA-PACIFIC, 2023 VS 2030
- Figure 93:
- OTHERS FERTILIZER CONSUMPTION IN METRIC TON, ASIA-PACIFIC, 2017 - 2030
- Figure 94:
- OTHERS FERTILIZER CONSUMPTION IN USD, ASIA-PACIFIC, 2017 - 2030
- Figure 95:
- OTHERS FERTILIZER CONSUMPTION VALUE BY CROP TYPE IN %, ASIA-PACIFIC, 2023 VS 2030
- Figure 96:
- SECONDARY MACRONUTRIENTS FERTILIZER CONSUMPTION BY PRODUCT IN METRIC TON, ASIA-PACIFIC, 2017 - 2030
- Figure 97:
- SECONDARY MACRONUTRIENTS FERTILIZER CONSUMPTION BY PRODUCT IN USD, ASIA-PACIFIC, 2017 - 2030
- Figure 98:
- SECONDARY MACRONUTRIENTS FERTILIZER CONSUMPTION VOLUME BY PRODUCT IN %, ASIA-PACIFIC, 2017 VS 2023 VS 2030
- Figure 99:
- SECONDARY MACRONUTRIENTS FERTILIZER CONSUMPTION VALUE BY PRODUCT IN %, ASIA-PACIFIC, 2017 VS 2023 VS 2030
- Figure 100:
- CALCIUM FERTILIZER CONSUMPTION IN METRIC TON, ASIA-PACIFIC, 2017 - 2030
- Figure 101:
- CALCIUM FERTILIZER CONSUMPTION IN USD, ASIA-PACIFIC, 2017 - 2030
- Figure 102:
- CALCIUM FERTILIZER CONSUMPTION VALUE BY CROP TYPE IN %, ASIA-PACIFIC, 2023 VS 2030
- Figure 103:
- MAGNESIUM FERTILIZER CONSUMPTION IN METRIC TON, ASIA-PACIFIC, 2017 - 2030
- Figure 104:
- MAGNESIUM FERTILIZER CONSUMPTION IN USD, ASIA-PACIFIC, 2017 - 2030
- Figure 105:
- MAGNESIUM FERTILIZER CONSUMPTION VALUE BY CROP TYPE IN %, ASIA-PACIFIC, 2023 VS 2030
- Figure 106:
- SULFUR FERTILIZER CONSUMPTION IN METRIC TON, ASIA-PACIFIC, 2017 - 2030
- Figure 107:
- SULFUR FERTILIZER CONSUMPTION IN USD, ASIA-PACIFIC, 2017 - 2030
- Figure 108:
- SULFUR FERTILIZER CONSUMPTION VALUE BY CROP TYPE IN %, ASIA-PACIFIC, 2023 VS 2030
- Figure 109:
- FERTILIZER CONSUMPTION BY FORM IN METRIC TON, ASIA-PACIFIC, 2017 - 2030
- Figure 110:
- FERTILIZER CONSUMPTION BY FORM IN USD, ASIA-PACIFIC, 2017 - 2030
- Figure 111:
- FERTILIZER CONSUMPTION VOLUME BY FORM IN %, ASIA-PACIFIC, 2017 VS 2023 VS 2030
- Figure 112:
- FERTILIZER CONSUMPTION VALUE BY FORM IN %, ASIA-PACIFIC, 2017 VS 2023 VS 2030
- Figure 113:
- CONVENTIONAL FERTILIZER CONSUMPTION IN METRIC TON, ASIA-PACIFIC, 2017 - 2030
- Figure 114:
- CONVENTIONAL FERTILIZER CONSUMPTION IN USD, ASIA-PACIFIC, 2017 - 2030
- Figure 115:
- CONVENTIONAL FERTILIZER CONSUMPTION VALUE BY CROP TYPE IN %, ASIA-PACIFIC, 2023 VS 2030
- Figure 116:
- FERTILIZER CONSUMPTION BY SPECIALITY TYPE IN METRIC TON, ASIA-PACIFIC, 2017 - 2030
- Figure 117:
- FERTILIZER CONSUMPTION BY SPECIALITY TYPE IN USD, ASIA-PACIFIC, 2017 - 2030
- Figure 118:
- FERTILIZER CONSUMPTION VOLUME BY SPECIALITY TYPE IN %, ASIA-PACIFIC, 2017 VS 2023 VS 2030
- Figure 119:
- FERTILIZER CONSUMPTION VALUE BY SPECIALITY TYPE IN %, ASIA-PACIFIC, 2017 VS 2023 VS 2030
- Figure 120:
- CRF FERTILIZER CONSUMPTION IN METRIC TON, ASIA-PACIFIC, 2017 - 2030
- Figure 121:
- CRF FERTILIZER CONSUMPTION IN USD, ASIA-PACIFIC, 2017 - 2030
- Figure 122:
- CRF FERTILIZER CONSUMPTION VALUE BY CROP TYPE IN %, ASIA-PACIFIC, 2023 VS 2030
- Figure 123:
- LIQUID FERTILIZER CONSUMPTION IN METRIC TON, ASIA-PACIFIC, 2017 - 2030
- Figure 124:
- LIQUID FERTILIZER CONSUMPTION IN USD, ASIA-PACIFIC, 2017 - 2030
- Figure 125:
- LIQUID FERTILIZER CONSUMPTION VALUE BY CROP TYPE IN %, ASIA-PACIFIC, 2023 VS 2030
- Figure 126:
- SRF FERTILIZER CONSUMPTION IN METRIC TON, ASIA-PACIFIC, 2017 - 2030
- Figure 127:
- SRF FERTILIZER CONSUMPTION IN USD, ASIA-PACIFIC, 2017 - 2030
- Figure 128:
- SRF FERTILIZER CONSUMPTION VALUE BY CROP TYPE IN %, ASIA-PACIFIC, 2023 VS 2030
- Figure 129:
- WATER SOLUBLE FERTILIZER CONSUMPTION IN METRIC TON, ASIA-PACIFIC, 2017 - 2030
- Figure 130:
- WATER SOLUBLE FERTILIZER CONSUMPTION IN USD, ASIA-PACIFIC, 2017 - 2030
- Figure 131:
- WATER SOLUBLE FERTILIZER CONSUMPTION VALUE BY CROP TYPE IN %, ASIA-PACIFIC, 2023 VS 2030
- Figure 132:
- FERTILIZER CONSUMPTION BY APPLICATION MODE IN METRIC TON, ASIA-PACIFIC, 2017 - 2030
- Figure 133:
- FERTILIZER CONSUMPTION BY APPLICATION MODE IN USD, ASIA-PACIFIC, 2017 - 2030
- Figure 134:
- FERTILIZER CONSUMPTION VOLUME BY APPLICATION MODE IN %, ASIA-PACIFIC, 2017 VS 2023 VS 2030
- Figure 135:
- FERTILIZER CONSUMPTION VALUE BY APPLICATION MODE IN %, ASIA-PACIFIC, 2017 VS 2023 VS 2030
- Figure 136:
- FERTIGATION APPLICATION OF FERTILIZER IN METRIC TON, ASIA-PACIFIC, 2017 - 2030
- Figure 137:
- FERTIGATION APPLICATION OF FERTILIZER IN USD, ASIA-PACIFIC, 2017 - 2030
- Figure 138:
- FERTIGATION APPLICATION OF FERTILIZER IN VALUE BY CROP TYPE IN %, ASIA-PACIFIC, 2023 VS 2030
- Figure 139:
- FOLIAR APPLICATION OF FERTILIZER IN METRIC TON, ASIA-PACIFIC, 2017 - 2030
- Figure 140:
- FOLIAR APPLICATION OF FERTILIZER IN USD, ASIA-PACIFIC, 2017 - 2030
- Figure 141:
- FOLIAR APPLICATION OF FERTILIZER IN VALUE BY CROP TYPE IN %, ASIA-PACIFIC, 2023 VS 2030
- Figure 142:
- SOIL APPLICATION OF FERTILIZER IN METRIC TON, ASIA-PACIFIC, 2017 - 2030
- Figure 143:
- SOIL APPLICATION OF FERTILIZER IN USD, ASIA-PACIFIC, 2017 - 2030
- Figure 144:
- SOIL APPLICATION OF FERTILIZER IN VALUE BY CROP TYPE IN %, ASIA-PACIFIC, 2023 VS 2030
- Figure 145:
- FERTILIZER CONSUMPTION BY CROP TYPE IN METRIC TON, ASIA-PACIFIC, 2017 - 2030
- Figure 146:
- FERTILIZER CONSUMPTION BY CROP TYPE IN USD, ASIA-PACIFIC, 2017 - 2030
- Figure 147:
- FERTILIZER CONSUMPTION VOLUME BY CROP TYPE IN %, ASIA-PACIFIC, 2017 VS 2023 VS 2030
- Figure 148:
- FERTILIZER CONSUMPTION VALUE BY CROP TYPE IN %, ASIA-PACIFIC, 2017 VS 2023 VS 2030
- Figure 149:
- FERTILIZER CONSUMPTION BY FIELD CROPS IN METRIC TON, ASIA-PACIFIC, 2017 - 2030
- Figure 150:
- FERTILIZER CONSUMPTION BY FIELD CROPS IN USD, ASIA-PACIFIC, 2017 - 2030
- Figure 151:
- FERTILIZER CONSUMPTION VALUE BY TYPE IN %, ASIA-PACIFIC, 2023 VS 2030
- Figure 152:
- FERTILIZER CONSUMPTION BY HORTICULTURAL CROPS IN METRIC TON, ASIA-PACIFIC, 2017 - 2030
- Figure 153:
- FERTILIZER CONSUMPTION BY HORTICULTURAL CROPS IN USD, ASIA-PACIFIC, 2017 - 2030
- Figure 154:
- FERTILIZER CONSUMPTION VALUE BY TYPE IN %, ASIA-PACIFIC, 2023 VS 2030
- Figure 155:
- FERTILIZER CONSUMPTION BY TURF & ORNAMENTAL IN METRIC TON, ASIA-PACIFIC, 2017 - 2030
- Figure 156:
- FERTILIZER CONSUMPTION BY TURF & ORNAMENTAL IN USD, ASIA-PACIFIC, 2017 - 2030
- Figure 157:
- FERTILIZER CONSUMPTION VALUE BY TYPE IN %, ASIA-PACIFIC, 2023 VS 2030
- Figure 158:
- FERTILIZER CONSUMPTION BY COUNTRY IN METRIC TON, ASIA-PACIFIC, 2017 - 2030
- Figure 159:
- FERTILIZER CONSUMPTION BY COUNTRY IN USD, ASIA-PACIFIC, 2017 - 2030
- Figure 160:
- FERTILIZER CONSUMPTION VOLUME BY COUNTRY IN %, ASIA-PACIFIC, 2017 VS 2023 VS 2030
- Figure 161:
- FERTILIZER CONSUMPTION VALUE BY COUNTRY IN %, ASIA-PACIFIC, 2017 VS 2023 VS 2030
- Figure 162:
- FERTILIZER CONSUMPTION IN METRIC TON, AUSTRALIA, 2017 - 2030
- Figure 163:
- FERTILIZER CONSUMPTION IN USD, AUSTRALIA, 2017 - 2030
- Figure 164:
- FERTILIZER CONSUMPTION VALUE BY CROP TYPE IN %, AUSTRALIA, 2023 VS 2030
- Figure 165:
- FERTILIZER CONSUMPTION IN METRIC TON, BANGLADESH, 2017 - 2030
- Figure 166:
- FERTILIZER CONSUMPTION IN USD, BANGLADESH, 2017 - 2030
- Figure 167:
- FERTILIZER CONSUMPTION VALUE BY CROP TYPE IN %, BANGLADESH, 2023 VS 2030
- Figure 168:
- FERTILIZER CONSUMPTION IN METRIC TON, CHINA, 2017 - 2030
- Figure 169:
- FERTILIZER CONSUMPTION IN USD, CHINA, 2017 - 2030
- Figure 170:
- FERTILIZER CONSUMPTION VALUE BY CROP TYPE IN %, CHINA, 2023 VS 2030
- Figure 171:
- FERTILIZER CONSUMPTION IN METRIC TON, INDIA, 2017 - 2030
- Figure 172:
- FERTILIZER CONSUMPTION IN USD, INDIA, 2017 - 2030
- Figure 173:
- FERTILIZER CONSUMPTION VALUE BY CROP TYPE IN %, INDIA, 2023 VS 2030
- Figure 174:
- FERTILIZER CONSUMPTION IN METRIC TON, INDONESIA, 2017 - 2030
- Figure 175:
- FERTILIZER CONSUMPTION IN USD, INDONESIA, 2017 - 2030
- Figure 176:
- FERTILIZER CONSUMPTION VALUE BY CROP TYPE IN %, INDONESIA, 2023 VS 2030
- Figure 177:
- FERTILIZER CONSUMPTION IN METRIC TON, JAPAN, 2017 - 2030
- Figure 178:
- FERTILIZER CONSUMPTION IN USD, JAPAN, 2017 - 2030
- Figure 179:
- FERTILIZER CONSUMPTION VALUE BY CROP TYPE IN %, JAPAN, 2023 VS 2030
- Figure 180:
- FERTILIZER CONSUMPTION IN METRIC TON, PAKISTAN, 2017 - 2030
- Figure 181:
- FERTILIZER CONSUMPTION IN USD, PAKISTAN, 2017 - 2030
- Figure 182:
- FERTILIZER CONSUMPTION VALUE BY CROP TYPE IN %, PAKISTAN, 2023 VS 2030
- Figure 183:
- FERTILIZER CONSUMPTION IN METRIC TON, PHILIPPINES, 2017 - 2030
- Figure 184:
- FERTILIZER CONSUMPTION IN USD, PHILIPPINES, 2017 - 2030
- Figure 185:
- FERTILIZER CONSUMPTION VALUE BY CROP TYPE IN %, PHILIPPINES, 2023 VS 2030
- Figure 186:
- FERTILIZER CONSUMPTION IN METRIC TON, THAILAND, 2017 - 2030
- Figure 187:
- FERTILIZER CONSUMPTION IN USD, THAILAND, 2017 - 2030
- Figure 188:
- FERTILIZER CONSUMPTION VALUE BY CROP TYPE IN %, THAILAND, 2023 VS 2030
- Figure 189:
- FERTILIZER CONSUMPTION IN METRIC TON, VIETNAM, 2017 - 2030
- Figure 190:
- FERTILIZER CONSUMPTION IN USD, VIETNAM, 2017 - 2030
- Figure 191:
- FERTILIZER CONSUMPTION VALUE BY CROP TYPE IN %, VIETNAM, 2023 VS 2030
- Figure 192:
- FERTILIZER CONSUMPTION IN METRIC TON, REST OF ASIA-PACIFIC, 2017 - 2030
- Figure 193:
- FERTILIZER CONSUMPTION IN USD, REST OF ASIA-PACIFIC, 2017 - 2030
- Figure 194:
- FERTILIZER CONSUMPTION VALUE BY CROP TYPE IN %, REST OF ASIA-PACIFIC, 2023 VS 2030
- Figure 195:
- MOST ACTIVE COMPANIES BY NUMBER OF STRATEGIC MOVES, ASIA-PACIFIC, 2017 - 2030
- Figure 196:
- ASIA-PACIFIC FERTILIZERS MARKET, MOST ADOPTED STRATEGIES, 2018 - 2021
- Figure 197:
- MARKET SHARE OF MAJOR PLAYERS IN %, ASIA-PACIFIC
Asia-Pacific Fertilizers Industry Segmentation
Complex, Straight are covered as segments by Type. Conventional, Speciality are covered as segments by Form. Fertigation, Foliar, Soil are covered as segments by Application Mode. Field Crops, Horticultural Crops, Turf & Ornamental are covered as segments by Crop Type. Australia, Bangladesh, China, India, Indonesia, Japan, Pakistan, Philippines, Thailand, Vietnam are covered as segments by Country.| Type | Complex | |||
| Straight | Micronutrients | Boron | ||
| Copper | ||||
| Iron | ||||
| Manganese | ||||
| Molybdenum | ||||
| Zinc | ||||
| Others | ||||
| Nitrogenous | Ammonium Nitrate | |||
| Anhydrous Ammonia | ||||
| Urea | ||||
| Others | ||||
| Phosphatic | DAP | |||
| MAP | ||||
| SSP | ||||
| TSP | ||||
| Others | ||||
| Potassic | MoP | |||
| SoP | ||||
| Others | ||||
| Secondary Macronutrients | Calcium | |||
| Magnesium | ||||
| Sulfur | ||||
| Form | Conventional | |||
| Speciality | CRF | |||
| Liquid Fertilizer | ||||
| SRF | ||||
| Water Soluble | ||||
| Application Mode | Fertigation | |||
| Foliar | ||||
| Soil | ||||
| Crop Type | Field Crops | |||
| Horticultural Crops | ||||
| Turf & Ornamental | ||||
| Country | Australia | |||
| Bangladesh | ||||
| China | ||||
| India | ||||
| Indonesia | ||||
| Japan | ||||
| Pakistan | ||||
| Philippines | ||||
| Thailand | ||||
| Vietnam | ||||
| Rest of Asia-Pacific | ||||
Type
| Complex | |||
| Straight | Micronutrients | Boron | |
| Copper | |||
| Iron | |||
| Manganese | |||
| Molybdenum | |||
| Zinc | |||
| Others | |||
| Nitrogenous | Ammonium Nitrate | ||
| Anhydrous Ammonia | |||
| Urea | |||
| Others | |||
| Phosphatic | DAP | ||
| MAP | |||
| SSP | |||
| TSP | |||
| Others | |||
| Potassic | MoP | ||
| SoP | |||
| Others | |||
| Secondary Macronutrients | Calcium | ||
| Magnesium | |||
| Sulfur | |||
Form
| Conventional | |
| Speciality | CRF |
| Liquid Fertilizer | |
| SRF | |
| Water Soluble |
Application Mode
| Fertigation |
| Foliar |
| Soil |
Crop Type
| Field Crops |
| Horticultural Crops |
| Turf & Ornamental |
Country
| Australia |
| Bangladesh |
| China |
| India |
| Indonesia |
| Japan |
| Pakistan |
| Philippines |
| Thailand |
| Vietnam |
| Rest of Asia-Pacific |
Need A Different Region or Segment?
Customize Now
Market Definition
- MARKET ESTIMATION LEVEL - Market Estimations for various types of fertilizers has been done at the product-level and not at the nutrient-level.
- NUTRIENT TYPES COVERED - Primary Nutrients: N, P and K, Secondary Macronutrients: Ca, Mg and S, Micronutients: Zn, Mn, Cu, Fe, Mo, B, and Others
- AVERAGE NUTRIENT APPLICATION RATE - This refers to the average volume of nutrient consumed per hectare of farmland in each country.
- CROP TYPES COVERED - Field Crops: Cereals, Pulses, Oilseeds, and Fiber Crops Horticulture: Fruits, Vegetables, Plantation Crops and Spices, Turf Grass and Ornamentals
| Keyword | Definition |
|---|---|
| Fertilizer | Chemical substance applied to crops to ensure nutritional requirements, available in various forms such as granules, powders, liquid, water soluble, etc. |
| Specialty Fertilizer | Used for enhanced efficiency and nutrient availability applied through soil, foliar, and fertigation. Includes CRF, SRF, liquid fertilizer, and water soluble fertilizers. |
| Controlled-Release Fertilizers (CRF) | Coated with materials such as polymer, polymer-sulfur, and other materials such as resins to ensure nutrient availability to the crop for its entire life cycle. |
| Slow-Release Fertilizers (SRF) | Coated with materials such as sulfur, neem, etc., to ensure nutrient availability to the crop for a longer period. |
| Foliar Fertilizers | Consist of both liquid and water soluble fertilizers applied through foliar application. |
| Water-Soluble Fertilizers | Available in various forms including liquid, powder, etc., used in foliar and fertigation mode of fertilizer application. |
| Fertigation | Fertilizers applied through different irrigation systems such as drip irrigation, micro irrigation, sprinkler irrigation, etc. |
| Anhydrous Ammonia | Used as fertilizer, directly injected into the soil, available in gaseous liquid form. |
| Single Super Phosphate (SSP) | Phosphorus fertilizer containing only phosphorus which has lesser than or equal to 35%. |
| Triple Super Phosphate (TSP) | Phosphorus fertilizer containing only phosphorus greater than 35%. |
| Enhanced Efficiency Fertilizers | Fertilizers coated or treated with additional layers of various ingredients to make it more efficient compared to other fertilizers. |
| Conventional Fertilizer | Fertilizers applied to crops through traditional methods including broadcasting, row placement, ploughing soil placement, etc. |
| Chelated Micronutrients | Micronutrient fertilizers coated with chelating agents such as EDTA, EDDHA, DTPA, HEDTA, etc. |
| Liquid Fertilizers | Available in liquid form, majorly used for application of fertilizers to crops through foliar and fertigation. |
Need More Details on Market Definition?
Ask a Question
Research Methodology
Mordor Intelligence follows a four-step methodology in all our reports.
- Step-1: IDENTIFY KEY VARIABLES: In order to build a robust forecasting methodology, the variables and factors identified in Step-1 are tested against available historical market numbers. Through an iterative process, the variables required for market forecast are set and the model is built on the basis of these variables.
- Step-2: Build a Market Model: Market-size estimations for the forecast years are in nominal terms. Inflation is not a part of the pricing, and the average selling price (ASP) is kept constant throughout the forecast period for each country.
- Step-3: Validate and Finalize: In this important step, all market numbers, variables and analyst calls are validated through an extensive network of primary research experts from the market studied. The respondents are selected across levels and functions to generate a holistic picture of the market studied.
- Step-4: Research Outputs: Syndicated Reports, Custom Consulting Assignments, Databases & Subscription Platforms

Get More Details On Research Methodology
Download PDF


