
India Plastic Industry Size and Share
India Plastic Industry Analysis by Mordor Intelligence
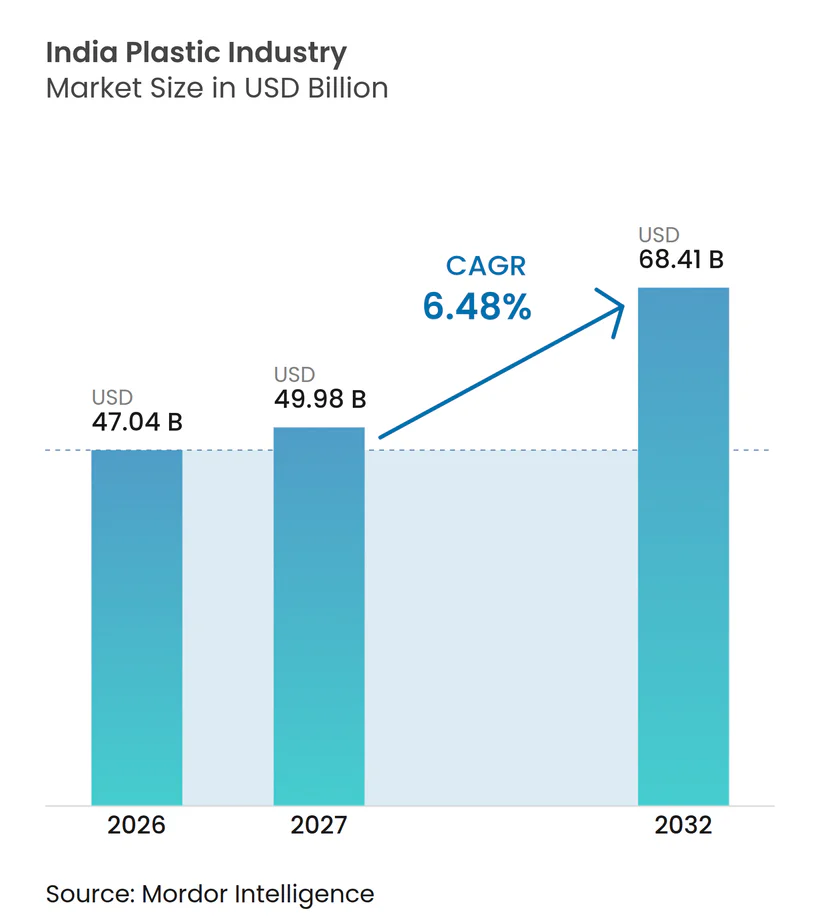
The India plastic industry market size is expected to increase from USD 47.04 billion in 2026 to USD 49.98 billion in 2027 and reach USD 68.41 billion by 2032, growing at a CAGR of 6.48% over 2027-2032.
In India, electric two-wheeler adoption widens the outlet for molded polymer components as packaging activity sustains large-scale resin conversion. Producers that integrate cracker and polymer capacity can secure feedstock more reliably, while recycled-material capabilities open a separate route to compliance-driven converter demand. Packaging duties make legally permitted recycled content commercially important, while feedstock volatility can constrain producer margins. Suppliers able to qualify recycled grades for permitted packaging uses while absorbing naphtha swings have a stronger proposition for converters balancing compliance and resin cost.
Key Report Takeaways
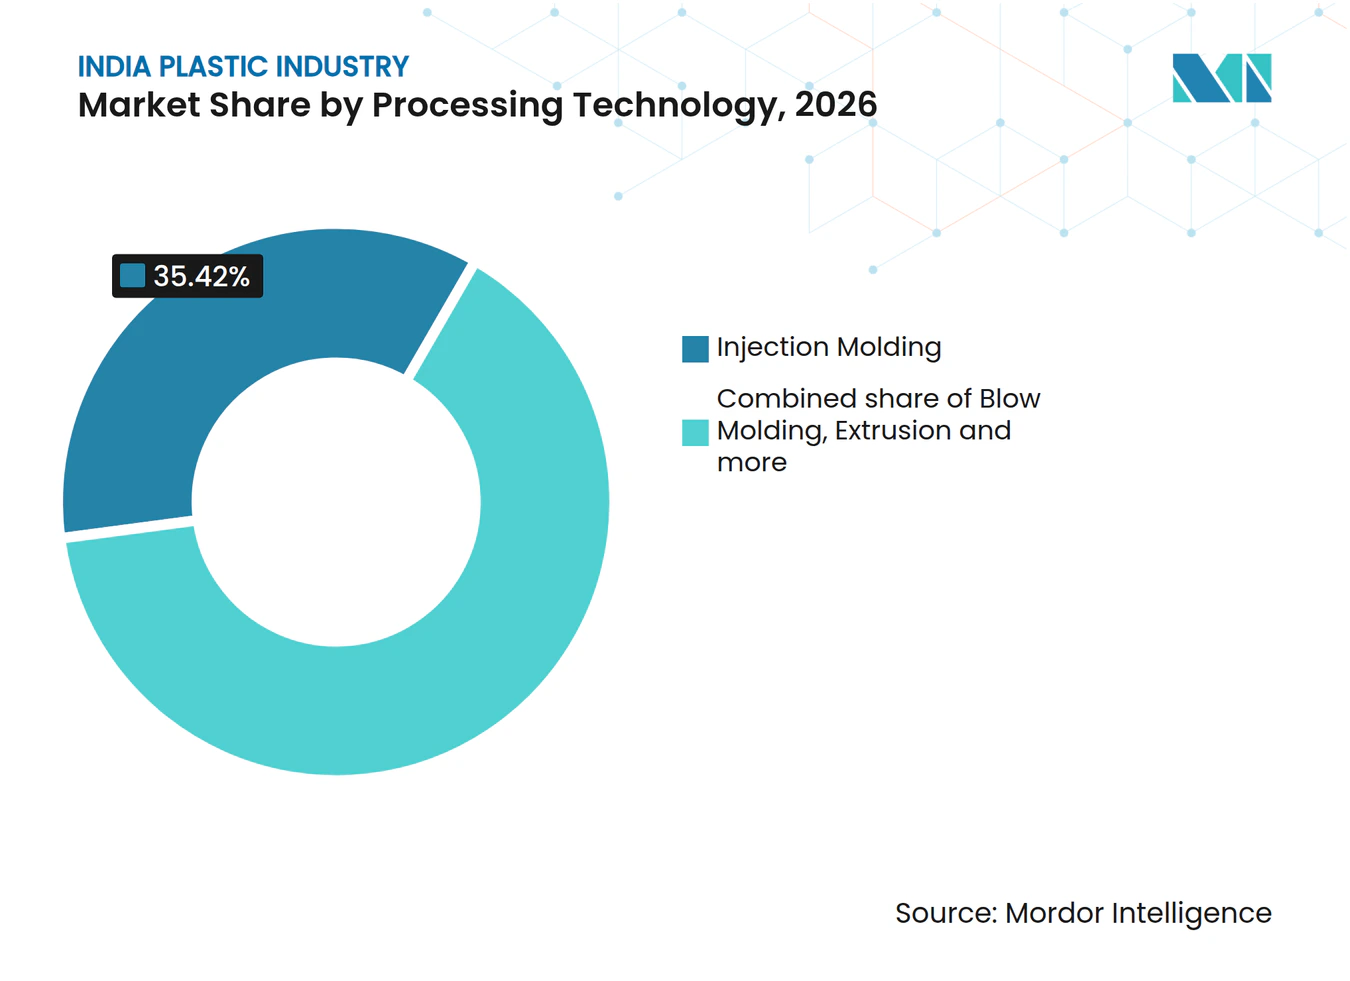
- By polymer type, polyethylene (LDPE, LLDPE and HDPE) led with a 33.64% India plastic industry market share in 2026, while other polymers, including PMMA and POM, are forecast to grow fastest at a CAGR of 6.9% over 2027-2032.
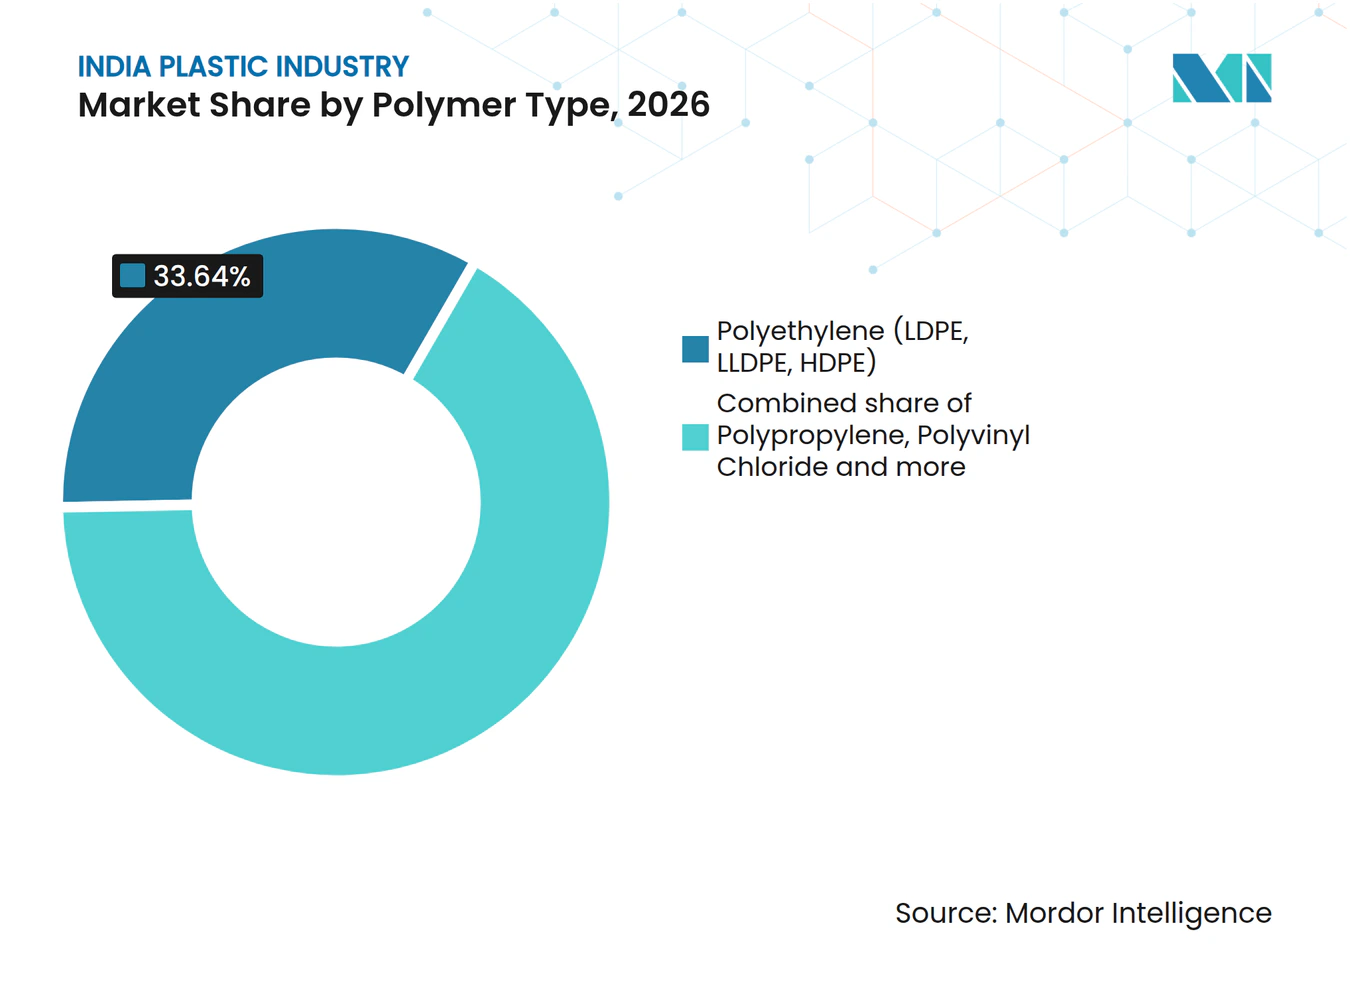
- Within specialty and bioplastics, biodegradable bioplastics (PLA, PHA and starch blends) held 57.88% of the specialty and bioplastics pool in 2026, whereas bio-based non-biodegradable plastics (bio-PE and bio-PET) are forecast to lead growth with a CAGR of 7.55% over 2027-2032.
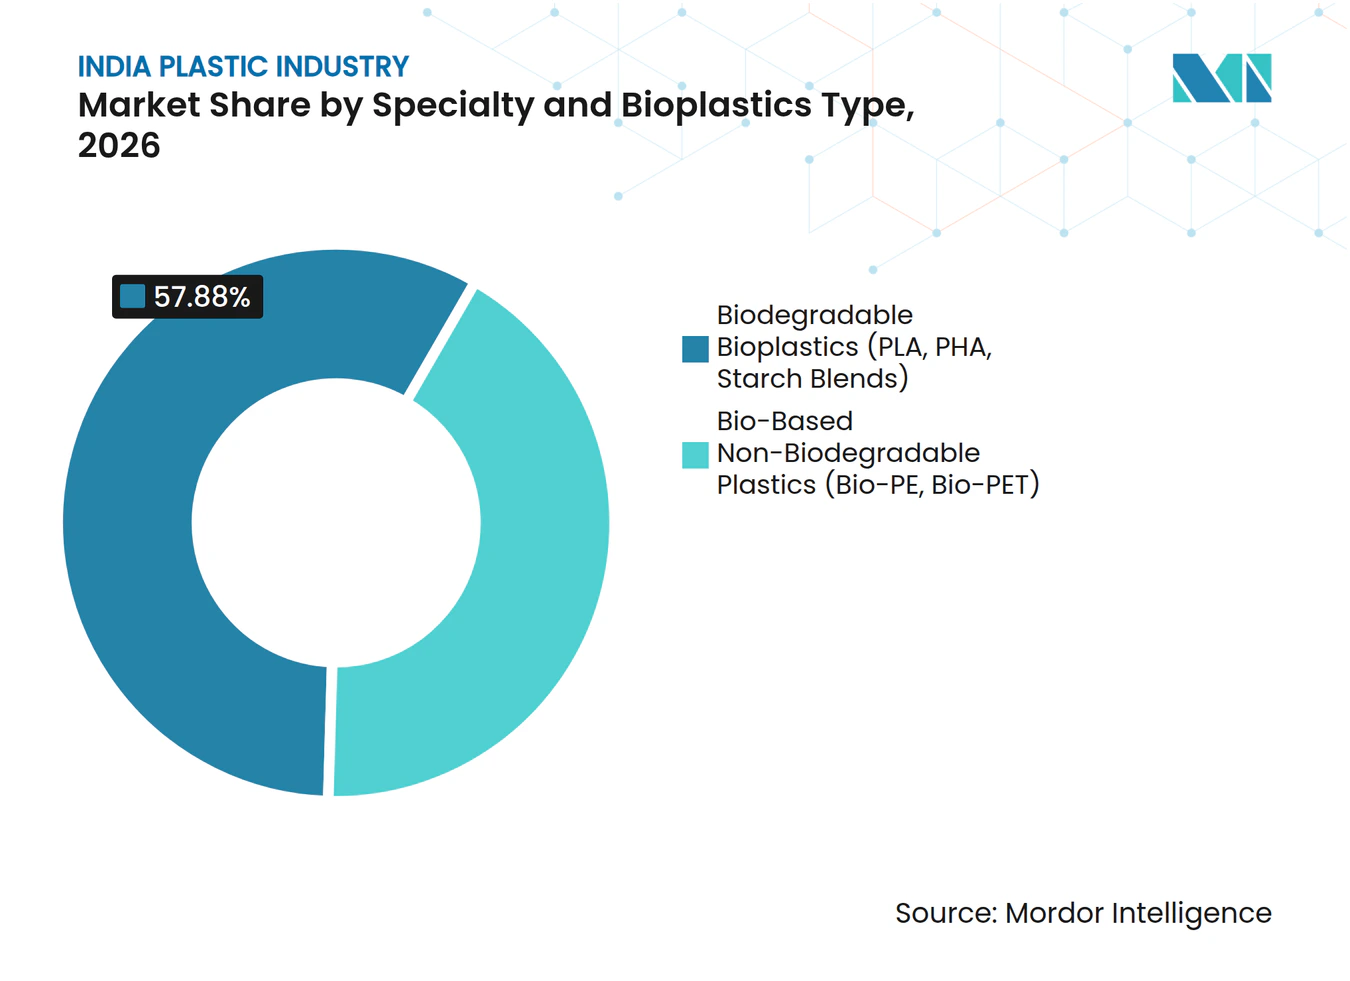
- Processing technology was led by injection molding with a 35.42% market share in 2026, with blow molding forecast to be the fastest-growing segment at a CAGR of 6.9% over 2027-2032.
- Among applications, packaging held a 41.68% share of the India plastic industry market size in 2026, while the healthcare and pharmaceuticals segment is forecast to grow fastest at a CAGR of 6.95% over 2027-2032.
- Across India's regions, West India led with a 46.71% market share in 2026, and South India is forecast to grow fastest at a CAGR of 7.2% over 2027-2032.
Note: Market numbers in this report are based on Mordor Intelligence's proprietary estimation framework, which combines nine months of actuals with Q4 projections for base year 2026.
Market Trends and Insights
Drivers Impact Analysis of India Plastic Industry*
| Driver | (~) % Impact on CAGR Forecast | Geographic Relevance | Impact Timeline |
|---|---|---|---|
| Government PLI Scheme Accelerating Polymer Capacity Expansions in Gujarat | +1.7% | Vilayat polymer manufacturing site | Medium term (2-4 years) |
| Quick-Commerce Boom Driving Demand for High-Rigidity Food Containers | +2.2% | Nationwide | Short term (≤ 2 years) |
| Swachh Bharat Phase-II Fueling Urban HDPE Pipe Replacement | +1.5% | Nationwide | Medium term (2-4 years) |
| EV Lightweighting Strategy Boosting Engineering Plastics in Two-Wheelers | +1.3% | Nationwide | Medium term (2-4 years) |
| Pharma Export Surge in West India Raising Medical-Grade Resin Consumption | +1.1% | Maharashtra pharmaceutical export districts | Short term (≤ 2 years) |
| Tier-II Mall Construction Upsurge Increasing PVC Profiles and Cladding Demand | +0.9% | Nationwide | Long term (≥ 4 years) |
| Source: Mordor Intelligence | |||
Government PLI Scheme Accelerating Polymer Capacity Expansions in Gujarat
Domestic CPVC resin production can give converters another supply option as polymer manufacturing expands in Gujarat. On June 16, 2026, Grasim Industries Ltd and Lubrizol Advanced Materials inaugurated Phase 1 of a chlorinated polyvinyl chloride (CPVC) resin facility in Vilayat, Gujarat. The facility is located at Grasim's chlor-alkali complex. By August 11, 2026, Grasim had reported that commercial production had commenced, with planned annual capacity of approximately 50,000 metric tons. Converters' contracted volumes, not the plant's planned capacity of approximately 50,000 metric tons per year, will determine how much resin demand the expansion adds.
Quick-Commerce Boom Driving Demand for High-Rigidity Food Containers
Quick-commerce growth becomes a resin-demand driver in the India plastic market where food orders use rigid plastic containers that must be supplied repeatedly. The resin effect depends on both container numbers and the material requirement of the chosen design, making order growth only part of the calculation. For converters, a stable container specification can connect an expanding service channel with a recurring production requirement. High rigidity also makes resin performance part of the packaging proposition, linking material selection with the product's required shape and handling. For rigid-container converters, a design that meets the rigidity specification with less resin would weaken the link between rising food orders and resin tonnage.
Swachh Bharat Phase-II Fueling Urban HDPE Pipe Replacement
Urban pipe replacement creates an HDPE resin outlet where the network specification calls for HDPE pipe. Public funding supports that outlet when it becomes a defined scope of pipe work that converters can manufacture. Replacement projects would concentrate material demand around their construction schedules, making order timing relevant to resin producers. For municipal buyers and pipe makers, specifying the material and releasing executable work packages connects a sanitation objective with a production requirement. A change in pipe material would redirect this outlet entirely, whereas a construction delay would only defer it.
EV Lightweighting Strategy Boosting Engineering Plastics in Two-Wheelers
Electric two-wheeler adoption broadens the potential outlet for polymer components in the India plastic market, even without an increase in plastic content per vehicle. Retail registrations reached 1,401,818 in FY2025-26, up 21.81% from FY2024-25. The data covers 1,463 of 1,466 registration offices and excludes Telangana. Bright Brothers Limited supplies customized polymer components to electric two-wheeler manufacturers. Its broader automotive injection-molded solutions emphasize lightweighting, linking polymer processing capability with vehicle design requirements. Winning a specified component can give a molder exposure to vehicle-volume growth, whereas lowering that component's mass can limit resin tonnage per vehicle.
Restraints Impact Analysis of India Plastic Industry*
| Restraint | (~) % Impact on CAGR Forecast | Geographic Relevance | Impact Timeline |
|---|---|---|---|
| Single-Use Plastic Ban Escalating Compliance Costs for FMCG Packagers | -0.9% | Nationwide | Short term (≤ 2 years) |
| Volatile Naphtha Feedstock Prices from Middle-East Tensions | -0.8% | Nationwide | Short term (≤ 2 years) |
| Inter-State Waste Rules Causing Logistic Bottlenecks and Capacity Under-Utilization | -0.3% | Nationwide | Medium term (2-4 years) |
| Consumer Backlash on Microplastics in Packaged Drinking Water | -0.2% | Nationwide | Long term (≥ 4 years) |
| Source: Mordor Intelligence | |||
Single-Use Plastic Ban Escalating Compliance Costs for FMCG Packagers
FMCG packaging demand for the plastic industry in India faces both restrictions on particular formats and the expense of adapting permitted packaging. India prohibits manufacture, import, stocking, distribution, sale and use of specified single-use plastic films around sweet boxes, invitation cards and cigarette packets from July 1, 2022. These restrictions remove those particular outlets for conventional film resin, making substitution necessary for affected packagers. In FY2025-26, Dabur India Ltd identified additional obligations covering packaging design, sourcing and waste management.[1] Its risk review linked delayed adaptation or noncompliance to potential penalties, operational disruptions and reputational impact. For converters serving affected FMCG formats, the commercial constraint therefore extends beyond material replacement to the time and expense needed to make a compliant package available.
Volatile Naphtha Feedstock Prices from Middle-East Tensions
Feedstock volatility constrains polymer producers when higher input costs compress the margin available from each metric ton of resin. Haldia Petrochemicals Ltd reported that geopolitical events, including Middle East conflict, and economic uncertainty kept crude oil and naphtha prices highly volatile in FY2024-25. Its average polymer-naphtha spread narrowed from USD 374 per metric ton in FY2023-24 to USD 349 per metric ton in FY2024-25.[2] The company attributed that compression to higher naphtha costs while polymer prices remained almost unchanged. The USD 25 per metric ton reduction shows the pressure landing on Haldia's production economics, not on resin buyers. A narrower spread leaves less margin to fund capacity or grade development, even when resin selling prices hold steady.
*Our forecasts treat driver/restraint impacts as directional, not additive. The impact forecasts reflect baseline growth, mix effects, and variable interactions.
India Plastic Industry Segment Analysis
By Polymer Type:
Polyethylene Scale Meets Specialty Supply OpeningsPolyethylene (LDPE, LLDPE and HDPE) accounted for a 33.64% share of the India plastic industry market size in 2026, making it the largest segment. Reliance Polymers offers the entire Relene polyethylene range, covering low-density polyethylene (LDPE), linear low-density polyethylene (LLDPE) and high-density polyethylene (HDPE). For converters using these resins, the portfolio offers several polyethylene supply options through a single producer. This favors suppliers able to support more than one polyethylene requirement, concentrating competition on portfolio coverage as well as the quantity of resin produced.
Other polymers, including PMMA and POM, form the fastest-growing segment, with a forecast CAGR of 6.9% over 2027-2032. India was a net importer of polyacetal resin, or POM, in FY2024-25. That trade position creates an opening to serve import-supplied demand, giving specialty suppliers a commercial route beyond relying entirely on new applications. Polyvinyl chloride has a different outlet, with Plastindia Foundation estimating Indian pipes-and-fittings resin demand at 3.57 million metric tons in FY25, up 10.9% year over year. The distinction separates a supply-access opportunity in specialty resins from a high-volume pipe-and-fitting outlet for PVC.



By Specialty and Bioplastics Type:
Distinct Material Objectives Shape DemandBiodegradable bioplastics, including PLA, PHA and starch blends, held the largest share, 57.88% of the specialty and bioplastics pool, in 2026. By February 2026, Lucknow Cantonment Board had placed an institutional order with Balrampur Bioyug, Balrampur Chini Mills Limited's polylactic acid (PLA) venture. The order covered compostable garbage bags and PLA bottles, pens and folders. Institutional procurement can therefore organize demand around a defined set of compostable products, giving resin suppliers access to several formats through one buyer.
Bio-based non-biodegradable plastics, including bio-PE and bio-PET, are forecast to be the fastest-growing segment in the plastic industry in India, with a CAGR of 7.55% over 2027-2032. Braskem produces the I'm Green bio-based polyethylene resins. SKYi FKuR supplies them to India for injection and blow molding, including packaging applications. Because the supply spans both injection and blow molding, packaging converters on either process route can source bio-based polyethylene through SKYi FKuR.

By Processing Technology:
Molding Scale and Integrated Bottle ProductionInjection molding held the largest segment share at 35.42% in 2026. Plastindia Foundation estimated India's thin-wall injection-molding polymer demand at 130,000 metric tons in FY2024-25. Its annual processing-machinery series also counted 12,600 injection-molding machines in FY2024-25, compared with 5,330 extrusion machines.
Blow molding is the fastest-growing segment in the plastic industry in India, with a forecast CAGR of 6.9% over 2027-2032. India's processing-machinery series recorded 1,400 blow-molding machines in FY25, compared with 1,260 in FY24. By November 2025, KHS had installed an integrated stretch blow-molding, labeling and filling line for SLMG Beverages at Chhata. The line had capacity for up to 48,000 non-returnable polyethylene terephthalate (PET) bottles per hour in sizes from 250 milliliters to 2 liters. Such integrated additions tie potential resin demand to the throughput of complete bottling operations, so equipment coordination can matter alongside the number of molding machines.
By Application:
Packaging Scale and Pharmaceutical SpecializationPackaging represented a 41.68% India plastic industry market share in 2026, making it the largest application segment. Plastindia Foundation estimated India's packaging-film sector volume at 6.5 million metric tons in FY25. The same industry assessment identified cost pressure within a highly fragmented packaging-film value chain. Large conversion volumes therefore create a substantial resin outlet, but downstream cost pressure can limit how readily material costs are passed through.
The healthcare and pharmaceuticals category is forecast to be the fastest-growing segment, with a CAGR of 6.95% over 2027-2032. Mold-Tek Packaging Limited reported 208.96% volume growth in its Pharma Packs segment in FY2025-26. It also reported new orders from DifGen Pharmaceuticals Pvt Ltd, identified as a pharma-sector customer, during FY2025-26. Separately, it launched effervescent tubes with in-mold labeling in sizes of 85, 99, 120 and 144 millimeters during FY2025-26, describing the launch as a first in India. Specialist packaging can thus provide a resin outlet through both format development and customer expansion, with the producer's converting business connecting those commercial routes.
Geography Analysis
West India (Gujarat, Maharashtra, Goa) Plastic Industry
West India held a 46.71% share of the India plastic industry market size in 2026, making it the largest regional market. In FY2025-26, ONGC Petro additions Limited's Dahej SEZ cracker had annual ethylene and propylene capacities of 1.1 million and 0.6 million metric tons, respectively, alongside matching downstream polyethylene and polypropylene processing capacity. This concentration links feedstock conversion and polymer manufacture within one industrial location, providing a substantial supply base for converters. Converters served from Dahej therefore depend on the cracker's operating continuity for polyethylene and polypropylene supply.
South India (Tamil Nadu, Karnataka, Telangana, Andhra Pradesh, Kerala) Plastic Industry
South India is the fastest-growing regional market, with a forecast CAGR of 7.2% over 2027-2032. By May 15, 2026, Ester Industries Ltd had commissioned an rPET extruder with annual capacity of 20,000 metric tons at its Hyderabad facility, operated by wholly owned subsidiary Ester Filmtech. The company linked this capability to recycled-content demand in BOPET films and prospective sales of film-grade and textile-grade rPET.[1] Vertical integration can consequently turn a film producer into a merchant-resin supplier, broadening South India's commercial participation from converted films to recycled film-grade and textile-grade polymer sales.
North India combines resin production with commercially important sales destinations, while East and North-East India includes a distinct regional conversion channel. GAIL (India) Ltd operates its gas-based HDPE and LLDPE complex at Pata in Uttar Pradesh. In FY2025-26, Brahmaputra Cracker and Polymer Limited identified the NCR and Kanpur as northern markets offering high net sales realization. Its Northeast polymer sales rose to 48,140 metric tons in FY2025-26 from 43,841 metric tons in FY2024-25, serving applications including polyethylene film, rotational molding and polypropylene raffia. For Brahmaputra Cracker and Polymer Limited, northern markets support a realization-led sales proposition, while Northeast demand broadens regional volume across several conversion applications.
Regulatory Framework and Outlook
Selected jurisdictions compare India's national framework with Maharashtra's additional restrictions from the perspective of resin suppliers serving plastic-packaging converters. The national amendment effective March 31, 2026, sets category-specific recycled-content duties, with documented statutory exemptions where recycled material use is legally prohibited. Maharashtra restricts specified bags and disposable plastic and thermocol products through a state notification implemented by designated state and local officers.
Regulatory Table of India Plastic Industry
| Decision factor | India | Maharashtra |
|---|---|---|
| Primary authority | CPCB for the centralized packaging portal | Designated state and municipal enforcement officers |
| Key instruments or direction | Plastic Waste Management Amendment Rules, 2026 and scheduled packaging targets | Specified-product restrictions under the 2018 state notification |
| Commercial effect | Recycled-material sourcing duties and documented statutory exemptions | Restricted resin outlets in listed bags and disposable products |
| Current policy attractiveness | Medium | Low |
| Future direction of policy attractiveness | Hardening | Hardening |
| Source: Mordor Intelligence | ||
National policy attractiveness is medium because permitted packaging uses coexist with material-sourcing and annual-return obligations for producers, importers and brand owners. The enacted target schedule rises through FY2028-29 and onwards, making future requirements harder for packaging customers to meet. Maharashtra's low rating reflects the additional limits on specified product outlets and its designated enforcement arrangements. The operative state framework is the 2018 notification with amendments through 2022, supporting continuity in its product restrictions even as national packaging targets apply in Maharashtra.
Value Chain Stages
The value chain compares resin manufacture, distribution and downstream conversion as distinct commercial activities. Reliance Industries Ltd produces polyethylene and polypropylene for sale, establishing the upstream supplier role. GAIL (India) Ltd markets polymers through its Pata plant and consignment stockist points across India, connecting production with distributed supply channels.
Value Chain Analysis Table of India Plastic Industry
| Primary activity | Key participants | Value capture | Bottleneck | Resilience response |
|---|---|---|---|---|
| Polymer resin production | Resin producers such as Reliance Industries Ltd | Polyethylene and polypropylene sales | Matching production mix to converter demand | Align resin-family output with contracted sales |
| Resin marketing and distribution | Polymer marketers such as GAIL (India) Ltd | Resin sales through plant and stockist channels | Coordinating deliveries across stock points | Link plant dispatches to stockist replenishment |
| Conversion into plastic products | Plastic product manufacturers such as Jain Irrigation Systems Ltd and Supreme Industries Ltd | Sales of manufactured plastic products | Crude-linked polymer prices | Align resin commitments with product pricing |
| Source: Mordor Intelligence | ||||
Jain Irrigation Systems Ltd reported 152,998 metric tons of polymer consumption in its Plastic Division in FY2025-26 and linked polymer-price fluctuations to crude oil. That exposure can change the cost of manufacturing plastic products even when a converter's physical polymer requirements are unchanged. Converters therefore carry resin-price swings in their product margins unless selling prices adjust, which places crude-linked price risk at the conversion stage.
Competitive Landscape
Market Concentration
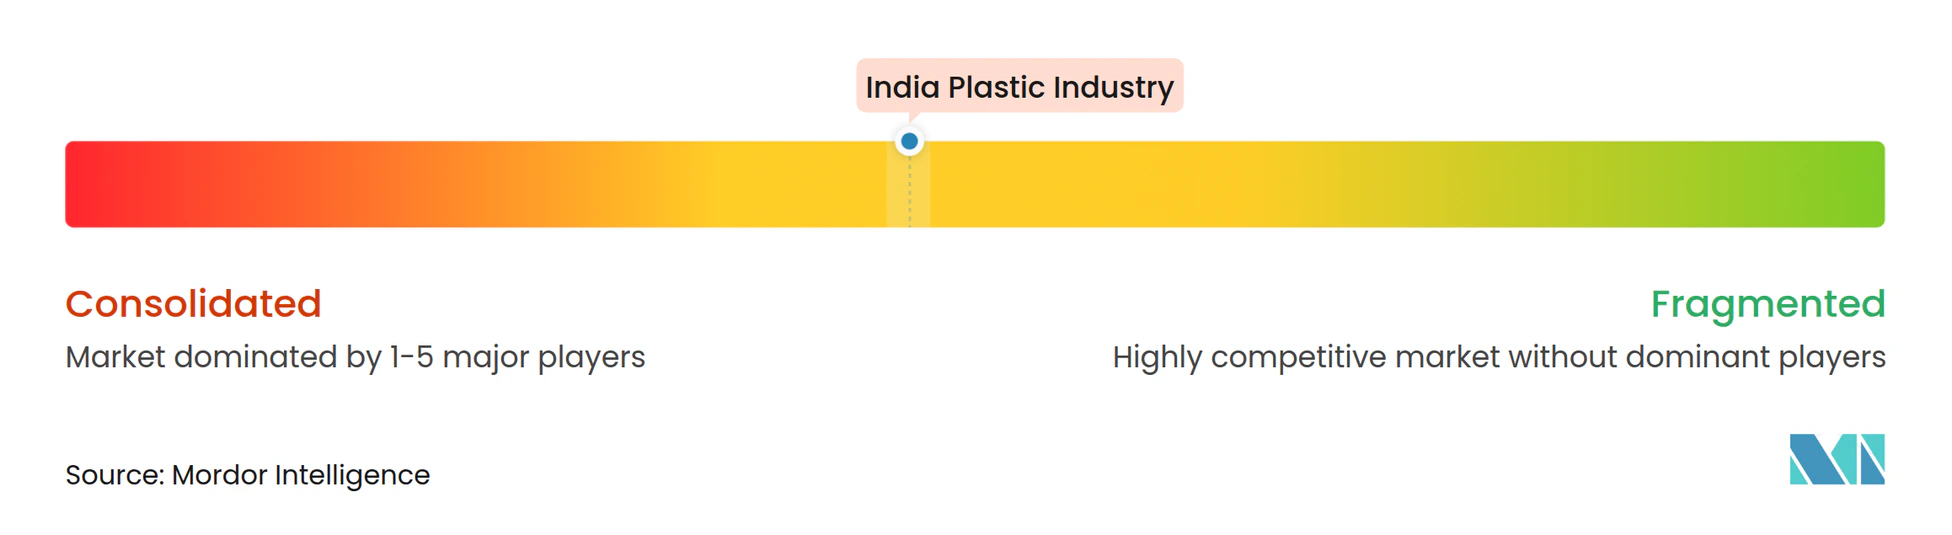
Large-scale resin production anchors a competitive structure that also includes application-specific downstream converters, giving manufacturing scale and finished-product demand different forms of commercial influence. Reliance Industries Ltd reported production meant for sale of 3.1 million metric tons of polypropylene and 2.3 million metric tons of polyethylene in FY2025-26. Indian Oil Corporation Ltd and GAIL (India) Ltd supply polymer grades, including polypropylene for specific converting requirements. Supreme Industries Ltd manufactures plastic goods, while Nilkamal Ltd produces molded plastic furniture, giving both downstream conversion roles. The resulting commercial relationship links broad resin portfolios with customers whose requirements depend on their finished-product applications.
GAIL commissioned a polypropylene plant with annual capacity of 60,000 metric tons at its Pata Petrochemical Complex in Uttar Pradesh in 2026, producing homopolymer and copolymer grades. Its total polymer production fell to 768,000 metric tons in FY2025-26 from 827,000 metric tons in FY2024-25. These developments distinguish available product scope from realized throughput, so competitive gains require the new production capability to become commercially utilized supply. Broader polypropylene grades can improve GAIL's access to converting applications, while the output decline makes production recovery a separate competitive task from portfolio expansion.
Supreme Industries Ltd's Plastic Piping Systems business had installed capacity of 1 million metric tons per year as of March 31, 2026. Nilkamal Ltd reported intense price competition in entry- and mid-range molded furniture and shifted its focus toward value-added and premium offerings in FY2024-25. The piping capacity establishes manufacturing scale, while the furniture response emphasizes differentiation under price pressure. For resin suppliers, that furniture shift makes application-specific grades a potential way to support higher-value molded products. A grade premium is commercially useful only if the resulting furniture differentiation can support its cost, so the opportunity depends on the converter's product economics.
India Plastic Market Leaders
-
Reliance Industries Ltd
-
Indian Oil Corporation Ltd
-
GAIL (India) Ltd
-
Supreme Industries Ltd
-
Nilkamal Ltd
- *Disclaimer: Major Players sorted in no particular order
India Plastic Industry Companies Covered in this Report
- Reliance Industries Ltd
- Indian Oil Corporation Ltd
- GAIL (India) Ltd
- Haldia Petrochemicals Ltd
- Supreme Industries Ltd
- Nilkamal Ltd
- Time Technoplast Ltd
- Jain Irrigation Systems Ltd
- Kingfa Science and Technology India Ltd
- Mayur Uniquoters Ltd
- Plastiblends India Ltd
- Responsive Industries Ltd
- Safari Industries (India) Ltd
- VIP Industries Ltd
- Cello Consumer Products Pvt Ltd (Cello)
- Cosmo First Ltd
- Alternicq Ltd
- Ester Industries Ltd
- SRF Ltd
- Jindal Poly Films Ltd
Key Opportunities for Market Participants
The opportunities compare recycled-content resin supply, reuse-oriented material specifications and waste-derived circular polymer sales. India's March 2026 amendment sets FY2026-27 recycled-content targets of 40%, 10% and 5% for packaging Categories I, II and III, respectively. Where applicable law prohibits recycled material use, claimants must document statutory exemptions in annual returns. Alternicq Ltd (formerly Manjushree Technopack Limited) manufactures rigid plastic packaging, including post-consumer recycled pails.
Market Opportunities Table of India Plastic Industry
| Opportunity | Why now | Buyer / lead segment | Recommended play | Main barrier | Likely beneficiaries |
|---|---|---|---|---|---|
| Recycled resin for permitted rigid-packaging uses | FY2026-27 category-specific recycled-content duties | Rigid-packaging converters, including pail manufacturers | Qualify recycled resin against each permitted application | Restrictions on recycled content in regulated uses | Recycled-resin suppliers and converters such as Alternicq Ltd |
| Resins specified for repeated rigid-packaging use | 15% reuse obligation in FY2026-27, subject to statutory exemptions | Brand owners using Category I rigid packs from 0.9 to under 4.9 liters or kilograms | Develop reusable-pack resin specifications; brand owners document exemptions in annual returns | Maintaining product quality, authenticity and mandatory compliance | Resin suppliers serving covered rigid-packaging converters |
| Waste-derived circular polymer supply | March 2026 rules classify waste-to-new-plastic conversion as recycling | Converters seeking circular polymer grades | Qualify circular resin and secure repeat supply agreements | Building repeat converter demand beyond regulatory recognition | Circular polymer producers such as Reliance Industries Ltd |
| Source: Mordor Intelligence | |||||
Reliance Industries Ltd produced ISCC Plus-certified circular polymers at Jamnagar using chemically recycled plastic-waste-based pyrolysis oil in FY2025-26. This operating base makes material qualification and customer development a more concrete opening than regulation alone. The central opportunity is recurring resin supply for legally permitted applications, with application compliance and reuse performance determining which policy obligations become durable converter demand.
Recent Industry Developments in India Plastic Industry
- Aug 2026: By August 11, Grasim Industries Ltd had reported commercial production at its Vilayat, Gujarat, CPVC resin plant, with planned capacity of approximately 50,000 metric tons per year. The project involved collaboration with Lubrizol Advanced Materials India Private Limited.
- Mar 2026: India's prime minister laid the foundation stone on March 11 for Bharat Petroleum Corporation Limited's planned polypropylene unit at Kochi Refinery in Kerala, with proposed annual capacity of 400,000 metric tons.
- Feb 2026: GAIL (India) Ltd commissioned a polypropylene plant at Pata on February 4 with annual capacity of 60,000 metric tons, bringing the complex's total polymer capacity to 870,000 metric tons per year.
India Plastic Industry Report Scope and Research Methodology
Market Definition and Coverage
The India plastic industry market measures annual spending on plastic polymers sold in India to plastic converters, valued at the resin transaction before conversion into finished articles. Demand is attributed to the processing route, end-use application, and Indian region where converters use the resin.
Scope exclusions: Recycling and waste-management service revenues, non-plastic substitute materials sold outside the plastics value chain, plastic converting machinery and processing service fees, finished plastic articles sold after conversion, and upstream petrochemical feedstocks sold separately are excluded.
Segments Covered in This Report
- By Polymer Type
- Polyethylene (LDPE, LLDPE, HDPE)
- Polypropylene
- Polyvinyl Chloride
- Polyethylene Terephthalate (PET)
- Polystyrene and EPS
- Acrylonitrile Butadiene Styrene (ABS)
- Polycarbonate
- Others (PMMA, POM, etc.)
- By Specialty and Bioplastics Type
- Biodegradable Bioplastics (PLA, PHA, Starch Blends)
- Bio-Based Non-Biodegradable Plastics (Bio-PE, Bio-PET)
- By Processing Technology
- Injection Molding
- Blow Molding
- Extrusion
- Thermoforming
- Rotational Molding
- Compression Molding
- Additive Manufacturing (3D Printing)
- By Application
- Packaging
- Rigid Packaging
- Flexible Packaging
- Building and Construction
- Automotive and Transportation
- Electrical and Electronics
- Agriculture and Irrigation
- Healthcare and Pharmaceuticals
- Consumer Goods and Housewares
- Furniture and Bedding
- Others (Textiles, Sports and Leisure)
- Packaging
- By Geography
- West India (Gujarat, Maharashtra, Goa)
- North India (Delhi-NCR, Uttar Pradesh, Punjab, Haryana, Rajasthan)
- South India (Tamil Nadu, Karnataka, Telangana, Andhra Pradesh, Kerala)
- East and North-East India (West Bengal, Odisha, Bihar, Assam and NE States)
Data Sources, Market Sizing, and Validation
Desk Research
Secondary research draws on sources such as the U.S. Department of Commerce's India plastics guide, the Department of Chemicals and Petrochemicals' statistical series, its expert committee report on single-use plastics, the Press Information Bureau's release on the Plastic Industry Status Report 2025, and Plastindia Foundation industry material. These sources help establish polymer production and trade context, consumption by resin family and use, policy conditions, and the Indian industry's operating structure.
Company annual reports, exchange filings, investor presentations, and reputable business press provide company-level capacity, sales, input-cost, and investment context that can be checked against public industry evidence. These sources are illustrative, not exhaustive, and further sources inform collection, validation and clarification.
Primary Interviews and Surveys
Primary research uses interviews and structured surveys with India-based polymer producers, importers, converters, distributors, and industry specialists selected across company sizes and operating roles. The interviews and surveys test secondary findings on resin demand, realized selling prices, capacity use, channel inventory, and application mix, while targeted follow-up addresses material gaps or inconsistent regional and segment evidence. Analysts triangulate estimates across respondent observations, official statistics, company disclosures, and trade evidence.
Distribution of primary research fieldwork respondents
| Company type | Respondent position | Region |
|---|---|---|
| Top tier: 30% | CXOs: 20% | |
| Mid tier: 45% | Functional/Unit leaders: 35% | |
| Smaller Players: 25% | Managers: 45% |
Market-Sizing & Forecasting
A top-down estimate quantifies annual Indian resin sales to converters in USD, then allocates that value across polymer families, specialty and bioplastics types, processing routes, applications, and four Indian regions using observed production, imports, exports, end-use consumption, and regional capacity and demand signals. Key indicators include polymer output and trade volumes to anchor available supply, converter and end-use activity to indicate resin absorption, producer selling prices to translate volume into value, and capacity additions or utilization to inform supply and growth. Their definitions and periods are aligned before use. A multivariate regression relates historical resin value to these demand and price indicators, with scenario analysis for material changes such as new polymer capacity, feedstock shocks, or regulatory shifts. Selective bottom-up checks, including producer supply roll-ups and sampled resin price multiplied by converter volume, test the top-down totals. Missing company or regional observations are bounded using adjacent public production, trade, and demand series. Segment shares are built from evidence on polymer output and use, process-specific consumption, application demand, and regional converter activity, and India-based industry respondents check the direction and key assumptions behind variable-level forecasts.
Data Validation & Update Cycle
Analysts triangulate official production and trade series, company disclosures, market research, and respondent evidence, then investigate outliers and material differences from prior periods or independent demand indicators. A second analyst review checks source periods, units, boundary fit, calculations, and segment totals, with anomalies resolved or queried through source re-contact when definitions conflict, new information changes a key input, or a material gap remains. The dataset is refreshed annually, reviewed between cycles after material policy, capacity, or price events, and checked again in a fresh pre-delivery review.
Mordor Intelligence's India Analysis of Plastic Market Size Versus Other Published Estimates
Published estimates can differ in the transactions and products they count and the inputs used to model demand. The India plastic industry market measures annual spending on plastic polymers sold in India to plastic converters, valued at the resin transaction before conversion into finished articles.
Key Gap Drivers include the study's defined coverage and market-specific modeling choices. Key indicators include polymer output and trade volumes to anchor available supply, converter and end-use activity to indicate resin absorption, producer selling prices to translate volume into value, and capacity additions or utilization to inform supply and growth.
Benchmark comparison
| Source | Market Size | Gaps in Research Methodology |
|---|---|---|
| Mordor Intelligence | USD 49.98 B (2027) | |
| Regional Consultancy A | USD 46.77 B (2025) | At its 2025 base, this estimate is 6.4% below this report's 2027 value of USD 49.98 B, 2 years later. |
| Global Research Publisher B | USD 73.4 B (2025) | At its 2025 base, this estimate is 46.9% above this report's 2027 value of USD 49.98 B, 2 years later. |
Mordor Intelligence's analysts triangulate official production and trade series, company disclosures, market research, and respondent evidence, then investigate outliers and material differences from prior periods or independent demand indicators.
Key Questions Answered in the Report
What is the India plastic industry market size and growth outlook?
The market is forecast to rise from USD 49.98 billion in 2027 to USD 68.41 billion by 2032, at a CAGR of 6.48% over 2027-2032.
Which forces support plastic resin demand in India?
Electric two-wheeler adoption supports potential polymer-component demand. Registrations rose 21.81% in FY2025-26 from FY2024-25 in data covering 1,463 of 1,466 registration offices and excluding Telangana.
Which polymer has the largest share of Indian resin sales value?
Polyethylene, including LDPE, LLDPE and HDPE, led with a 33.64% share in 2026.
Which companies are major participants in India's plastics sector?
Resin producers include Reliance Industries Ltd, Indian Oil Corporation Ltd and GAIL (India) Ltd. Supreme Industries Ltd and Nilkamal Ltd are downstream converters.
How do input costs affect the Indian plastic resin outlook?
Higher feedstock costs can compress producer margins. Haldia Petrochemicals Ltd reported an average polymer-naphtha spread of USD 349 per metric ton in FY2024-25 versus USD 374 in FY2023-24, with polymer prices almost unchanged.
Which Indian regions lead plastic resin demand and growth?
West India led with a 46.71% market share in 2026, while South India is forecast to grow fastest at a CAGR of 7.2% over 2027-2032.